
NEW YORK, July 31, 2026, 08:09 EDT Chevron posted a 9% earnings beat, powered by its refining unit, as the company navigated an oil market shock.
- Adjusted earnings per share were $6.06, surpassing the LSEG consensus estimate by roughly 9%.
- Output increased by 5.5% from the previous quarter, in contrast to a 1.7% drop at its bigger U.S. competitor.
- Quarterly free cash flow accounted for 4.7% of market value, almost double the ratio seen among peers.
Chevron NYSE:CVX posted its highest quarterly profit in more than six years, with adjusted earnings totaling $12.0 billion. Earnings came in at $6.06 per share, surpassing the $5.56 consensus from LSEG analysts.
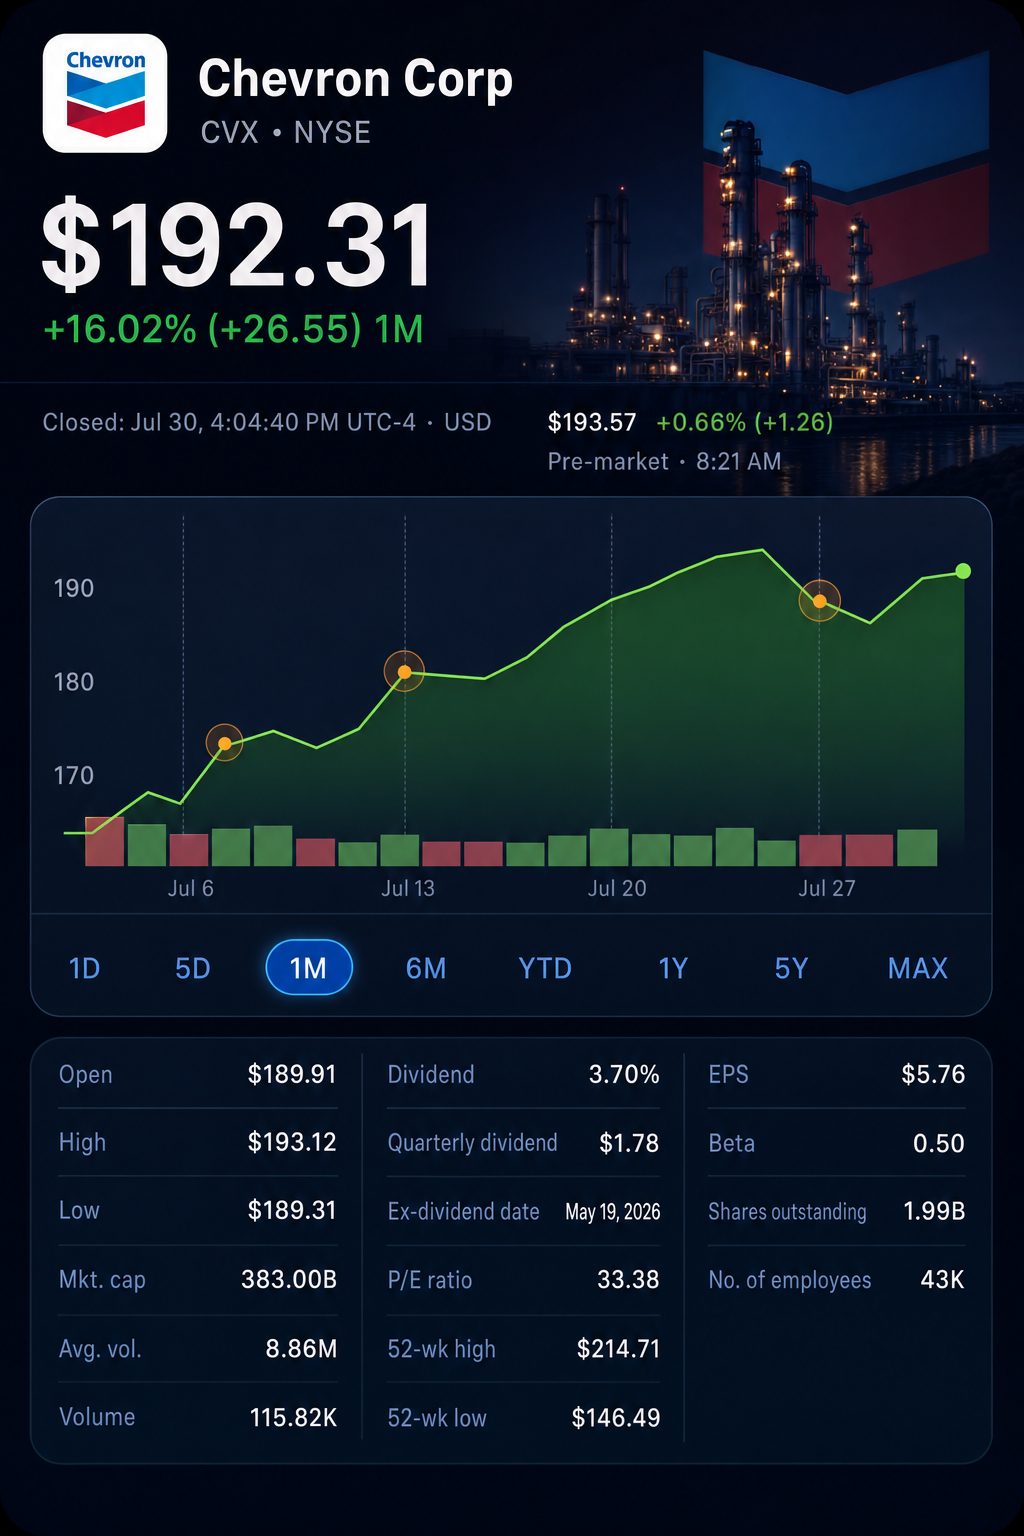
The stock rose 0.4% to $192.31 during early trade, with the price noted at 7:48 a.m. EDT. Regular NYSE trading is scheduled to start at 9:30 a.m.
The implications for investors extend past just rising oil prices. Chevron increased output, whereas ExxonMobil NYSE:XOM faced significant supply disruptions in the Middle East. As a result, Chevron delivered a clearer outperformance on earnings and posted comparatively higher cash flow.
Chevron reported faster progress in its key operational metrics and cash flow indicators.
| Chevron metric | Q2 2026 | Q1 2026 | Q2 2025 |
|---|---|---|---|
| Adjusted earnings | $12.0 bln | $2.8 bln | $3.1 bln |
| Adjusted EPS | $6.06 | $1.41 | $1.77 |
| Operating cash flow | $22.6 bln | $2.5 bln | $8.6 bln |
| Adjusted free cash flow | $15.4 bln | $4.1 bln | $4.9 bln |
| Production | 4.070 mln boepd | 3.858 mln | 3.396 mln |
| Return on capital employed | 21.4% | 4.5% | 6.2% |
Data provided by the company. “Boepd” refers to barrels of oil equivalent per day. Business Wire
Chevron’s Platts gauge showed Brent averaging $104 per barrel, up from $81 in the previous quarter. Gains were further boosted by refining operations.
Downstream profits turned to $4.87 billion, after reporting a loss in the previous quarter. That figure represents 41% of the company’s adjusted earnings, as indicated by a basic ratio. U.S. refinery throughput hit an all-time high at 1.07 million barrels per day.
According to RBC Capital Markets analyst Biraj Borkhataria, downstream was the main factor behind the earnings surprise. He called the quarter one of “robust operational performance and strategic consistency.” Reuters
There was a notable difference in operations compared to Exxon.
| Q2 comparison | Chevron | ExxonMobil |
|---|---|---|
| Adjusted EPS | $6.06 | $3.52 |
| LSEG consensus | $5.56 | $3.60 |
| Earnings surprise | +9.0% | -2.2% |
| Production | 4.070 mln boepd | 4.514 mln boepd |
| Sequential production change | +5.5% | -1.7% |
| Identified Middle East disruption | Limited output from Partitioned Zone | 450,000 boepd taken offline in Qatar; 50,000 bpd in the UAE |
Reported figures are used to determine surprise and production changes.
Exxon remained the larger overall oil and gas producer, but its production fell from 4.594 million boepd. Some UAE barrels also faced delayed revenue recognition because of shipping restrictions.
Chevron recorded a 20% increase in production compared with the same period last year. The rise was driven by legacy Hess holdings, as well as activity in the Permian Basin and Gulf. The company’s reduced Middle East presence helped minimize operational challenges.
The cash gap is more pronounced. Chevron produced marginally higher quarterly free cash flow despite having about 54% of Exxon’s market capitalization.
| Cash and valuation comparison | Chevron | ExxonMobil |
|---|---|---|
| Premarket valuation | $381.9 bln | $704.2 bln |
| Q2 free cash flow (reported) | $18.1 bln | $17.2 bln |
| Quarterly FCF to market value | 4.7% | 2.4% |
| Chevron adjusted FCF to market value | 4.0% | — |
| Combined dividends and repurchases | $6.5 bln | $9.4 bln |
| Payouts as share of reported FCF | 35.9% | 54.5% |
| Debt cut | $8.4 bln | $7.0 bln |
| Debt reduction versus market value | 2.2% | 1.0% |
Cash ratios use straightforward, non-annualized formulas. Calculations for non-GAAP free cash flow vary by company. Market valuations shown are premarket figures.
Chevron maintained its payouts to shareholders, buying back $3.0 billion in stock and issuing $3.5 billion in dividends. CFO Eimear Bonner commented, “We’re not changing our plan around a single quarter.” Reuters
That discipline supported balance-sheet improvement. Chevron reduced its debt by an unprecedented $8.4 billion. The company maintained its yearly share buyback target between $10 billion and $20 billion.
Certain operational benefits might persist beyond the recent price surge. Synergies linked to Hess achieved a yearly run-rate of $1.5 billion half a year sooner than planned. Additionally, structural cost reductions reached $3 billion ahead of expectations.
Chevron entered into a 20-year electricity supply deal with Microsoft NASDAQ:MSFT. The proposed West Texas plant will deliver 2.67 gigawatts to a data center.
The immediate challenge is the oil market curve. On Friday, Brent was at $90.04, around 13% lower than Chevron’s average for the previous quarter. This sets a more difficult sequential earnings comparison.
Risks: An escalation could impact Chevron operations and key shipping lanes. A lasting resolution might narrow crude price spreads and reduce refining margins. U.S. government action remains a concern following recent allegations of price-gouging.
Chevron gave investors a clearer route into volatile energy markets than Exxon did. The advantage came from volume, refining operations and cash conversion. Its strengths extended beyond oil alone.
Related articles: NYSE:CVX