
DETROIT, August 2, 2026, 16:04 EDT
- GM finished Friday at $88.86, up 7.5% on the week.
- GM has a market-cap-to-2026 adjusted-EBIT ratio of 5.4 times. Ford’s equivalent figure stands at 5.6 times.
- Initial figures indicate the U.S. sales rate for July reached 16.9 million vehicles, marking the highest level seen so far this year.
General Motors closed on Friday at $88.86, marking a 7.5% rise for the week. U.S. markets did not open on Sunday. The share price ended 3.3% under the 52-week high reached on Wednesday.
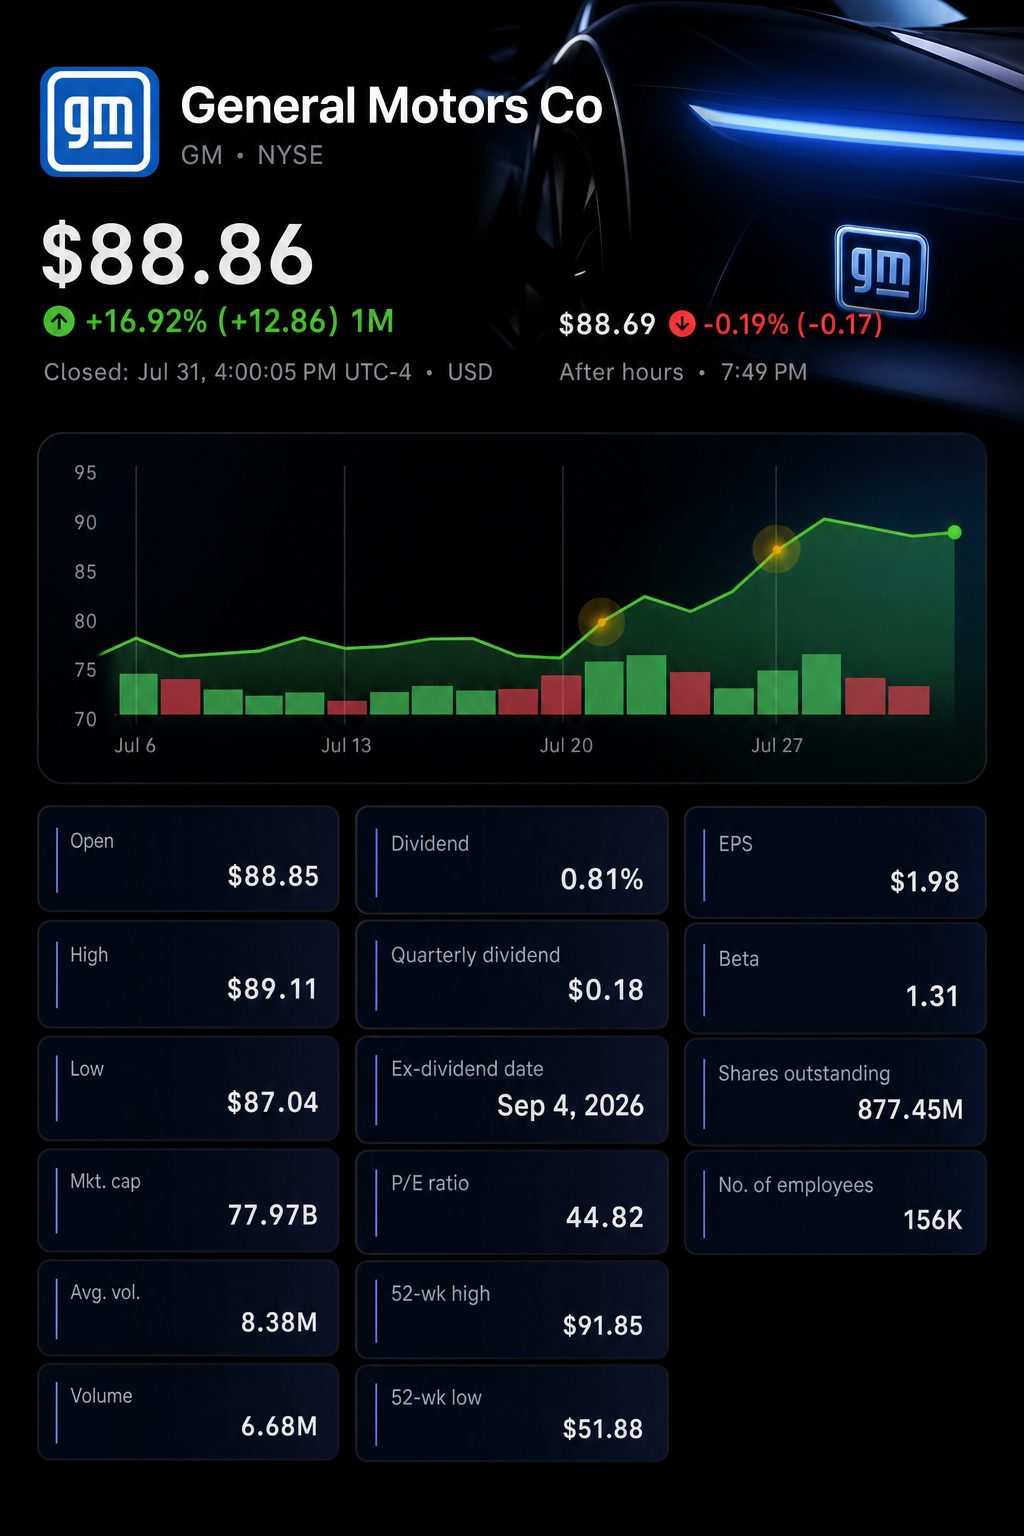
GM’s stock rebound means it still trades at a marginally lower earnings multiple versus Ford. GM’s market capitalisation of $80.9 billion represents 5.4 times its adjusted EBIT midpoint, while Ford’s multiple stands at 5.6 times.
This is a straightforward equity-value proxy rather than enterprise-value-to-EBIT. Still, the comparison is notable. GM generated significantly higher operating profit from almost the same quarterly revenue.
| Company | Friday market value | 2026 adjusted-EBIT outlook | Midpoint | Market value/midpoint |
|---|---|---|---|---|
| General Motors | $80.9 billion | $14.0-$16.0 billion | $15.0 billion | 5.4x |
| Ford | $58.5 billion | $10.0-$11.0 billion | $10.5 billion | 5.6x |
The ratios use Friday’s market values compared to company guidance midpoints. Debt, cash and captive-finance balance sheets are excluded.
GM’s proxy multiple trails Ford’s by roughly 3.3%. The gap persists even with GM holding a three-point margin advantage in the second quarter.
GM posted an adjusted operating profit that exceeded Ford’s by about $1.4 billion. Each automaker reported quarterly revenue of approximately $48 billion. Stellantis N.V. NYSE:STLA continued to lag significantly in terms of margin.
| Company | Q2 revenue | Adjusted operating profit | Adjusted margin |
|---|---|---|---|
| General Motors | $48.03 billion | $3.94 billion | 8.2% |
| Ford | $48.3 billion | $2.5 billion | 5.2% |
| Stellantis | €43.48 billion | €773 million | 1.8% |
These metrics are determined by the companies and are not GAAP measures. Stellantis presents its results in euros. In comparison, GM and Ford use dollars.
That difference in operations allowed GM to outpace its rivals last week. The S&P 500 rose 1.0%.
| Security | Friday close | Friday move | Weekly move |
|---|---|---|---|
| General Motors | $88.86 | up 0.5% | up 7.5% |
| Ford | $14.68 | down 1.2% | up 2.2% |
| Stellantis | $5.76 | down 1.7% | up 1.2% |
| S&P 500 | 7,489.72 | up 0.7% | up 1.0% |
Weekly stock changes reflect closing prices from July 24 to July 31.
GM has twice increased its yearly adjusted EBIT outlook. By July, the midpoint rose to $15 billion, which is $1 billion higher than where it stood in January.
| Guidance date | Adjusted EBIT | Midpoint | Adjusted automotive free cash flow | Adjusted EPS |
|---|---|---|---|---|
| January 27 | $13.0-$15.0 billion | $14.0 billion | $9.0-$11.0 billion | $11.00-$13.00 |
| April 28 | $13.5-$15.5 billion | $14.5 billion | $9.0-$11.0 billion | $11.50-$13.50 |
| July 21 | $14.0-$16.0 billion | $15.0 billion | $9.5-$11.5 billion | $12.00-$14.00 |
The midpoints reflect arithmetic averages based on GM’s stated ranges.
Adjusted automotive free cash flow in the second quarter rose 78% to $5.03 billion. The midpoint of the full-year outlook is now $10.5 billion.
GM customers have “been very resilient,” according to finance chief Paul Jacobson. Last quarter, the average price paid for a GM vehicle in the United States was roughly $52,000. Reuters
Recent projections in the sector indicate strong demand, but affordability continues to decline. J.D. Power estimated the annualized sales rate for July at 16.9 million, calling it the fastest pace seen in 2026.
Average monthly payments are projected to reach a record $808 for July. Estimated incentives increased by 8.1% compared to a year ago. Cox Automotive economist Charlie Chesbrough said “more affluent buyers” were driving the market. JD Power
Stellantis issued a caution regarding execution. The company’s adjusted operating income reached €773 million, falling short of the €914 million analyst consensus. Shares declined by 4.3% on Thursday.
This week, U.S. job openings are scheduled for release on Tuesday, followed by payrolls data on Friday. GM’s next investor event is set for August 12.
Risks: GM continues to project tariff expenses between $2.5 billion and $3.5 billion. Additional increases in the cost of materials, chips and logistics may reduce earnings by a further $1.5 billion to $2 billion. Softer job market conditions could challenge $52,000 vehicle price levels.
For investors, the upcoming focus is on cash conversion. Achieving the increased $10.5 billion midpoint would reinforce the valuation argument, while falling short would undermine it.
Related articles: NYSE:GM