
NEW YORK, August 10, 2026, 16:17 EDT
- Spot gold gained 0.8% to $4,376.56, reaching its highest level since June 5.
- China increased its official reserves by roughly 20 metric tons in July.
- The Reuters median forecast for 2026 stands at $4,509, representing a 3.0% increase from Monday’s spot price.
- U.S. July inflation figures will be released on Wednesday at 08:30 EDT.
Gold climbed to its highest in nine weeks on Monday, with technical buying boosting last week’s strong rally. Spot gold advanced 0.8% to $4,376.56 per ounce by 14:45 EDT, marking its strongest level since June 5. U.S. gold futures closed up 0.5% at $4,419.70.
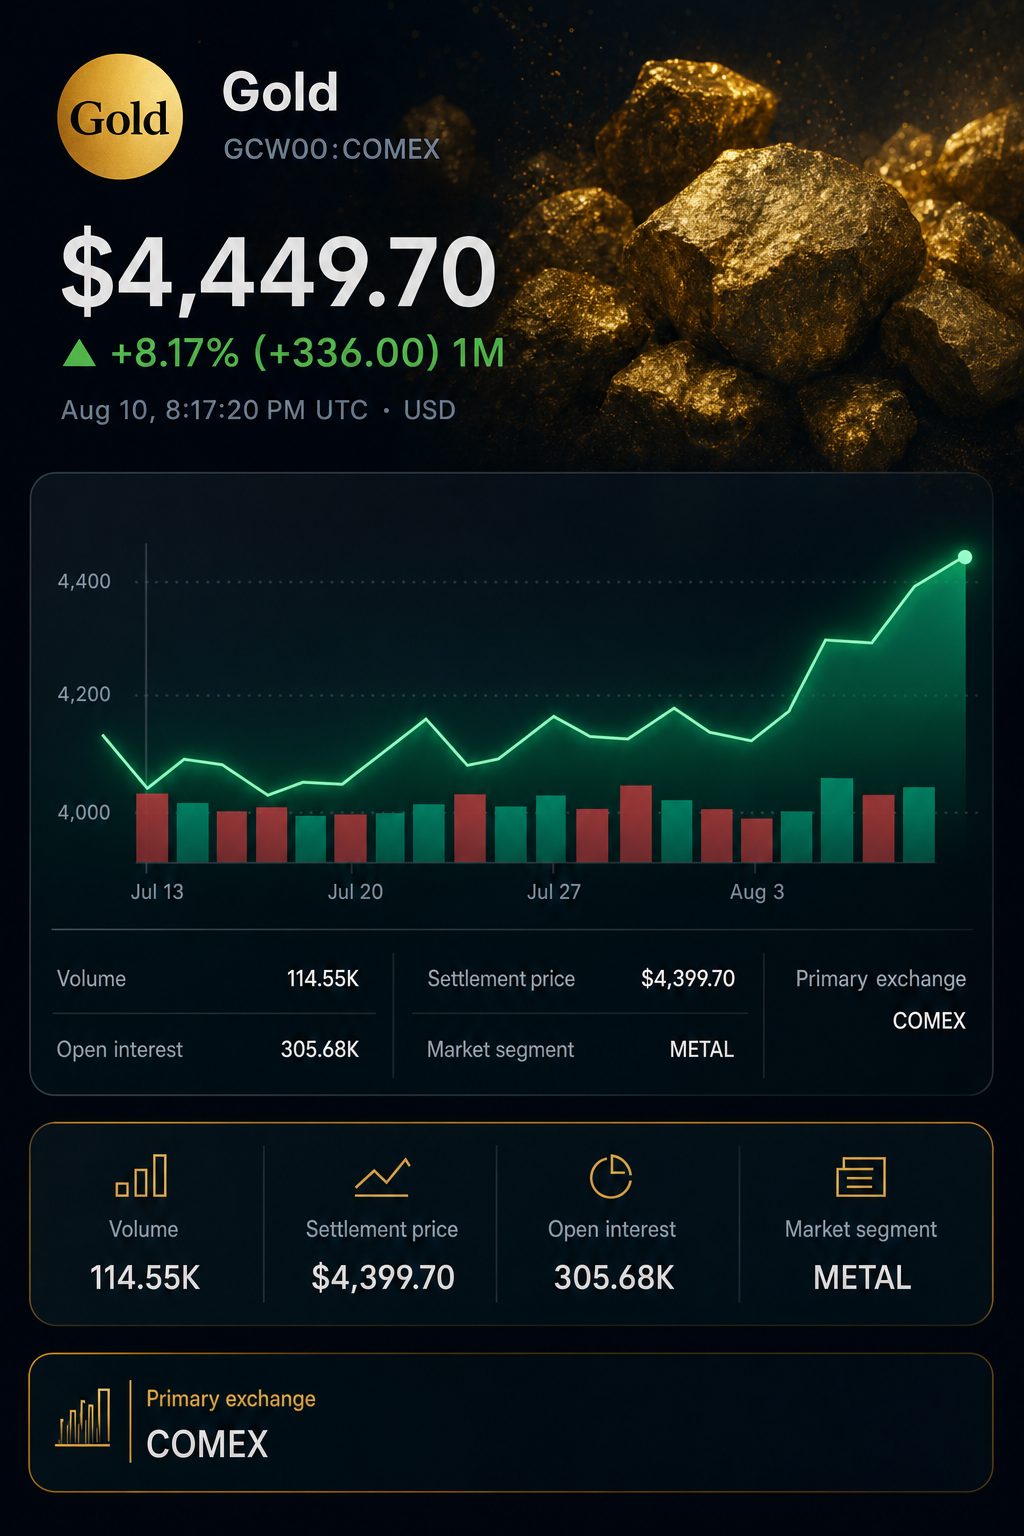
The move brings $4,500 back into focus, a level now just 2.8% higher than Monday’s spot price. This is also near a $4,493 technical resistance point monitored by the World Gold Council.
Distance is significant. According to a Reuters poll conducted in July, the median forecast for the 2026 average stands at $4,509. This represents just a 3.0% increase from Monday’s spot price. The number refers to an annual average, rather than a specific target.
U.S. stock markets had already shut for the day at the time of this report. Gold saw gains on Monday, but silver provided a more pronounced risk indicator, climbing 3.1%.
| Metal | Monday price | Daily move | Investor signal |
|---|---|---|---|
| Gold | $4,376.56/oz | +0.8% | Highest in nine weeks |
| Silver | $65.50/oz | +3.1% | Topped gains among precious metals |
| Platinum | $1,746.50/oz | +0.1% | Slight rise |
| Palladium | $1,380.17/oz | +0.2% | Slight rise |
The closing summary shown above is based on Monday’s Reuters market report. December gold futures traded roughly 1.0% higher than the referenced spot price. This difference, known as basis, may reflect financing, storage, and other carrying costs. It should not be viewed as a unique demand indicator.
“The technical momentum right now is pretty strong for gold overall,” said Bob Haberkorn, senior market strategist at StoneX Group Inc. NASDAQ:SNEX. He noted that traders were watching technical markers as the market approached the release of U.S. inflation figures. Reuters interview
The rebound began ahead of Monday. Last week, gold climbed 7.7%, marking its largest weekly increase since March 27, 2020. London’s afternoon benchmark settled at $4,336 on Friday. The World Gold Council identifies $4,493 as the next major resistance level.
Another support has come from official purchases. In July, China’s central bank raised its gold reserves for the 21st consecutive month, increasing its holdings by 640,000 fine troy ounces, equivalent to roughly 20 metric tons. This marked the largest monthly increase since October 2023.
China’s official reserves data shows the pace is picking up. Gold holdings climbed to 76.08 million ounces, up from 75.44 million in June. The stated value rose to $306.354 billion from $303.724 billion.
| Purchase month | Fine troy ounces added | Approximate metric tons | Change in buying pace |
|---|---|---|---|
| March 2026 | 160,000 | 5.0 | Set as base level |
| June 2026 | 480,000 | 14.9 | Tripled from March |
| July 2026 | 640,000 | 19.9 | Up 33% from June |
Monthly changes in the table reflect figures published by Reuters. The increase in July was about one-third greater than in June. In early August, Chinese gold exchange-traded funds acquired close to six metric tons.
Strategic demand may bring stability to the market, but it does not set valuation. Projections continue to vary significantly, with differing timeframes.
HSBC Holdings plc NYSE:HSBC projects an average of $4,560 in 2026, with a forecast of $4,750 by the end of that year. UBS Group AG NYSE:UBS anticipates prices reaching $5,000 in the first half of 2027. J.P. Morgan Private Bank, part of JPMorgan Chase & Co. NYSE:JPM, estimates a range between $6,000 and $6,300 for 2026.
| Forecaster | Horizon | Gold view | Difference versus $4,376.56 |
|---|---|---|---|
| Reuters poll median | 2026 average | $4,509 | +3.0% |
| HSBC | 2026 average | $4,560 | +4.2% |
| HSBC | End-2026 | $4,750 | +8.5% |
| UBS | First half of 2027 | $5,000 | +14.2% |
| J.P. Morgan Private Bank | 2026 outlook | $6,000–$6,300 | +37.1% to +43.9% |
The Reuters survey included 29 analysts and traders. Its median was lower than $4,916 in the previous poll. The table displays straightforward changes from Monday’s price, which are not the same as comparable returns. Annual averages and subsequent point estimates are based on varying time frames.
UBS stays positive on dips. “Periods of weakness toward $4,000/oz or below may ultimately prove to be opportunities to build strategic exposure,” stated Mark Haefele, global chief investment officer at the firm. Reuters
Rates could swiftly put that perspective to the test. Since gold does not generate income, rising real yields make the metal less attractive. On Monday, traders saw a 52% probability of a Federal Reserve rate hike in September and an 81% likelihood for December.
| Near-term catalyst | Latest or consensus | Prior | Why it matters |
|---|---|---|---|
| July U.S. headline CPI, year on year | 3.4% consensus | 3.5% | Assesses pace of inflation decline |
| July U.S. core CPI, year on year | 2.5% consensus | 2.6% | Signals core pricing trend |
| September Fed increase probability | 52% | Not applicable | Potentially makes gold less attractive if Fed moves |
| December Fed increase probability | 81% | Not applicable | Sustains possibility of further rate hikes |
| CPI release | August 12, 08:30 EDT | Not applicable | Upcoming U.S. data focus |
Consensus figures on inflation and rate expectations are sourced from Reuters and the World Gold Council. The U.S. Bureau of Labor Statistics has set Wednesday for the data release.
Risks: A higher CPI, rising yields, or a stronger dollar may stop the recovery. Gold is still trading 21.8% beneath the January peak of nearly $5,595. While central bank buying can provide some support, it does not offset rate or positioning risks.
Wednesday’s CPI report will serve as the next key decision point. If the data is softer, $4,493 and $4,500 will be tested immediately. A stronger-than-expected reading may bring renewed pressure from yields and the dollar.