
HELSINKI, August 3, 2026, 13:00 EEST — Shares opened trading on Nasdaq Helsinki.
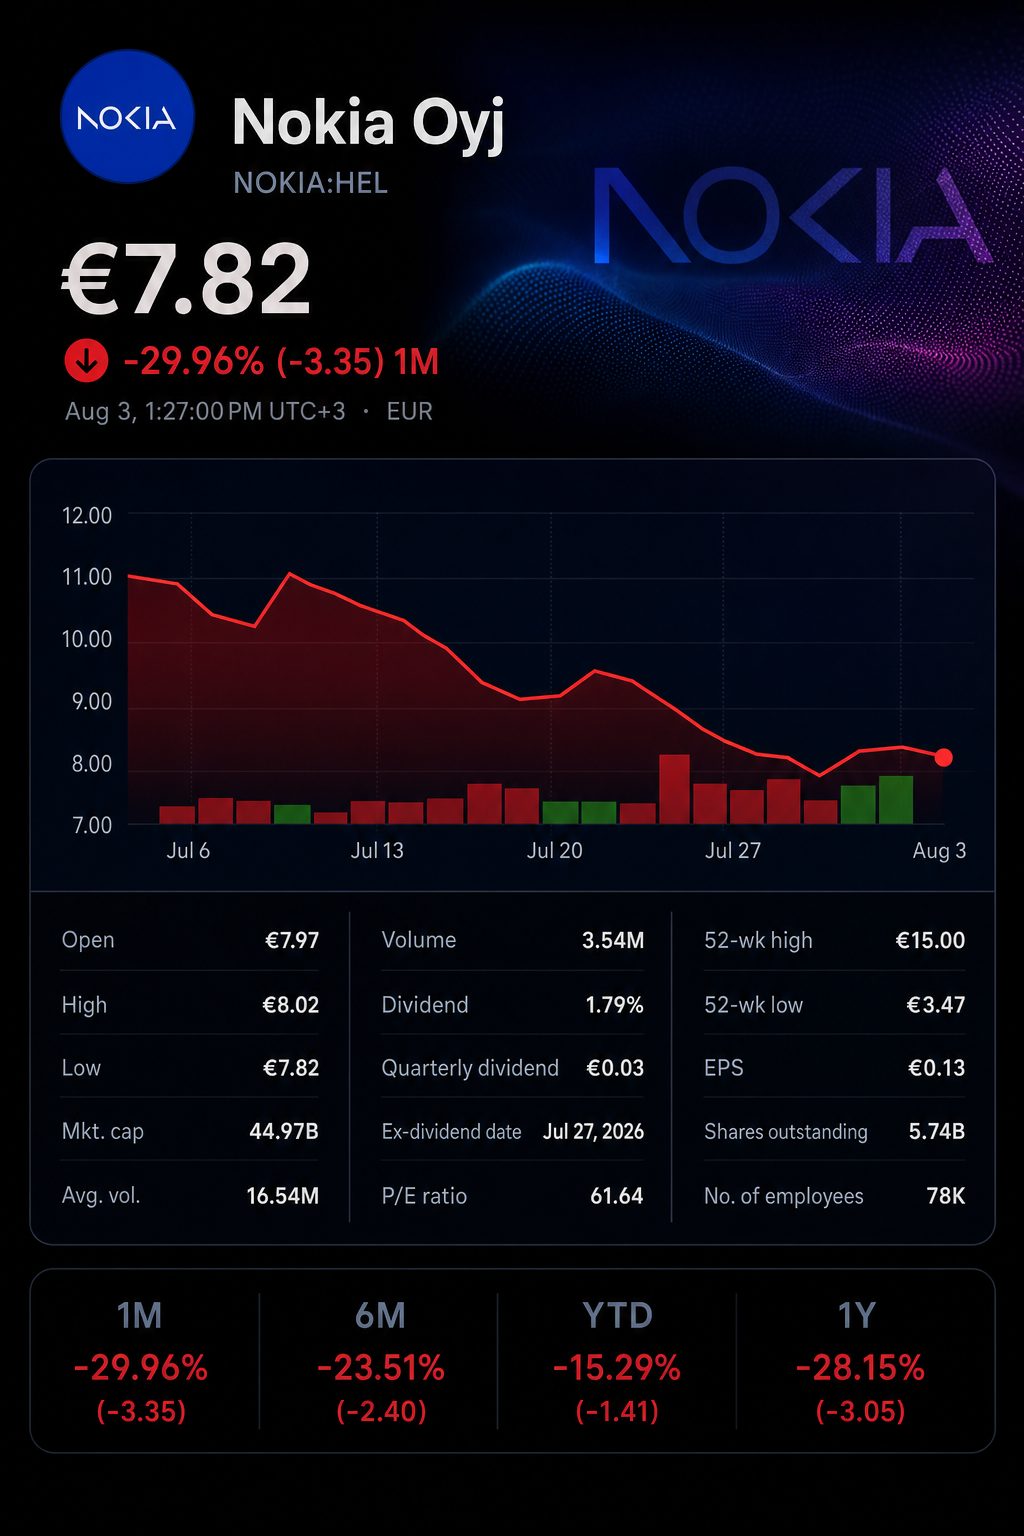
Nokia stock declined 1.3% to approximately €7.85 during midday trading on Monday, lagging behind Finland’s blue-chip index by around 0.8 percentage point. The decline continued the pronounced valuation adjustment following recent results.
No new stock-exchange announcement from Nokia was issued over the weekend. The decrease was thus attributed to ongoing concerns about cash conversion instead of any fresh corporate statement.
The main discrepancy lies between incoming orders and company valuation. During the second quarter, AI and cloud orders amounted to €2.8 billion, equating to 6.3 times the quarter’s revenue. However, Nokia has maintained its outlook for annual operational profits. This indicates investors are looking for tangible cash returns rather than additional order announcements.
The reset in price
| Measure | Latest reading | Comparison |
|---|---|---|
| Nokia intraday price | €7.85 | Falls 1.3% |
| OMX Helsinki 25 | 6,189.04 | Loses 0.5% |
| Nokia versus June high | €14.995 peak | 47.6% lower |
| Nokia versus July 22 close | €9.166 | Down 14.4% |
| One-month performance | — | Slides 28.7% |
| Year-to-date performance | — | Rises 41.1% |
Figures shown intraday are subject to revision and could be delayed. Percentage changes are based on reported prices.
The decline is sharp, though it does not fully erase gains. Nokia is still up roughly 41% so far this year. The majority of the earlier AI premium has been wiped out by the market, though some still lingers.
Q2 performance review
| € millions, except EPS | Q2 2026 | Q2 2025 | Change |
|---|---|---|---|
| Comparable net sales | 4,815 | 4,448 | Up 8% |
| Comparable operating profit | 434 | 367 | Up 18% |
| Comparable operating margin | 9.0% | 8.3% | Increase of 70 bps |
| Comparable diluted EPS | €0.07 | €0.04 | Up 75% |
| Reported operating result | -50 | 147 | Turned negative |
The company’s operational performance this quarter outpaced the reaction in its shares. Comparable operating profit surpassed the €382 million LSEG consensus by 13.6%. Chief Executive Justin Hotard stated: “Demand remains strong, while supply continues to be the main industry constraint.” Reuters
AI demand and composition of business
| Measure | Q2 2026 | Investor comparison |
|---|---|---|
| AI and cloud net sales | €446 million | Increase of 105% |
| AI and cloud order intake | €2.8 billion | Equivalent to 6.3 times Q2 sales |
| Anticipated 12-month conversion | Roughly €1.4 billion | Equal to 3.1 times Q2 sales |
| Network Infrastructure sales | €2.037 billion | 12% higher |
| Network Infrastructure operating margin | 8.1% | Rise of 170 basis points |
| Mobile Infrastructure sales | €2.680 billion | Increase of 6% |
| Mobile Infrastructure operating margin | 11.6% | Drop of 60 basis points |
Estimates for order multiples and the €1.4 billion conversion are derived from information provided by Nokia.
Nokia anticipates converting approximately half of these orders in the next 12 months, representing around €1.4 billion—about 3.1 times its AI-and-cloud revenue for the second quarter. The timing of these conversions is significant. Lengthier conversion periods enhance forward visibility but also increase requirements for delivery and working capital.
The growth-driving segment continues to generate a smaller margin. Network Infrastructure posted an 8.1% margin, compared with 11.6% for Mobile Infrastructure. However, its margin increased by 170 basis points. Sustained operating leverage will be necessary for AI expansion to boost overall group profitability.
Sweden’s Ericsson STO:ERIC-B offered a contrasting picture for the sector, with quarterly sales declining 6%. The company reported an adjusted EBIT margin of 12.4%. Ericsson further cautioned that future margins may be squeezed by AI-driven cost inflation for components.
Nokia against Ericsson
| Q2 indicator | Nokia | Ericsson |
|---|---|---|
| Sales growth (reported) | +8% | -6% |
| Profit growth (adjusted) | +18% | -7% |
| Operating margin (adjusted) | 9.0% | 12.4% |
| Gross margin (adjusted) | 46.0% | 48.4% |
| Key investor issue | Order conversion | Component costs |
The firms employ varying criteria for adjusted performance metrics.
Assessing valuation is more challenging. Nokia’s market capitalization stood around €45.1 billion at midday. Using its cash-conversion target of 55% to 75% on the profit-guidance midpoint of €2.35 billion gives an initial free-cash-flow yield between 2.9% and 3.9%.
The cash-flow assessment for 2026
| Preliminary calculation | Value |
|---|---|
| Comparable operating profit forecast | €2.1 billion–€2.6 billion |
| Midpoint of guidance range | €2.35 billion |
| Conversion target for free cash flow | 55%–75% |
| Example free cash flow at midpoint | €1.29 billion–€1.76 billion |
| Current market capitalization | About €45.09 billion |
| Example free-cash-flow yield | 2.9%–3.9% |
This calculation is for illustration purposes and does not represent Nokia guidance.
Risks remain focused on supply, component expenses, restructuring, and timing. Nokia anticipates restructuring-related cash outflows of €700 million to €800 million in 2026. Margins and projected cash yield could be reduced if order conversion slows.
Monday’s action sets up a straightforward test for investors. Demand is evident, but evidence of cash generation is lacking. A lasting revaluation now hinges on turning the €2.8 billion order intake into profitable revenue and free cash flow.
Related articles: HEX:NOKIA