
NEW YORK, August 3, 2026, 12:12 EDT — U.S. markets began trading.
- Nvidia rose 3.2%, and Broadcom bounced back after an initial 3.8% decline.
- Nvidia reported an 85% increase in revenue, while its free cash flow accounted for 59.5% of sales.
- Initial run-rate sales multiples indicate Nvidia holds an advantage compared with Broadcom and AMD.
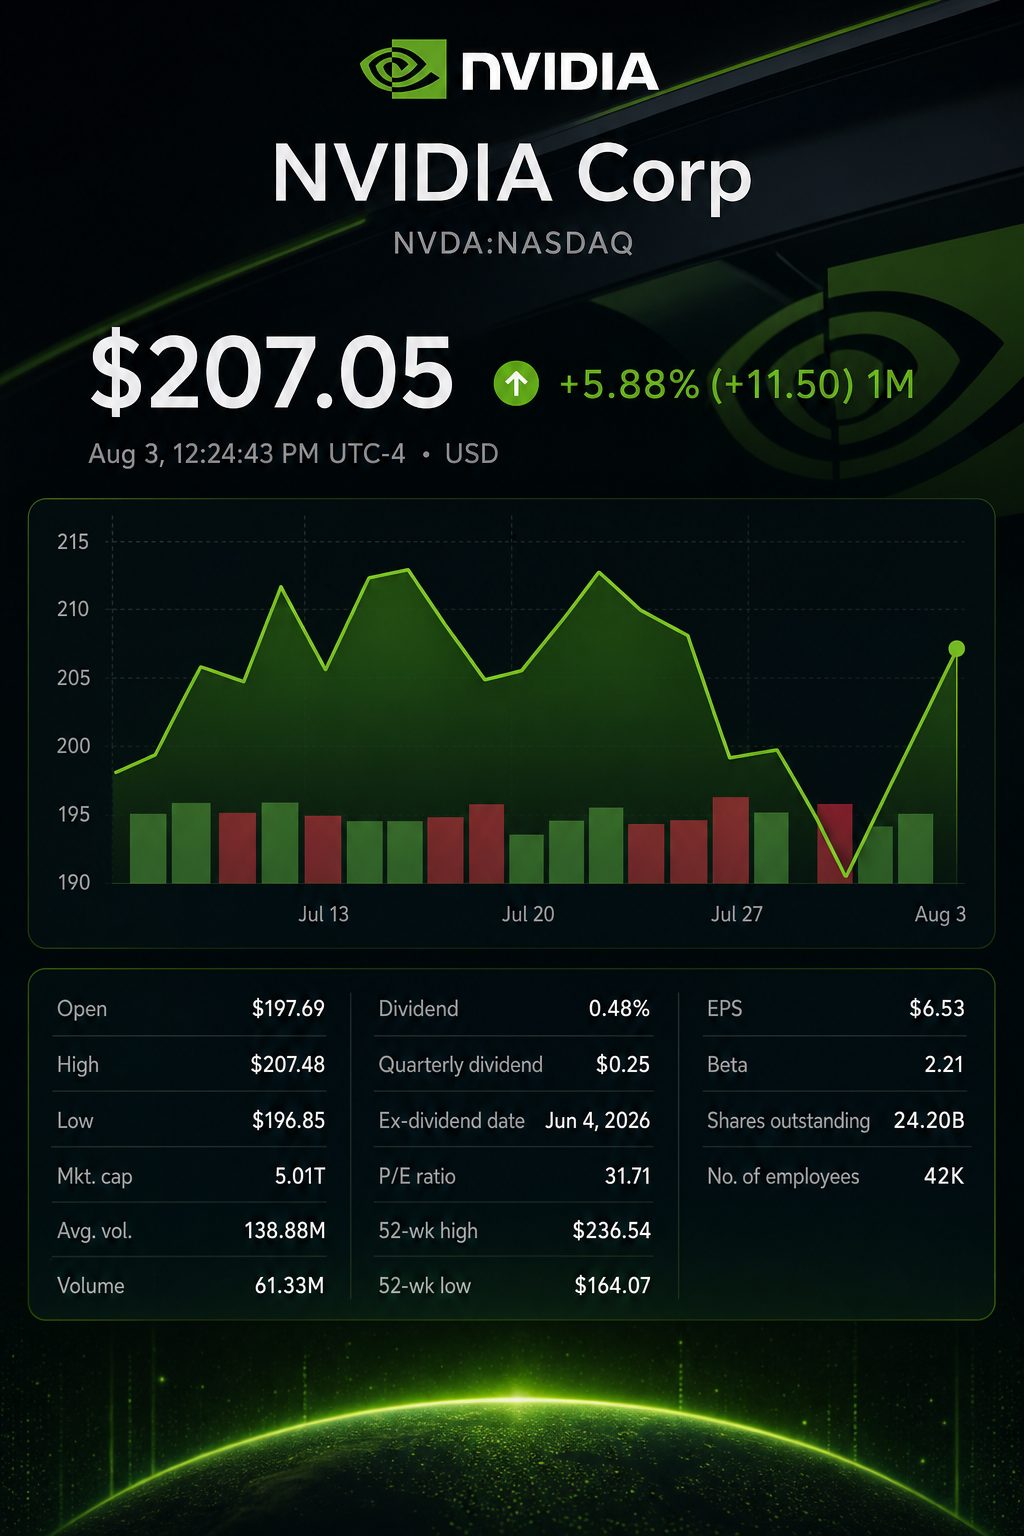
Broadcom NASDAQ:AVGO pared back most of an early decline on Monday after Goldman Sachs Group NYSE:GS took the chipmaker off its U.S. Conviction List. Broadcom was down 0.2% around midday. Nvidia NASDAQ:NVDA climbed 3.2%, and Advanced Micro Devices NASDAQ:AMD gained 0.8%.
Goldman Sachs referred to its August picks as “stocks for a broadening market.” The bank included Microsoft NASDAQ:MSFT among six new additions. Analyst Gabriela Borges noted that AI had moved into the initial stage of “how to make AI work in enterprises.” Investing.com
This change links the differing perspectives among investors. Some recent analysis maintains that Nvidia, Broadcom and Micron are still trading below their true value. Another view suggests that AMD’s advancements could actually expand Nvidia’s addressable market rather than reduce it. The performance metrics provide the strongest backing for the Nvidia case.
| Company | Price near 11:57 EDT | Monday move | Intraday low versus prior close | Market value |
|---|---|---|---|---|
| Nvidia | $207.15 | up 3.2% | down 1.8% | $4.86 trillion |
| Broadcom | $388.51 | down 0.2% | down 3.8% | $1.85 trillion |
| AMD | $480.00 | rising 0.8% | down 4.2% | $776 billion |
| Micron | $814.48 | off 1.0% | down 6.3% | $930 billion |
Figures were rounded and quotes shown with a delay. Market valuations are based on FactSet data from Monday.
Broadcom’s rebound is significant. Goldman made a modification to its list, maintaining a focus on broader market leadership as its key theme. This is not the same as issuing a new earnings alert. At the same time, leading U.S. indexes started the session up, although chip stocks remained under pressure.
Of the three accelerator designers, Nvidia shows the most robust growth-to-cash ratio, according to reports. Its revenue rose at a quicker pace than both Broadcom and AMD. Nvidia also led in cash conversion.
| Company | Latest reported revenue | Year-on-year growth | AI-linked revenue metric | Free-cash-flow margin |
|---|---|---|---|---|
| Nvidia | $81.6 billion | 85% | Data Center: $75.2 billion | 59.5% |
| Broadcom | $22.2 billion | 48% | AI semiconductors: $10.8 billion | 46.3% |
| AMD | $10.3 billion | 38% | Data Center: $5.8 billion | 25.0% |
| Micron Technology | $41.5 billion | 346% | Cloud and core data center: $25.3 billion | 44.1% |
Companies define AI-related categories in different ways. Free-cash-flow margins are based on each firm’s disclosed non-GAAP metric.
Nvidia reported quarterly free cash flow of $48.6 billion, amounting to 59.5% of its revenue. Data Center segment contributed 92% of overall sales. CEO Jensen Huang described AI-factory building as the “largest infrastructure expansion in human history.” NVIDIA Investor Relations
Broadcom continues to deliver strong growth, with AI chip revenue jumping 143%, surpassing guidance. Chief Executive Hock Tan commented, “the momentum continues.” The company forecasts this business will total $16 billion in the current quarter. PR Newswire
The valuation raises expectations. Broadcom is valued at around 64.7 times its trailing earnings, which is about double Nvidia’s 31.6 multiple. The comparison has limitations, as Broadcom’s GAAP earnings factor in acquisition-related amortization.
AMD offers a contrasting scenario. Data Center revenue increased by 57%, while the free-cash-flow conversion hit 25%. Chief Executive Lisa Su described Data Center as the company’s “primary driver” of growth. AMD will announce its second-quarter results after the market closes on Tuesday. Advanced Micro Devices, Inc.
AMD is trading at more than 157 times trailing earnings, making any slowdown in accelerator sales particularly expensive. The company’s earlier outlook projected $11.2 billion in revenue for the quarter, an increase of 46%.
Micron Technology NASDAQ:MU stands out on screens. The company’s revenue soared 346%, driven by higher memory prices and strong data-center demand. Shares are priced at less than 19 times trailing earnings. Shares dropped early Monday after news emerged that China’s CXMT could boost production capacity.
| Company | Trailing P/E | Preliminary run-rate sales multiple | Current company growth marker |
|---|---|---|---|
| Nvidia | 31.6x | 14.9x | Second quarter revenue outlook: $91.0 billion |
| Broadcom | 64.7x | 20.8x | Third quarter revenue forecast: $29.4 billion, increase of 84% |
| AMD | 157.1x | 18.9x | Second quarter revenue outlook: $11.2 billion, rise of 46% |
| Micron | 18.7x | 5.6x | Fourth quarter revenue outlook: $50.0 billion |
Initial run-rate multiples are calculated by taking Monday’s estimated market value and dividing it by four times the most recent quarterly revenue. These figures illustrate current values and are not projections.
The key indicator for investors is the preliminary multiple. Nvidia’s multiple based on run-rate sales is lower than that of Broadcom and AMD. However, Nvidia is delivering more rapid growth and superior cash conversion. While Micron offers a lower valuation, its profit is still closely linked to the memory cycle.
Goldman’s move to add Microsoft highlights that difference. The bank seems to be gauging the future direction of AI profit flows. Its portfolio adjustment does not suggest that demand for infrastructure has vanished. That conclusion is drawn from the bank’s own characterization of its expanded focus.
Risks continue to be significant. Nvidia’s latest guidance factors in no revenue from China data-center compute. Pricing for accelerators could come under strain if custom processors gain ground. Reduced hyperscaler investments would impact all three chipmakers. Further increases in memory supply might put pressure on Micron’s margins.
AMD will report next on Tuesday, with Nvidia scheduled for August 26. Broadcom’s forecast of $29.4 billion is another key reference point. If AMD posts robust results and Nvidia’s outlook remains firm, it would back the case for continued market growth. However, a shortfall in AMD’s margins would reinforce Nvidia’s present valuation lead.
Related articles: NASDAQ:NVDA





![Australia Stock Market Today 24/08/2026 [UPDATE: 10:38 AEST] [Miners Lift ASX as Banks Blunt Opening Gain]](https://ts2.tech/wp-content/uploads/2026/08/AU-market-dashboard-2026-08-24-1038-480x384.jpg "Australia Stock Market Today 24/08/2026 [UPDATE: 10:38 AEST] [Miners Lift ASX as Banks Blunt Opening Gain]")

![Asia Stock Market Today 24/08/2026 [UPDATE: 09:01 SGT] [Samsung Slides as SK hynix Splits Seoul Chip Trade]](https://ts2.tech/wp-content/uploads/2026/08/Asia-market-dashboard-2026-08-24-0859-480x384.jpg "Asia Stock Market Today 24/08/2026 [UPDATE: 09:01 SGT] [Samsung Slides as SK hynix Splits Seoul Chip Trade]")