
Robinhood (NASDAQ:HOOD) Q2 Results Signal Prediction Markets Surpass Crypto

Robinhood (NASDAQ:HOOD) Q2 Results Signal Prediction Markets Surpass Crypto

NEW YORK, July 30, 2026, 05:08 EDT — U.S. premarket

  • Revenue increased by 32%, reaching $1.31 billion. Adjusted earnings came in at 48 cents, surpassing the 44-cent consensus from LSEG.
  • Event-contract revenue totaled $156 million, coming in higher than equities revenue at $129 million and crypto revenue at $100 million.
  • Robinhood shares ended down 3.2% at $89.84, retreating a further 1% in after-hours trade.

Shares of Robinhood Markets declined after the company reported results that exceeded second-quarter earnings expectations. U.S. regular trading had not yet begun at time of publication.
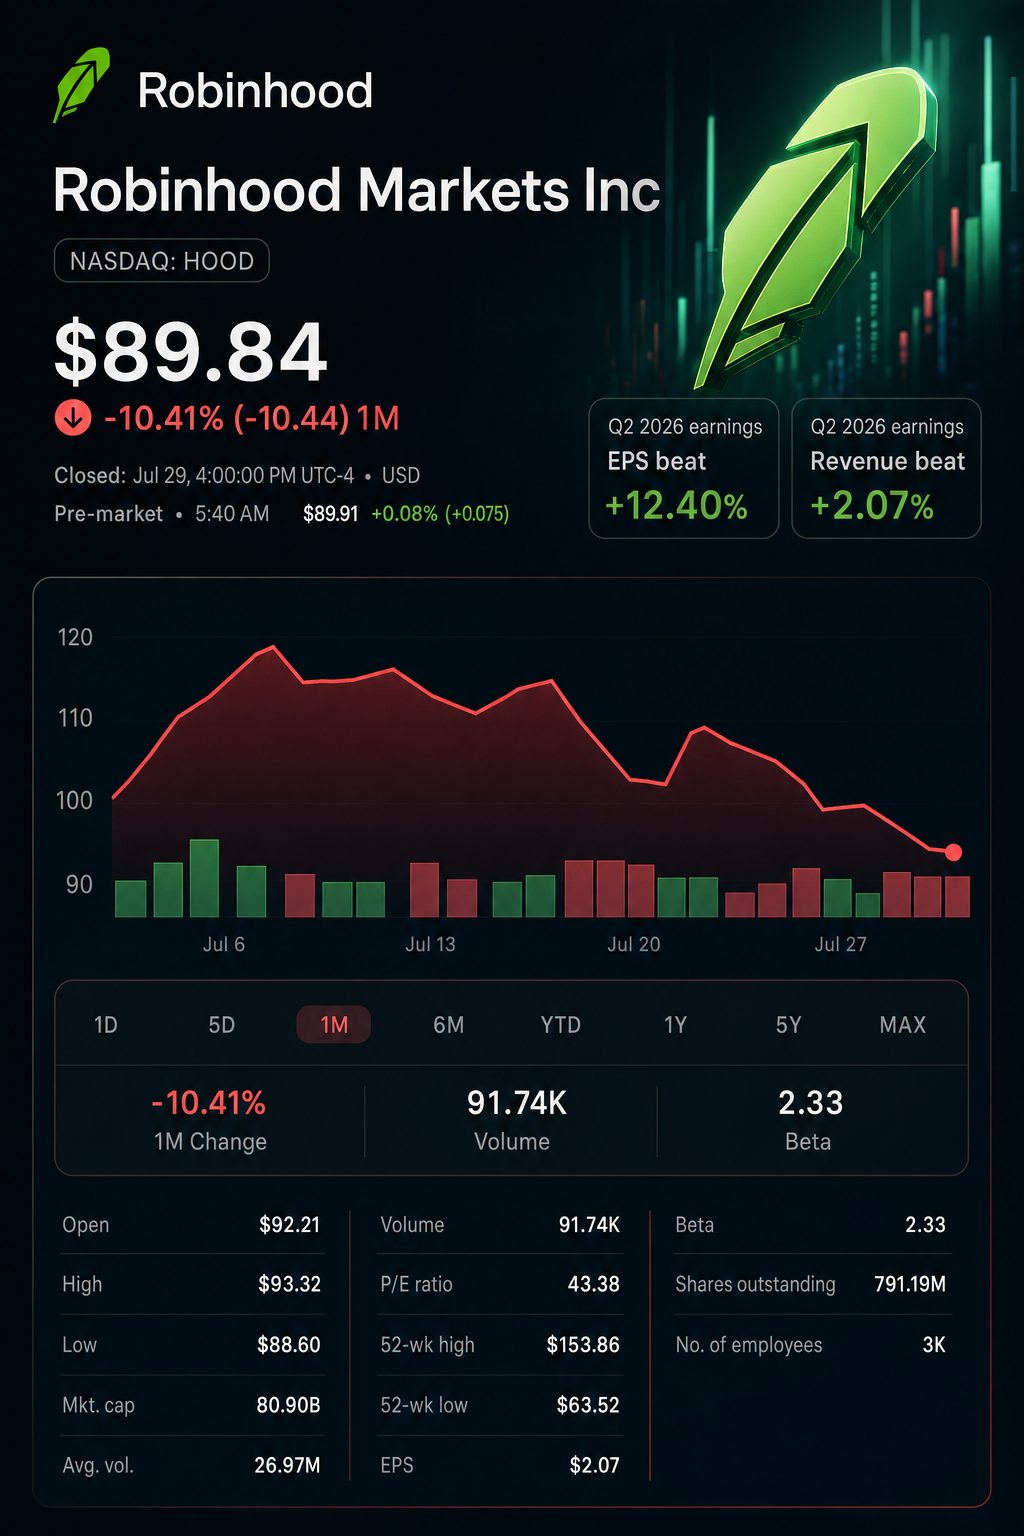
The most notable investor takeaway this quarter came from the revenue breakdown. Event contracts, which are prediction-market offerings linked to real-world events, produced higher revenue than either cryptocurrencies or equities. This remained true even excluding the contribution from Rothera, the latest exchange launch.

The firm disclosed the breakdown of its transaction-driven revenue. Percentages derive from internal data.

Q2 transaction businessRevenueYear-on-year changeRevenue share
Options$342 millionup 29%44.1%
Event contracts$156 millionover 10 times higher20.1%
Equities$129 millionup 95%16.6%
Cryptocurrency$100 milliondown 38%12.9%
Other transactions$49 millionup 29%6.3%
Total$776 millionup 44%100%

Robinhood’s top trading segment continued to be options. However, event contracts accounted for 20% of transaction revenue, compared to 16.7% in the previous quarter. Meanwhile, crypto’s portion dropped to 12.9%, down from 21.5%.

Stock chart for NASDAQ:HOOD

Growth in the prediction-market segment appears driven by higher volumes. Robinhood’s event hub handled 13.6 billion contracts, marking a 55% increase from the previous period. Revenue from core events, not including Rothera’s $17 million, climbed approximately 34% to $139 million.

Prediction-market measureContractsRevenueEstimated revenue per contract
Q1 2026 Robinhood event hub8.8 billion$104 million1.18 cents
Q2 2026 hub, minus Rothera revenue13.6 billion$139 million1.02 cents
Q2 2026 Rothera2.1 billion$17 million0.81 cents

These are initial estimates and do not represent company-reported performance indicators. Rothera applies a separate method for counting contracts, which makes straightforward comparison less dependable.

The basic yield estimate declined by around 14% compared to the first quarter, indicating weaker unit economics. This also indicates that the revenue increase was largely driven by increased customer activity.

Chief Financial Officer Shiv Verma said the company was “firing on all cylinders,” pointing to record activity in equity, options, and event-contract volumes. Third Bridge analyst Jacob Zuller called prediction markets potentially the most significant growth catalyst for Robinhood. Robinhood Markets, Inc.

The company’s top-line financial performance saw significant gains. All dollar figures listed are in millions, unless stated otherwise for per-share data.

MetricQ2 2025Q1 2026Q2 2026Year-on-year
Total net revenue$989$1,067$1,308up 32%
Transaction revenue$539$623$776up 44%
Net income$386$346$573up 48%
Diluted EPS$0.42$0.38$0.62up 48%
Operating expenses$550$656$734up 33%
Adjusted EBITDA$549$534$741up 35%

One adjustment must be made to the reported profit figure. Net income reflected a $129 million gain linked to the deconsolidation of Robinhood Ventures Fund I, accounting for roughly 23% of stated profit and boosting diluted EPS by 14 cents.

Adjusted earnings reached 48 cents per share, surpassing the LSEG estimate of 44 cents. This core result topped expectations even without the benefit from the fund gain.

Operating expenses increased by 33%, closely tracking the 32% rise in revenue. However, adjusted EBITDA margin improved to 57% compared to 56%.

Management revised down its forecast for adjusted operating expenses and stock-based compensation, now estimating a range of $2.675 billion to $2.775 billion, compared to the previous projection of $2.7 billion to $2.825 billion. This guidance reflects expected expenditures for Rothera and WonderFi.

Customer and asset metrics served as a more stable offset to fluctuations in trading.

Operating measureQ2 2026Change or context
Funded customers28.4 millionUp 7% year-on-year
Total platform assets$369 billionIncrease of 32%
Quarterly net deposits$21.7 billionHit a record; annualized growth at 28%
Gold subscribers4.8 millionGrowth of 39%
Annualized revenue per user$187Rose 24%

Gold adoption climbed to 17% among funded users. Approximately 40% of new funded users signed up during the quarter. These subscriptions generate more stable revenue compared to trading commissions.

Coinbase Global will release its results after markets close on Thursday, offering insight into whether Robinhood’s crypto downturn signals a broader industry trend. Coinbase shares dropped 4.7% to $160.09 on Wednesday.

Robinhood’s valuation is still considered high. The company closed Wednesday trading at roughly 43.5 times its trailing earnings, with a market capitalization of $81 billion. “If there’s one concern, it’s valuation,” Zacks strategist David Bartosiak said. The Wall Street Journal

Risks: Prediction markets continue to face potential regulatory hurdles at both federal and state levels. Robinhood confronts increased credit provisions, elevated operating expenses, and subdued crypto trading. The company cautions that changes in regulations ahead may limit or prohibit event contracts.

Investors are now looking for continued contract growth and consistent revenue per contract. Thursday’s trading will reveal whether this focus surpasses the impact of the single profit boost.

TS2 TECH • EXTENDED COVERAGE

Further analysis

What is the latest trading position of the cryptocurrency market?

Bitcoin hovered around $64,200 on July 30, fluctuating between $63,200 and $64,600 during the session. Ether was trading close to $1,900, while Solana and XRP were seen at about $73.60 and $1.07, respectively. Binance Overall cryptocurrency market capitalisation held steady near $2.19 trillion in the past 24 hours. Reported daily trading volume stood at $63.6 billion, with Bitcoin commanding 58.75% market dominance. Price levels can vary between platforms as cryptocurrencies trade round the clock on multiple exchanges. CoinMarketCap

How much have leading cryptocurrencies fallen from their all-time peaks?

Bitcoin, based on Binance’s reported all-time high, is currently trading about 49% below $126,198. Ether stands around 62% under its recorded peak of approximately $4,954. Solana is trading roughly 75% beneath $294, and XRP is 72% down from $3.84. Binance Record highs may vary slightly among different platforms and data providers. All leading cryptocurrencies are at least 49% below their highest recorded levels.

What caused the Federal Reserve decision to trigger only limited movement in crypto?

The Federal Reserve left its target rate at 3.50%-3.75% on July 29, with a 9-3 vote; three members favored a 0.25-point hike. Inflation continues to exceed the Fed’s 2% target. Federal Reserve Bitcoin and Ether briefly rose around 1% before settling back to prior levels. Reuters Traders maintained caution, and no decisive breakout occurred.

Are spot Bitcoin ETF inflows providing support to the market?

U.S. spot Bitcoin ETFs posted net inflows of $32.1 million on July 29. BlackRock’s IBIT added $89.8 million, but Fidelity’s FBTC had a $43.1 million outflow. ARKB saw outflows totaling $14.6 million the same day. Overall, the period from July 27-29 saw a net outflow of $29.2 million. Since inception, cumulative net inflows stand at approximately $51.41 billion. Some support is present, but daily institutional flows remain uneven. Farside Investors

Is trading activity in cryptocurrency robust, or is it perilously low?

According to K33, average daily Bitcoin spot trading volume in July was just $2.2 billion, the lowest monthly level since November 2023. CME open interest hovered around 100,025 BTC leading up to the July expiry. K33 Data from CoinGlass indicated total Bitcoin open interest at about $47.9 billion. Daily futures volumes reached $62.7 billion, compared with $4.0 billion for spot. Differences in metrics and trading venues make direct comparisons difficult. Low liquidity in the spot market can still intensify liquidations triggered by derivatives activity. coinglass

Is an altcoin season beginning at this time?

Bitcoin accounts for 58.75% of the total reported global cryptocurrency market capitalization. Ether’s market cap is around $231 billion, compared to Bitcoin’s $1.29 trillion. Solana and XRP continue to trail significantly, with market values of about $43 billion and $67 billion, respectively. CoinMarketCap This level of concentration does not indicate a widespread and sustained altcoin rally. While certain coins may experience gains, overall market participation remains limited.

What are the key Bitcoin price levels to watch today?

Bitcoin is currently trading within a range of about $63,200 to $64,600 in the latest session. Binance According to K33, July’s broader consolidation band stretches from $60,000 to $66,000. K33 Closing above $66,000 would break this ceiling, opening a path to $70,000, or roughly 9.1% higher than the latest price. If support at $60,000 fails, $58,000 could become the next focus. These levels represent scenarios, not assured targets.

What is the Bitcoin outlook over the next one to four weeks?

Bitcoin is expected to hold steady between $60,000 and $66,000. Subdued spot trading activity and uneven ETF inflows keep the outlook cautious. K33 A strong, uninterrupted streak of ETF inflows may lift Bitcoin above $66,000. Conversely, higher yields, rising energy prices, or forced selling could drive the price back to $60,000. Federal Reserve With Bitcoin at $64,170, the stated range offers a 2.9% potential rise versus a 6.5% possible decline. This ratio does not favor new unhedged range trades at present. Confidence in forecasts remains limited as thin markets are prone to sharp moves on news.

Is U.S. oversight turning into a driver for trading activity?

The SEC’s March guidance outlined multiple crypto-asset types and clarified rules for staking, mining, airdrops, and wrapped tokens. SEC Its July policy roadmap prioritizes domestic offerings, improved asset custody, and tokenized securities trading. SEC Comprehensive market structure legislation is still pending. MarketWatch reported 51% odds of Senate action before the August break. Some analysts put the likelihood of final passage below 30%, reflecting ongoing uncertainty. MarketWatch

What could quickly undermine the bullish outlook?

A daily close under $60,000 would push Bitcoin outside July’s defined trading range. Continued ETF outflows would eliminate a key driver of marginal demand. K33 Higher inflation could prompt U.S. rates to remain restrictive for an extended period. Federal Reserve Total Bitcoin open interest stands near $48 billion, heightening the risk of liquidations. coinglass BitMEX is set to shut down September 23, though its market share was less than 0.01%. While the closure appears limited, exchange counterparty risk persists. Reuters

Mateusz Kaczmarek is a financial and technology journalist at TS2.tech, covering stocks, artificial intelligence, semiconductors and global market developments. A graduate of the Poznań University of Economics and Business, he previously worked in financial analysis before moving into business journalism. His reporting focuses on technology companies, market trends and the forces shaping global investment markets. Follow Mateusz Kaczmarek on Google News.

U.S. Premarket Opens; Normal Trading Set for 09:30 EDT as Second-Home Mortgages Climb 4.1% with Wealthier Buyers Returning, Though Activity Stays 65% Under Record High
Previous Story

U.S. Premarket Opens; Normal Trading Set for 09:30 EDT as Second-Home Mortgages Climb 4.1% with Wealthier Buyers Returning, Though Activity Stays 65% Under Record High

Uniper Canada LNG Agreement Reduces Ksi Lisims FID Shortfall to 1–2 Mtpa
Next Story

Uniper Canada LNG Agreement Reduces Ksi Lisims FID Shortfall to 1–2 Mtpa