
NEW YORK, July 29, 2026, 12:00 p.m. EDT — Stocks opened for trading in the United States.
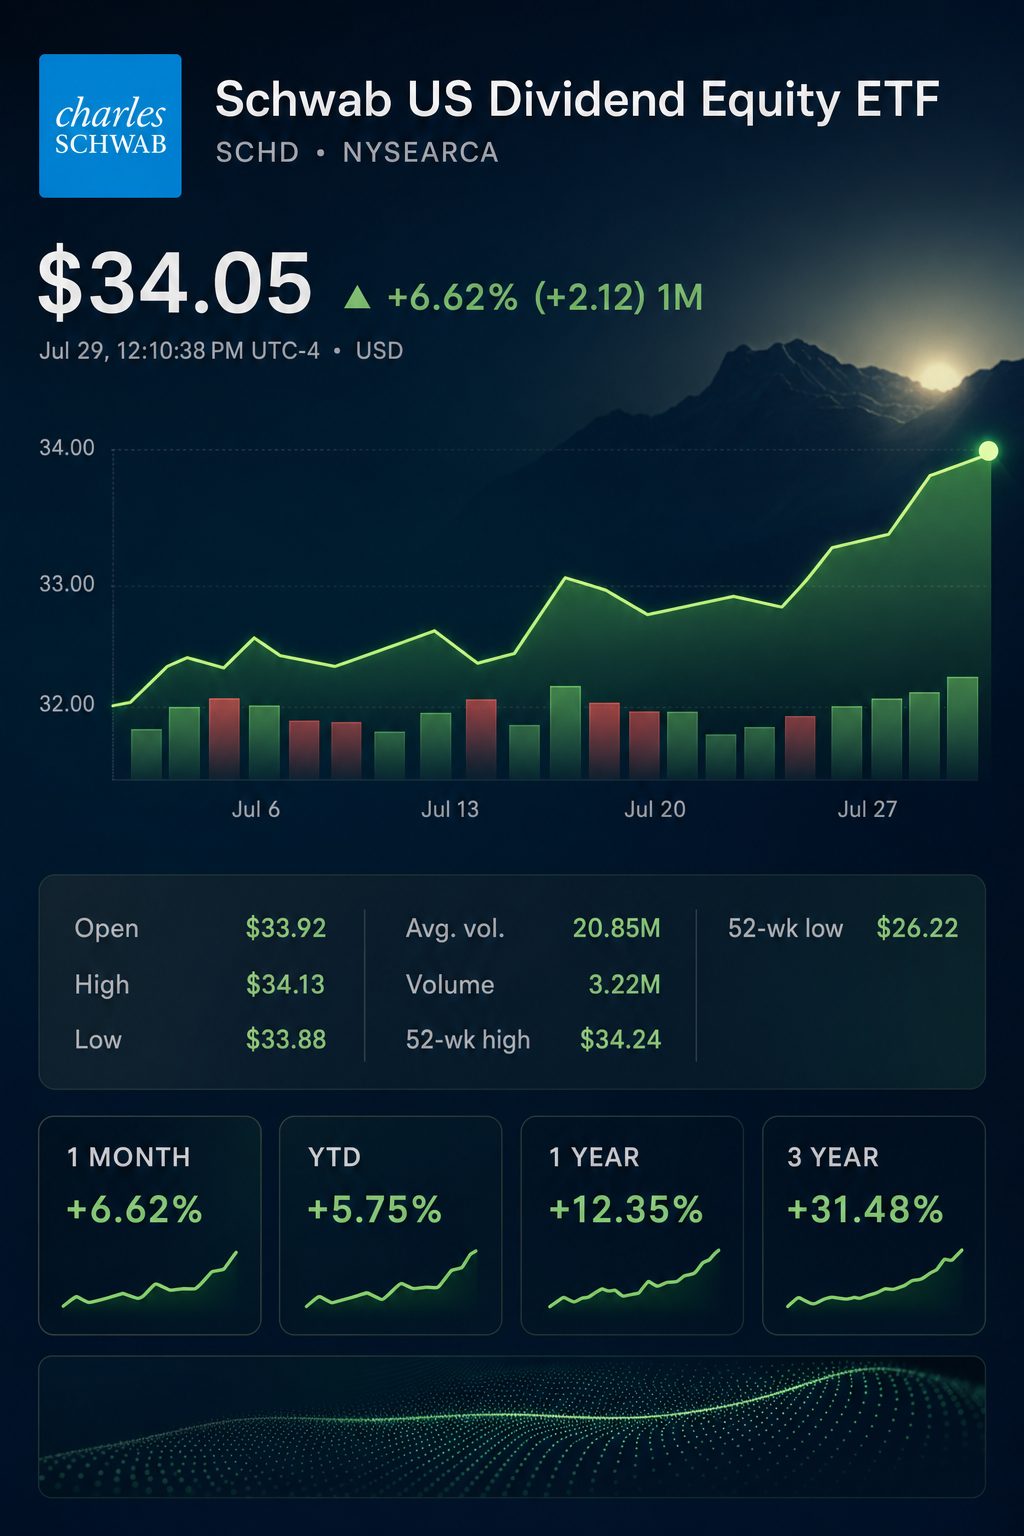
At midday Wednesday, Schwab U.S. Dividend Equity ETF NYSEARCA:SCHD was up 0.6% to $34.09, while SPDR S&P 500 ETF Trust NYSEARCA:SPY slipped 0.9% to $734.03. These figures are subject to change.
The gap widens with a marked turnaround projected for 2026. SCHD showed a 17.50% return as of June 30, outpacing SPY, which delivered 10.02%. The difference stands at 7.48 points.
Dividend yield is not the only key factor. Health care, consumer staples and energy account for 55.17% of SCHD’s allocation, compared to just 17.53% for SPY.
Technology accounts for 9.23% of SCHD, compared to 36.32% of SPY. This 27 percentage point underweight significantly affects the fund during periods when growth stocks fall.
| Metric | SCHD | SPY |
|---|---|---|
| 2026 total return as of June 30 | 17.50% | 10.02% |
| 30-day SEC yield | 3.27% | 0.97% |
| Published price-to-earnings ratio | 18.41 | 25.94 |
| Top 10 stocks | 41.77% | 36.79% |
| Weight in health care, staples, energy | 55.17% | 17.53% |
| Weight in information technology | 9.23% | 36.32% |
Performance figures reflect the reinvestment of distributions. Yield, valuation, and portfolio dates may differ somewhat depending on the issuer.
SCHD offers a yield that is 2.30 points higher. Its stated earnings multiple is roughly 29% less as well. Nonetheless, the fund remains less than 0.5% from its 52-week peak.
A Seeking Alpha analysis on Tuesday delivered a comparable mixed assessment, noting SCHD trades at a 30% price-to-earnings discount compared with the Schwab U.S. Broad Market ETF (NYSEARCA:SCHB). The analyst, however, chose not to increase holdings at present prices.
Despite having 103 stocks, SCHD’s portfolio is less diversified in practice. Its ten biggest holdings represent 41.77% of total assets. In comparison, the ten largest stocks in SPY comprise 36.79% of its assets.
Healthcare stocks make up 17.79% of SCHD, with four companies holding that share. Combined, healthcare and consumer staples account for more than 41% of the portfolio. As a result, the fund is focused on quality and value, rather than just being a collection of high-yield holdings.
The index’s yearly reset resulted in that level of concentration. By June 30, portfolio turnover stood at 42.28%. After the next reconstitution, today’s leading positions may change.
The benchmark factors in more than just yield. It takes into account dividend track record, cash flow, debt levels, return on equity and payout increases. These criteria are highlighted in Tuesday’s Motley Fool analysis as backing the argument for long-term durability.
Tony Dong, lead ETF analyst at ETF Central, explained the limitation. “The same value and sector tilts driving today’s outperformance can just as easily become headwinds.” 24/7 Wall St.
Wednesday’s resilience was not mirrored by other dividend funds. Vanguard Dividend Appreciation ETF NYSEARCA:VIG declined 0.6%, while iShares Core Dividend Growth ETF NYSEARCA:DGRO dropped 0.3%.
The extended track record paints a less favorable picture. SCHD posted a 10-year annualized return of 12.37% through June, while SPY returned 15.34% for the same span.
Risks: If technology stocks rally again, SPY could benefit more due to its larger weighting in growth sectors. A downturn in energy or healthcare would impact SCHD more significantly. SCHD’s concentrated holdings may intensify gains or losses.
SCHD has become largely a sector-specific investment for those seeking yield. The dividend payout stays above average, while the valuation is still below peers. However, with shares trading close to a 52-week peak, there is reduced room for error.
Related articles: ETFs




Further analysis
Where is SCHD trading today, and is it outperforming the market?
As of 11:48 a.m. ET on July 29, SCHD traded at $34.10, up 0.6%. Its intraday range was $33.88 to $34.13 on 13.7 million shares. SPY fell 0.9%, QQQ dropped 1.3%, and DIA lost 1.6%. That left SCHD ahead of SPY by roughly 1.5 percentage points. The quote remains intraday, not a closing price.
Why is SCHD holding up while broad indexes fall?
Energy and defensive holdings are doing much of today’s work. Chevron rose 2.5%, ConocoPhillips 3.5%, Coca-Cola 2.2%, and Abbott 2.4%. Energy represents 14.1% of SCHD, while healthcare and staples each exceed 20%. Oil prices jumped about 7% as Middle East fighting intensified. That portfolio mix helped offset losses elsewhere.
Is SCHD expensive near its 52-week high?
At the latest quote, SCHD sits only 0.4% below its $34.24 high. The portfolio’s price-to-earnings ratio was 18.41 on June 30. Return on equity was 26.95%, reflecting profitable underlying companies. Those figures suggest quality, but not a distressed valuation. Further upside becomes easier if Treasury yields retreat or earnings improve.
How attractive is SCHD’s dividend yield versus Treasuries?
Schwab reports a 3.27% SEC yield and 3.30% trailing distribution yield. The 10-year Treasury yielded about 4.63% today. On headline yield, SCHD trails by roughly 1.36 percentage points. That gap is a near-term valuation headwind. The comparison is imperfect because SCHD carries equity risk and variable dividends.
Is SCHD’s dividend still growing in 2026?
The signal is mixed. The latest payments were $0.2569 in March and $0.2525 in June. First-half distributions totaled $0.5094, compared with $0.5090 during 2025’s first half. That produces year-over-year growth of only 0.08%. June’s payment also fell roughly 3.0% from June 2025. Full-year growth remains uncertain because two quarterly payments remain unknown.
How concentrated is SCHD’s portfolio?
Schwab lists 103 holdings, but the largest ten represent about 41.8% of assets. Abbott leads at 4.68%, followed by Amgen, Merck, and UnitedHealth. Healthcare and consumer staples together account for 41.1% of the portfolio. Energy adds 14.1%, while information technology holds only 9.2%. That structure reduces mega-cap technology exposure but increases sector concentration.
Has SCHD’s recent performance justified investor enthusiasm?
Through June 30, SCHD returned 17.50% in 2026 and 24.03% over one year. Its large-value category returned 11.30% and 21.21%, respectively. SCHD therefore led by 6.2 percentage points year to date. The five-year annualized return was 8.51%, below the category’s 10.48%. Recent strength is real, but longer-term relative performance looks less dominant.
What is SCHD’s price forecast after today’s Fed decision?
Before Wednesday’s decision, markets assigned roughly 71% odds to a Fed hold. A hold with softer yields could retest $34.24, then approach $34.50. A surprise hike could push SCHD toward $33.40 to $33.80. A reasonable base case through Friday, July 31, is $33.70 to $34.60. Oil, yields, and policy dissents create unusually wide uncertainty. These ranges are scenario estimates, not verified consensus targets.
Is SCHD still cheap and liquid enough for long-term investors?
Schwab reported $104.75 billion in assets and a 0.06% expense ratio. The 30-day median bid-ask spread was only 0.03%. Today’s trading volume exceeded 13 million shares before midday. Those figures support low trading friction for ordinary-sized orders. Still, SCHD is a concentrated large-value strategy, not a total-market substitute. Investors seeking technology-led growth may require broader exposure elsewhere.