
NEW YORK, July 31, 2026, 12:05 p.m. EDT — U.S. markets open
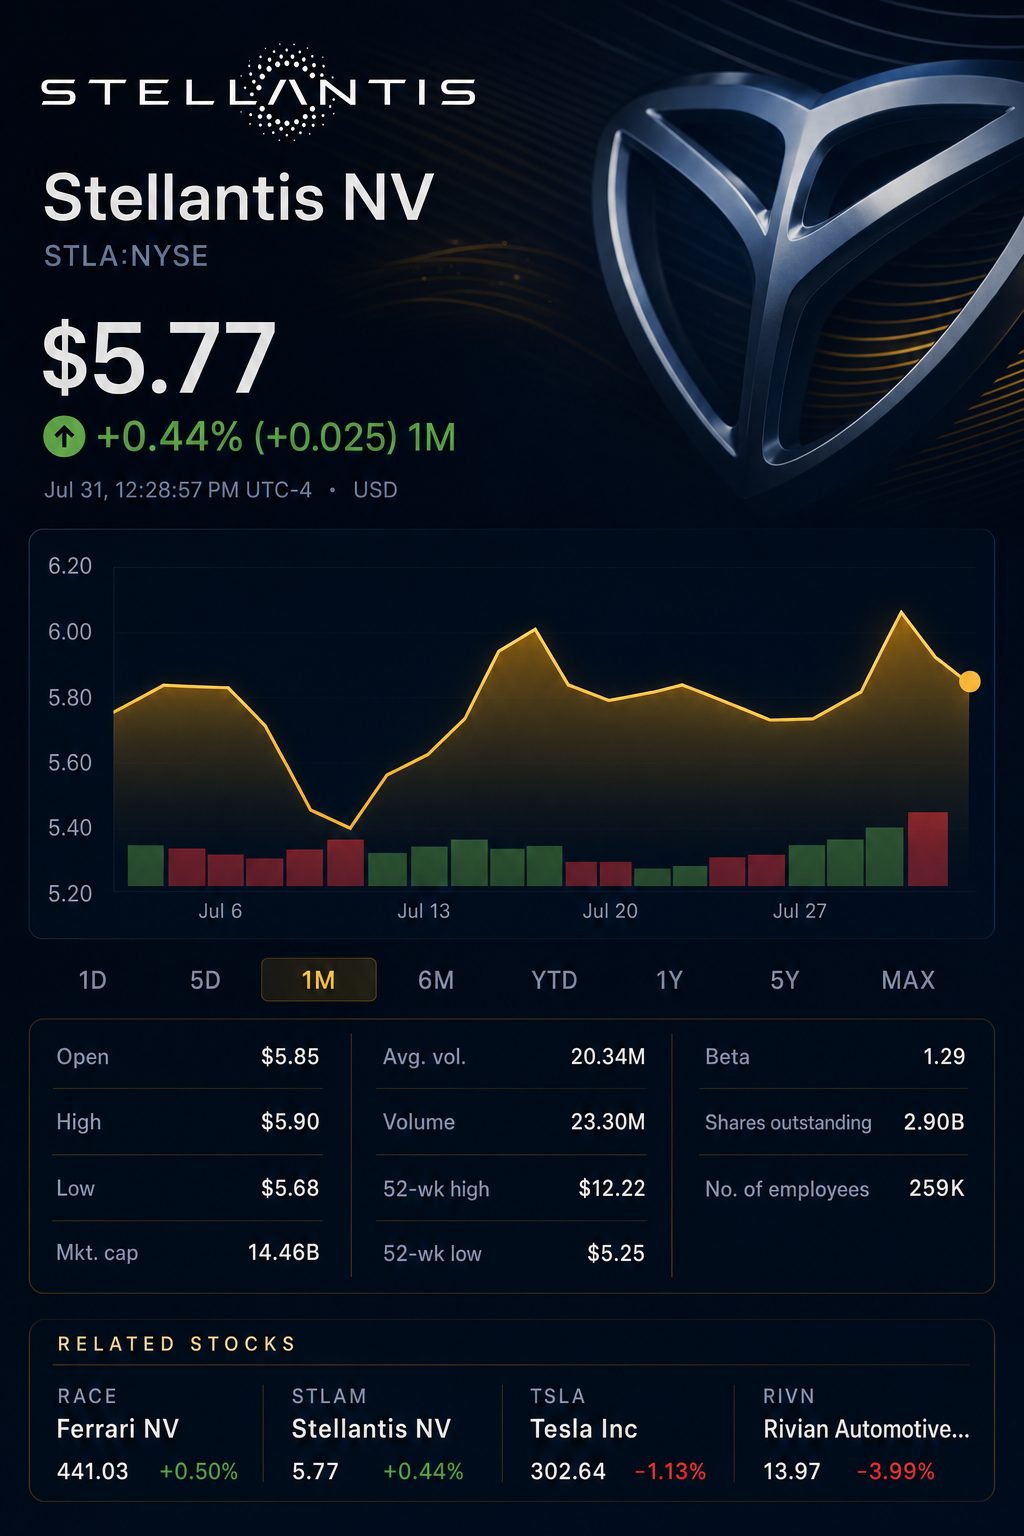
- The stock fell 1.8% to $5.76 as of 11:50 a.m. EDT.
- Adjusted operating income totaled €773 million, falling 15% short of the Reuters survey forecast.
- North America and Europe accounted for 79.6% of revenue while contributing 24.6% of group AOI.
Stellantis stock dropped 1.8% by late Friday morning as second-quarter earnings came in below expectations. The combined adjusted margin for North America and Europe was 0.5%, seen as the key metric.
The two markets brought in €34.6 billion in revenue, but adjusted operating income reached just €190 million. In comparison, South America and the Middle East & Africa delivered €731 million in adjusted operating income from €6.9 billion of revenue.
The shift in profit sources makes the turnaround reliant on smaller markets. U.S. volume is rebounding, but earnings are not following suit.
Q2 results, preliminary Stellantis.com
| Metric | Q2 2026 | Q2 2025 | Change |
|---|---|---|---|
| Net revenue | €43.482 billion | €38.448 billion | Up 13% |
| Combined shipments | 1.603 million | 1.457 million | Higher by 10% |
| Adjusted operating income | €773 million | €213 million | Increase of 263% |
| AOI margin | 1.8% | 0.6% | 1.2 points rise |
| Net profit/(loss) | €293 million | -€1.869 billion | €2.162 billion improvement |
| Industrial free cash flow | €1.000 billion | €31 million | Up €969 million |
Analysts surveyed by Reuters had forecast adjusted operating income at €914 million. Stellantis underperformed that estimate by 15.4%. Shares in Milan finished down 4.3% following Thursday’s announcement.
The revenue per combined shipment increased by 2.8% to approximately €27,125. AOI per shipment advanced to nearly €482, up from €146. The comparison period had a low base.
Chief Executive Antonio Filosa said, “We need time… these are not challenges that you address overnight.” Leadership is focusing on market coverage, production costs and vehicle quality. Reuters
Regional earnings breakdown, based on company figures
| Operations | Revenue | Share of group revenue | AOI | Share of group AOI | Implied margin |
|---|---|---|---|---|---|
| North America and Europe | €34.619 billion | 79.6% | €190 million | 24.6% | 0.5% |
| South America and Middle East & Africa | €6.903 billion | 15.9% | €731 million | 94.6% | 10.6% |
| Asia Pacific and other activities | €2.081 billion | 4.8% | €106 million | 13.7% | 5.1% |
| Corporate costs and eliminations | -€121 million | -0.3% | -€254 million | -32.9% | n.m. |
| Stellantis | €43.482 billion | 100.0% | €773 million | 100.0% | 1.8% |
AOI from South America and Middle East & Africa was 2.6 times higher than in North America. Europe reported a loss of €94 million. North America made €284 million in AOI, despite its significantly greater revenue base.
Shipments in North America surged 38%, with regional revenue up 32%. Nevertheless, the AOI margin came in at just 1.6%. Overall inventory rose by 20% to reach 1.444 million vehicles.
Stellantis attributed the production to upcoming releases and scheduled summer closures. Initial July sales figures indicated inventory below June levels. Confirmation of this outlook is now needed.
Fabio Caldato, a fund manager at AcomeA Sgr, described the outcome as “a bit more debatable.” He noted that dealer inventory buildup had bolstered revenue in North America. Reuters
Rival figures illustrate the extent of the disparity. General Motors NYSE:GM reported a group margin of 8.2%, with North America at 8.6%. Ford NYSE:F posted a group margin of 5.2%.
Comparison of adjusted margins
| Company | Q2 revenue growth | Group adjusted EBIT/AOI margin | North America margin |
|---|---|---|---|
| Stellantis | +13.0% | 1.8% | 1.6% |
| General Motors | +1.9% | 8.2% | 8.6% |
| Ford | -4.0% | 5.2% | Figure not reported separately |
Non-GAAP interpretations vary between the three firms. Nonetheless, Stellantis lagged GM by seven percentage points in North America. Ford, meanwhile, turned softer revenue into a stronger overall margin.
Stellantis Q2 adjusted operating profit breakdown
| Year-on-year driver | Estimated AOI effect |
|---|---|
| Lower industrial costs | Over +€1.9 billion |
| Changes in volume and product mix | +€376 million |
| Net effect from pricing | -€456 million |
| Costs for sales and administration | -€370 million |
| Currency and miscellaneous impacts | -€861 million |
| Total AOI improvement | +€560 million |
The benefit from industrial costs was roughly 2.5 times overall quarterly AOI. Gains were seen in purchasing and manufacturing. Still, the number also reflected non-recurring comparisons related to recall and regulatory costs.
Stellantis maintained its 2026 forecast, projecting mid-single-digit revenue growth. The company still sees a low-single-digit AOI margin and anticipates improved industrial free cash flow. Positive industrial free cash flow is not expected until 2027.
Tariff expenses are projected between €1.0 billion and €1.2 billion. The summer closure along with higher raw material costs are set to impact third-quarter performance. Management anticipates that the majority of the second-half earnings will be realized in the fourth quarter.
Risks: Dealers might require increased incentives to reduce inventory. Europe continues to post losses. Tariffs and raw material expenses may offset ongoing savings. A plan focused on the fourth quarter allows minimal margin for setbacks.
July inventory figures are up next, followed by North American margin results. Unless there are gains on both fronts, the majority of operating profit will continue to be generated outside Stellantis’s main markets.
Related articles: NYSE:STLA