PayPal (NASDAQ:PYPL) Lifts 2026 Guidance; Share Buybacks Offset 11% Fall in Adjusted Profit
28 July 2026
2 mins read

PayPal (NASDAQ:PYPL) Lifts 2026 Guidance; Share Buybacks Offset 11% Fall in Adjusted Profit

NEW YORK, July 28, 2026, 07:58 EDT — U.S. premarket trading.

  • Adjusted EPS stood at $1.38, surpassing the consensus estimate of $1.28 by 7.8%.
  • Payment volume climbed by 10%, while transaction margin dollars edged up by just 1%.
  • The number of diluted shares dropped 9.7%, partly offsetting an adjusted net-income decrease of 11%.

PayPal shares were set to open 0.3% down at $56.07 on Tuesday. The company posted an earnings beat, but core profit drivers were more mixed.

Adjusted net income declined to $1.22 billion compared with $1.37 billion. Weighted-average diluted shares decreased to 882 million from 977 million, which restricted the drop in adjusted EPS to 1%.
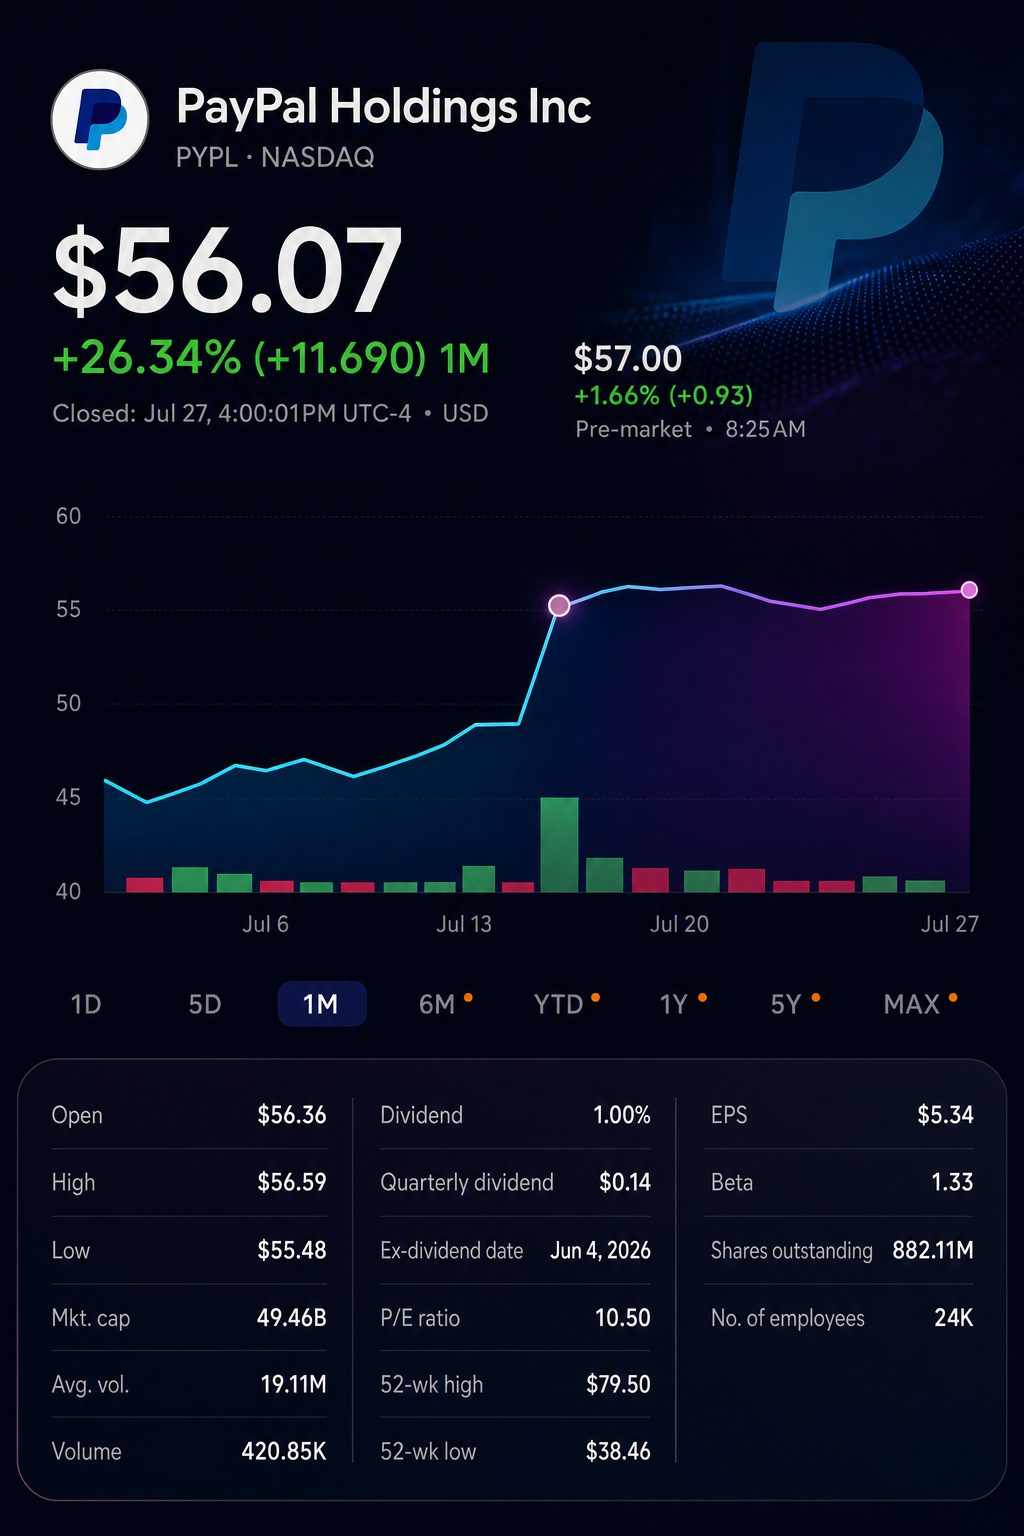
Stock chart for NASDAQ:PYPL

The company bought back approximately 33 million shares, spending $1.5 billion in the quarter. These rounded totals indicate an average repurchase price of about $45 per share. PayPal has repurchased close to 111 million shares over the past 12 months.

Those subsequent buybacks amounted to $6 billion, representing about 12% of PayPal’s existing market capitalization. The denominator is still a significant driver for earnings.

PayPal’s disclosed numbers highlight the growing gap between payment volume and profitability:

MetricQ2 2026Q2 2025Change
Revenue$8.682 billion$8.288 billion+5%
Total payment volume$486.448 billion$443.547 billion+10%
Transaction margin dollars$3.900 billion$3.844 billion+1%
Adjusted operating margin17.4%19.8%-248 basis points
Adjusted net income$1.219 billion$1.370 billion-11%
Adjusted diluted shares882 million977 million-9.7%
Adjusted EPS$1.38$1.40-1%

Based on figures provided by the company.

A straightforward look at yield highlights the difference. PayPal produced around $0.80 in transaction margin for every $100 handled, compared with approximately $0.87 during the same period last year.

Nonetheless, the main numbers beat projections. Revenue came in at $8.68 billion, surpassing the expected $8.47 billion. Adjusted EPS was ten cents higher than consensus.

PayPal increased its forecast for full-year adjusted EPS to approximately $5.38, signaling an estimated 1% rise from 2025. The company now projects annual transaction margin dollars at around $15.6 billion.

Chief Executive Enrique Lores said, “Our transformation is well underway.” PayPal aims to achieve $400 million in savings by the end of the year. The broader initiative plans total savings of $1.5 billion over a period of two to three years. Q4 Investor Relations

The breakdown by product showed mixed results. Branded checkout increased by 2%, consistent with growth seen in the first quarter. Debit and tap-to-pay transactions climbed over 60%.

Buy-now-pay-later transactions climbed by 26%. Monthly active users of Venmo debit saw an increase of over 50%. However, these quicker products have yet to drive faster growth in core checkout.

Account expansion remained modest. The number of active accounts hovered at close to 439 million, declining by 200,000 from the previous period. Total transactions increased by 8%, and transactions per active account went up by 3%.

Quarterly results were propelled by engagement rather than an increase in user numbers. While higher volume benefited, margins continued to rely largely on the product mix.

PayPal’s outlook for the third quarter is weaker, with the company projecting adjusted EPS will fall by a low-single-digit percentage. Analysts, based on LSEG data, had anticipated a 0.4% decline.

The gap accounts for the subdued reaction in premarket trading. Investors are now anticipating a recovery in margins rather than another boost to the denominator.

M&A continues to serve as a reference point for valuation. Reuters cited sources familiar with the situation who said Stripe and Advent made a $60.50-per-share proposal. No agreement has yet been confirmed.

The current bid is roughly 7.9% higher than Tuesday’s premarket signal. This gap signals not only some uncertainty regarding the transaction, but also anticipation for an increased bid.

Risks are still apparent. Margin challenges may extend beyond the current cost-cutting initiative. Apple and Alphabet continue to grow built-in payment solutions. Weak consumer demand or an unsuccessful deal process could add further pressure.

Where is PYPL trading following the latest earnings release?

Before Tuesday’s U.S. open, the latest feed showed PYPL at $56.07. That was about 0.3% below the previous close. Market value stood near $51.6 billion, with a trailing P/E around 10.5. The reported $60.50 takeover offer sits roughly 7.9% above that quote. Reuters

Did PayPal beat second-quarter expectations?

Yes, on both major headline measures. Adjusted earnings reached $1.38 a share, beating the $1.28 analyst consensus. Reported revenue reached $8.682 billion, roughly 2.5% above the $8.47 billion estimate. Total payment volume increased 10% year over year to $486.4 billion. Still, adjusted EPS declined 1% from the comparable quarter.

Was the 2026 outlook upgraded enough to change the story?

PayPal now expects about $5.38 in full-year adjusted earnings per share. The target tops both 2025’s result and LSEG’s $5.31 consensus. Full-year transaction-margin dollars are now expected near $15.6 billion. For the third quarter, adjusted EPS should decline by low single digits. The upgrade helps, but near-term earnings growth remains weak.

Is branded checkout finally recovering?

Branded checkout volume grew 2% year over year during the quarter. That matched the first-quarter pace, so meaningful acceleration remains absent. Active accounts reached 439 million, increasing only 0.3% annually. Accounts also slipped by 0.2 million from the previous quarter. Payment transactions per active account rose 3% to 60.0 over twelve months. Engagement improved, but customer growth remained almost completely flat. MarketWatch

Are Venmo, debit and buy-now-pay-later offsetting weak checkout growth?

Several faster-growing products are helping. Debit and tap-to-pay volume increased more than 60% year over year. Buy-now-pay-later activity rose 26%, while Venmo debit monthly users grew above 50%. Payment transactions across PayPal increased 8% to 6.8 billion. The release omitted full product-level profits, limiting precise earnings attribution. MarketWatch

Why are margins still the main concern?

Non-GAAP operating margin fell to 17.4% from 19.8% one year earlier. That 248-basis-point contraction came despite reported revenue increasing by 5%. Non-GAAP operating income declined 8% year over year to $1.507 billion. Transaction-margin dollars rose only 1%, or 3% excluding customer-balance interest. Management targets $400 million of cost savings by year-end. Those savings have not yet reversed the margin pressure.

Does cash generation justify the current valuation?

Second-quarter free cash flow reached $1.775 billion, increasing 157% annually. Adjusted free cash flow was slightly higher at $1.832 billion. The comparison benefited from last year’s weak $692 million base. Cash and investments exceeded reported debt by roughly $1.9 billion. At $56.07, company guidance implies about 10.4 times adjusted 2026 earnings. That multiple is low, though margin pressure remains material.

How meaningful are PayPal’s buybacks and dividend?

PayPal returned $1.5 billion through second-quarter share repurchases. Over twelve months, it bought 111 million shares for $6.0 billion. The board also declared a quarterly dividend of $0.14 per share. Assuming four equal payments, that annualizes to a yield near 1.0%. The record date is September 4, with payment scheduled September 25.

How credible is the reported Stripe-Advent takeover bid?

Reuters reported a $60.50-per-share offer valuing PayPal above $53 billion. Banks had committed about $50 billion of financing, according to unnamed sources. PayPal, Stripe and Advent declined comment, and no transaction is certain. Reuters later reported that PayPal’s board viewed the offer as inadequate. The remaining 7.9% discount shows investors are not pricing a completed deal. Reuters

What could move PYPL most during the coming week?

The regular-session response to earnings is Tuesday’s first major test. Investors will watch analyst revisions after the weaker third-quarter profit signal. Any confirmed response to the reported bid would probably dominate trading. Branded-checkout growth and operating margins remain the key business measures. The biggest downside risk is a rejected bid without stronger standalone growth. Reuters

Mateusz Kaczmarek is a financial and technology journalist at TS2.tech, covering stocks, artificial intelligence, semiconductors and global market developments. A graduate of the Poznań University of Economics and Business, he previously worked in financial analysis before moving into business journalism. His reporting focuses on technology companies, market trends and the forces shaping global investment markets. Follow Mateusz Kaczmarek on Google News.

Google Preferred Source

TS2 TECH • AI PORTFOLIO

Top AI Picks Today

A focused AI model portfolio for the current sell-off, prioritizing proven revenue growth over hype.

Today’s stance Scale in
Today’s setup
Demand signal Cloud and AI-chip revenue are holding up well.
Confirmed
Market signal Semiconductor stocks face broad selling.
Weak
Main risk AI-related capex, debt and customer financing exposure.
Rising
Staged entry plan
Initial positions 40% Begin with the highest conviction stocks.
After Microsoft results 30% Add only if cloud growth and spending remain solid.
Reserve for weakness 30% Hold back capital in case of a broader sector decline.
#1 TOP PICK 30%

Alphabet

NASDAQ: GOOGL
BUY ON WEAKNESS

Google Cloud’s faster growth and improving profitability outweigh short-term pressure from record AI investment. The post-earnings pullback improves the entry point.

Q2 cloud signal $24.8bn revenue • +82% Cloud operating margin reached 35.6%.
Action

Build the position in three steps. Avoid chasing sharp rebounds.

Main risk: Q2 free cash flow turned negative as capex hit $44.9bn.
#2 CORE PLATFORM 25%

Microsoft

NASDAQ: MSFT
BUY IN 2 STEPS

Azure, Microsoft 365 and enterprise channels provide the most balanced approach to AI monetization across infrastructure and software.

Latest reported signal Azure +40% • AI run rate +123% Demand continues to surpass available capacity.
Action

Take a partial position now; reassess after fiscal Q4 results.

Main risk: Higher component costs and AI capex may weigh on free cash flow and cloud margins.
#3 CUSTOM SILICON 20%

Broadcom

NASDAQ: AVGO
ACCUMULATE

Broadcom brings together custom AI accelerators, Ethernet networking and steady infrastructure-software cash flow. Growth remains strong.

Q2 AI semiconductor revenue $10.8bn • +143% Q3 AI revenue guidance is about $16.0bn.
Action

Accumulate on sector weakness, ideally in two or three entries.

Main risk: High customer concentration and a valuation that is sensitive to guidance.
#4 MANUFACTURING 15%

TSMC

NYSE: TSM
CORE BUY

TSMC remains the key manufacturer for leading AI chip designers, with the strongest demand at advanced nodes.

Q2 operating signal Revenue up 36% • profit up 77% Management now sees 2026 revenue growth topping 40%.
Action

Use price weakness to build a smaller core holding rather than a full allocation.

Main risk: Taiwan exposure, high capex and temporary margin pressure from the 2nm ramp.
#5 STARTER POSITION 10%

Nvidia

NASDAQ: NVDA
HIGH RISK

Nvidia’s operating momentum is strong, but keep positions small until customer-financing commitments are clear.

Latest operating signal Data Center $75.2bn • +92% Q2 revenue guidance is about $91.0bn.
Action

Starter position only. Add after more clarity on financing or the next earnings report.

Main risk: Circular financing, customer credit risk and high sector volatility.
Target portfolio structure
Cloud platforms 55%
Custom silicon & networking 20%
Advanced manufacturing 15%
AI accelerators 10%
Risk check

This portfolio is concentrated in a single investment theme. Rate shocks, capex slowdowns, export restrictions or credit issues could hit multiple holdings at once.

MODEL PORTFOLIO 100% target allocation

Editorial model. This is not personalised investment advice. Target weights reflect a phased entry approach rather than deploying the full allocation at once. Data sources include company earnings releases, S&P Global, and Reuters market reports.

Corning (NYSE:GLW) Drops Nearly 17% Premarket as Q3 Revenue Approaches $20 Billion Target
Previous Story

Corning (NYSE:GLW) Drops Nearly 17% Premarket as Q3 Revenue Approaches $20 Billion Target

Nasdaq-100 drops 1.9 points as investor caution over AI funding eclipses oil price boost
Next Story

Nasdaq-100 drops 1.9 points as investor caution over AI funding eclipses oil price boost