Nasdaq-100 drops 1.9 points as investor caution over AI funding eclipses oil price boost

Nasdaq-100 drops 1.9 points as investor caution over AI funding eclipses oil price boost

NEW YORK, July 28, 2026, 08:01 EDT — U.S. premarket trade saw the Nasdaq-100 reverse by 1.9 points, with apprehension surrounding investment in the artificial intelligence sector surpassing any uplift from easing oil prices.

  • Nasdaq-100 futures slipped 1.04% at 7:04 ET, while Dow futures gained 0.5%.
  • The Nasdaq-100 indicator on Monday shifted 1.93 percentage points between the initial futures and the cash market close.
  • The Fed meets on Wednesday, with major Big Tech earnings set for Wednesday and Thursday.

At 7:04 ET, Nasdaq-100 futures dropped 1.04%, while Dow futures rose 0.5%. The divergence continued Monday’s shift away from growth stocks with heavy exposure to chips.

Market moves delivered a clearer signal than final index levels. On Monday, a drop in oil prices failed to counteract skepticism over AI expenditure.
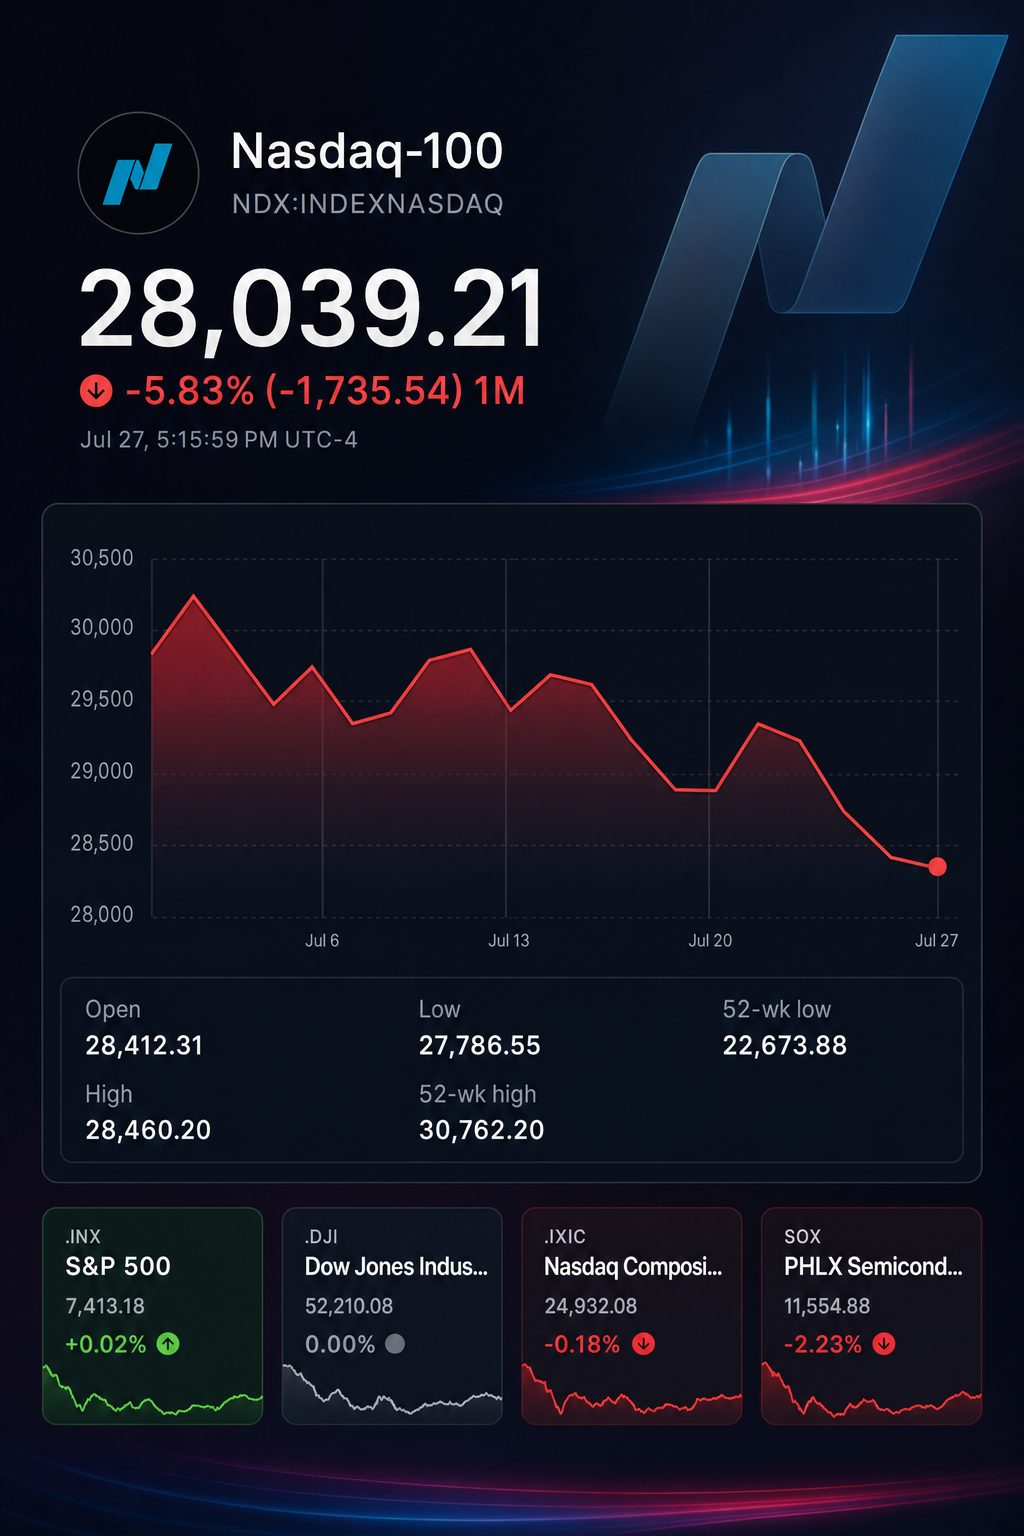
Stock chart for INDEXNASDAQ:NDX
BenchmarkMonday 06:48 ET futuresMonday cash closeApproximate fade
S&P 500+1.01%+0.02%-0.99 points
Nasdaq-100+1.61%-0.32%-1.93 points
Dow+1.03%+0.51%-0.52 points

Initial figures for Monday came in at 06:48 ET. “Fade” is calculated as the cash close less the corresponding futures reading. This gauge is indicative only and not meant for trading, since futures and cash indices are settled differently. Investing.com

The Nasdaq-100 slipped 1.93 points, close to twice the drop seen in the S&P, and roughly 3.7 times greater than the Dow’s decline.

Nvidia dropped 5.0% on Monday after The Journal reported discussions involving about $250 billion in potential OpenAI financing support. Apple climbed 1.2%, widening the performance differential to 6.2 points. Apple regained its position as the leading U.S. company by market value.

The Philadelphia chip index fell 2.2%, now standing 21% under its record from June 22. Despite the decline, it is still showing a 63% gain for the year.

Brent crude dropped 8%, trading near $89 per barrel. Shares of Occidental Petroleum declined 4.1%, and Exxon Mobil slipped 1.4%. This prompted sector rotation rather than a widespread rally.

The pressure increased ahead of Tuesday’s open. Shares of Micron Technology dropped 5.5%. Applied Materials declined 4.3%, and Nvidia edged down another 1%.

Cash flow was highlighted by Ipek Ozkardeskaya, senior analyst at Swissquote Group . She noted that a renewed “dive in their free cash flow levels” could bring issuance worries back to the forefront. Reuters

The pressure was evident last week as the Dow slipped 0.4%, the S&P 500 declined 0.6%, and the Nasdaq retreated 2.0%.

This came after a short-lived chip recovery on July 21. According to The Journal, stocks then broke a three-day streak of declines.

Microsoft and Meta Platforms are set to release results on Wednesday. Amazon.com and Apple are scheduled for Thursday.

Investors are set to focus on capital expenditures, depreciation, and free cash flow. Revenue growth by itself might not be enough to meet expectations.

The Federal Reserve will announce its decision on Wednesday. Early Tuesday, traders saw a 35.8% probability of a quarter-point increase. PCE inflation data for June is due on Thursday.

Risks exist on both sides. If a lasting ceasefire is achieved and inflation eases, growth stocks might rebound. On the other hand, disappointing cash-flow projections or an unexpected rate hike could extend the chip market downturn.

This week, investors will be assessing the strength of company funding in addition to appetite for AI. Firms able to support growth plans without taking on extra debt or issuing new shares could emerge ahead.

What is the SPY trading level ahead of Tuesday’s market open?

SPY ended Monday at $739.09, moving between $735.87 and $745.52 during the session. Early Tuesday, the ETF hovered close to $739, little changed from the previous close. At 7:04 a.m. ET, S&P 500 futures slipped 0.13%. The S&P 500 index closed Monday at 7,413.18, edging up 0.02%. State Street Global Advisors

Is SPY’s 2026 surge running out of steam?

The S&P 500 is up 8.3% for the year so far, though it has posted losses for two weeks in a row. SPY ended the session 2.8% beneath its 52-week peak of $760.40. The index’s range between its intraday high and low on Monday was 1.3%, while the close remained largely unchanged. Short-term momentum has lessened, but the index’s annual advance is still considerable. AP News

Might the Federal Reserve catch SPY off guard by raising rates?

The Federal Open Market Committee is set to convene July 28-29, with a policy decision due Wednesday. The target range for federal funds currently stands at 3.50% to 3.75%. As of Tuesday morning, traders saw a 35.8% chance of a rate hike. No change is still viewed as more probable. However, an unexpected increase would likely weigh on SPY’s growth-oriented stocks. Federal Reserve

To what extent could megacap earnings impact SPY movement this week?

Microsoft and Meta are scheduled to report on July 29, with Apple and Amazon set to follow on July 30. Collectively, these four equities account for 17.89% of SPY’s reported holdings. If each were to move 5% at the same time, SPY could be shifted by roughly 0.9%, assuming all other factors remain unchanged. Impacts could be larger, as supplier and peer stocks frequently move in correlation. AI spending and free cash flow are expected to be major factors influencing the market response. Microsoft

Does SPY trade at a high valuation compared to its projected earnings?

On July 27, the index underlying SPY was valued at 25.92 times trailing earnings, while its forward P/E stood at 21.61. Analysts projected its three-to-five-year EPS growth at 17.75%. These valuations limit the margin for unexpected earnings shortfalls or higher yields. S&P 500 earnings for the second quarter were anticipated to increase about 26% from a year earlier. While that growth projection provides some support, it is still just an estimate. State Street Global Advisors

Is broader market participation increasing outside of megacap tech?

The Russell 2000 rose 0.6% on Monday, while the Nasdaq slipped 0.2%. The small-cap index has advanced 18.8% so far this year, outpacing the S&P 500’s 8.3% gain. Early Tuesday trading showed IWM up 0.62%, as QQQ dropped 0.35%. This shift expands market leadership, but technology continues to account for 36.83% of SPY. AP News

What are the key SPY price levels to watch this week?

The session low of $735.87 on Monday marks the closest notable downside level. At $745.52, the high is roughly 0.9% higher than Monday’s close. The 52-week high of $760.40 is about 2.9% above that same close. These are reference points, not assured support or resistance zones. Major moves on Fed news or earnings could quickly alter them. State Street Global Advisors

What economic data releases could impact SPY following the Fed?

On Thursday, markets await advance GDP data for the second quarter along with June PCE inflation, income, spending, and jobless claims. Economists’ median projection puts annualized GDP growth at 1.8%. Headline PCE inflation is seen at 3.7%, easing from 4.1%, while core PCE is expected at 3.3% from a prior 3.4%. The employment cost index, out Friday, is seen rising 0.8% on the quarter. Stronger results would bolster the argument for more rate hikes. MarketWatch

To what extent do oil prices and geopolitical news impact SPY?

Brent crude closed at $85.87 on Monday after a 6.3% slump that day. The price had reached $102 at its peak in the previous week. Oil prices slid another 2.5% on Tuesday morning on continued ceasefire optimism. Energy makes up just 3.33% of SPY. The broader impact could stem from shifts in inflation expectations and Treasury yields. AP News

Shan Ahmed Khan is a senior markets reporter at TS2.tech, specializing in stocks, technology and macroeconomic trends. A graduate of the Lahore University of Management Sciences (LUMS), he previously worked in investment research and market analysis. His coverage helps readers understand the key developments influencing global financial markets and emerging industries.

Google Preferred Source

TS2 TECH • AI MODEL PORTFOLIO

Top Stock Picks Today

A global equity portfolio selected by TS2 AI models using earnings, valuation, revisions, momentum, catalysts and news risk.

Today’s market stance Selective risk-on
#1 • HIGHEST CONVICTION 24% weight

Alphabet

NASDAQ: GOOGL
STRONG BUY
AI score 94 / 100
★★★★★

Cloud growth, durable Search cash flow and the post-results pullback create the portfolio’s strongest risk-reward setup.

Why today

Strong cloud demand • earnings revisions • improved entry price

Next catalyst

Evidence that record AI investment is converting into cash returns.

Main risk: Capex, depreciation and regulatory pressure.
#2 • QUALITY COMPOUNDER 22% weight

Visa

NYSE: V
BUY
AI score 91 / 100
★★★★★

A high-margin global payments network with resilient transaction growth, strong cash generation and limited balance-sheet risk.

Why today

Defensive growth • pricing power • consistent earnings execution

Next catalyst

Quarterly results and updated cross-border payment trends.

Main risk: Regulation, consumer slowdown and earnings volatility.
#3 • DEFENSIVE GROWTH 20% weight

Unilever

LON: ULVR • NYSE: UL
BUY
AI score 89 / 100
★★★★☆

Better-than-expected sales, improving execution and defensive brands provide diversification away from expensive technology shares.

Why today

Earnings beat • improving sentiment • defensive cash flows

Next catalyst

Margin progress and confirmation of stronger volume growth.

Main risk: Currency moves and renewed input-cost inflation.
#4 • EARNINGS MOMENTUM 18% weight

Sherwin-Williams

NYSE: SHW
BUY
AI score 87 / 100
★★★★☆

A fresh earnings beat, raised outlook, pricing power and market-share gains produce one of today’s clearest positive revision signals.

Why today

Raised guidance • margin resilience • positive earnings revision

Next catalyst

Delivery against the upgraded full-year earnings outlook.

Main risk: Housing weakness and raw-material inflation.
#5 • CORE TECHNOLOGY 16% weight

Microsoft

NASDAQ: MSFT
ACCUMULATE
AI score 85 / 100
★★★★☆

Azure, enterprise software and recurring revenue remain elite assets, but the lower weight reflects near-term earnings-event risk.

Why today

Cloud leadership • recurring revenue • long-term AI monetisation

Next catalyst

Results, Azure growth and guidance on infrastructure spending.

Main risk: High expectations and pressure on cloud margins.
Portfolio structure
Technology & cloud 40%
Payments 22%
Consumer staples 20%
Industrials & materials 18%
Portfolio heat 7.1 / 10

Selective risk-on. Prioritise quality and earnings visibility.

!
Market risk check

A heavy earnings calendar, Federal Reserve guidance and renewed semiconductor volatility may produce sharp one-day price moves.

TS2 AI MODEL PORTFOLIO 100% allocated

Editorial model portfolio, not personalised investment advice. AI scores are comparative signals, not guaranteed return forecasts.

PayPal (NASDAQ:PYPL) Shares Retain Majority of Bid Premium as Q2 Report Nears
Previous Story

PayPal (NASDAQ:PYPL) Lifts 2026 Guidance; Share Buybacks Offset 11% Fall in Adjusted Profit

Amazon (NASDAQ:AMZN) shares decline as almost all operating cash flow goes to capex
Next Story

Amazon Earnings Outlook: AWS Margins Under Pressure Amid $200 Billion Capex Plan