Stellantis (NYSE:STLA) shares decline as key markets post 0.5% margin

Stellantis (NYSE:STLA) shares decline as key markets post 0.5% margin

NEW YORK, July 31, 2026, 12:05 p.m. EDT — U.S. markets open

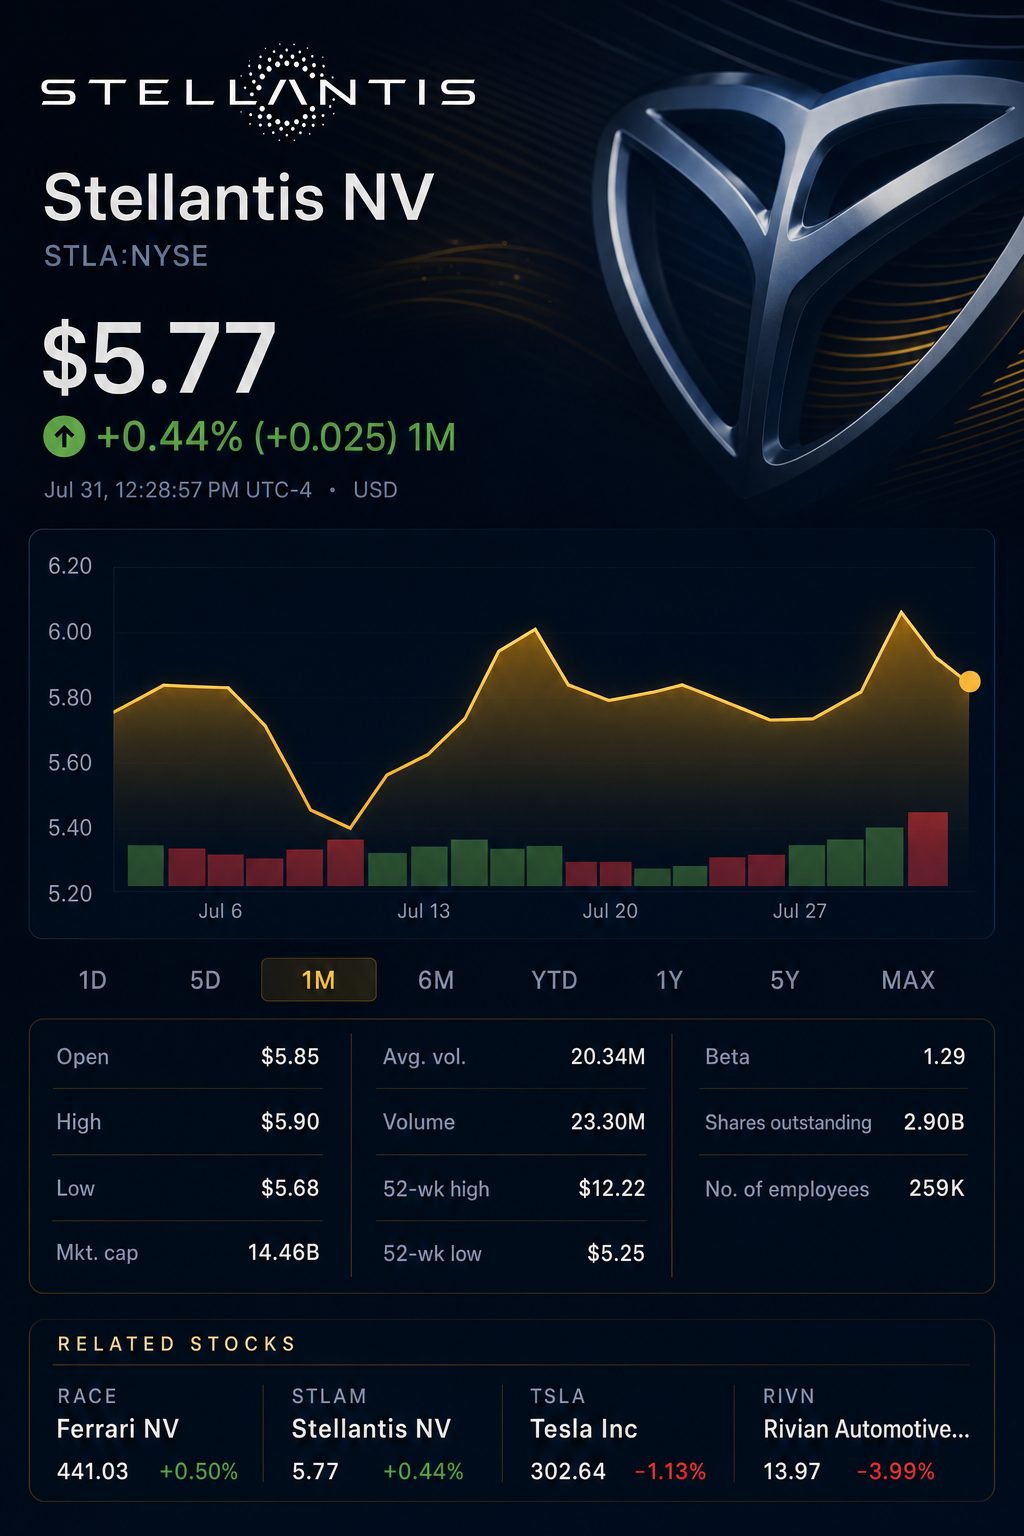
  • The stock fell 1.8% to $5.76 as of 11:50 a.m. EDT.
  • Adjusted operating income totaled €773 million, falling 15% short of the Reuters survey forecast.
  • North America and Europe accounted for 79.6% of revenue while contributing 24.6% of group AOI.

Stellantis stock dropped 1.8% by late Friday morning as second-quarter earnings came in below expectations. The combined adjusted margin for North America and Europe was 0.5%, seen as the key metric.
Stock chart for NYSE:STLA

The two markets brought in €34.6 billion in revenue, but adjusted operating income reached just €190 million. In comparison, South America and the Middle East & Africa delivered €731 million in adjusted operating income from €6.9 billion of revenue.

The shift in profit sources makes the turnaround reliant on smaller markets. U.S. volume is rebounding, but earnings are not following suit.

Q2 results, preliminary

MetricQ2 2026Q2 2025Change
Net revenue€43.482 billion€38.448 billionUp 13%
Combined shipments1.603 million1.457 millionHigher by 10%
Adjusted operating income€773 million€213 millionIncrease of 263%
AOI margin1.8%0.6%1.2 points rise
Net profit/(loss)€293 million-€1.869 billion€2.162 billion improvement
Industrial free cash flow€1.000 billion€31 millionUp €969 million

Analysts surveyed by Reuters had forecast adjusted operating income at €914 million. Stellantis underperformed that estimate by 15.4%. Shares in Milan finished down 4.3% following Thursday’s announcement.

The revenue per combined shipment increased by 2.8% to approximately €27,125. AOI per shipment advanced to nearly €482, up from €146. The comparison period had a low base.

Chief Executive Antonio Filosa said, “We need time… these are not challenges that you address overnight.” Leadership is focusing on market coverage, production costs and vehicle quality. Reuters

Regional earnings breakdown, based on company figures

OperationsRevenueShare of group revenueAOIShare of group AOIImplied margin
North America and Europe€34.619 billion79.6%€190 million24.6%0.5%
South America and Middle East & Africa€6.903 billion15.9%€731 million94.6%10.6%
Asia Pacific and other activities€2.081 billion4.8%€106 million13.7%5.1%
Corporate costs and eliminations-€121 million-0.3%-€254 million-32.9%n.m.
Stellantis€43.482 billion100.0%€773 million100.0%1.8%

AOI from South America and Middle East & Africa was 2.6 times higher than in North America. Europe reported a loss of €94 million. North America made €284 million in AOI, despite its significantly greater revenue base.

Shipments in North America surged 38%, with regional revenue up 32%. Nevertheless, the AOI margin came in at just 1.6%. Overall inventory rose by 20% to reach 1.444 million vehicles.

Stellantis attributed the production to upcoming releases and scheduled summer closures. Initial July sales figures indicated inventory below June levels. Confirmation of this outlook is now needed.

Fabio Caldato, a fund manager at AcomeA Sgr, described the outcome as “a bit more debatable.” He noted that dealer inventory buildup had bolstered revenue in North America. Reuters

Rival figures illustrate the extent of the disparity. General Motors reported a group margin of 8.2%, with North America at 8.6%. Ford posted a group margin of 5.2%.

Comparison of adjusted margins

CompanyQ2 revenue growthGroup adjusted EBIT/AOI marginNorth America margin
Stellantis+13.0%1.8%1.6%
General Motors+1.9%8.2%8.6%
Ford-4.0%5.2%Figure not reported separately

Non-GAAP interpretations vary between the three firms. Nonetheless, Stellantis lagged GM by seven percentage points in North America. Ford, meanwhile, turned softer revenue into a stronger overall margin.

Stellantis Q2 adjusted operating profit breakdown

Year-on-year driverEstimated AOI effect
Lower industrial costsOver +€1.9 billion
Changes in volume and product mix+€376 million
Net effect from pricing-€456 million
Costs for sales and administration-€370 million
Currency and miscellaneous impacts-€861 million
Total AOI improvement+€560 million

The benefit from industrial costs was roughly 2.5 times overall quarterly AOI. Gains were seen in purchasing and manufacturing. Still, the number also reflected non-recurring comparisons related to recall and regulatory costs.

Stellantis maintained its 2026 forecast, projecting mid-single-digit revenue growth. The company still sees a low-single-digit AOI margin and anticipates improved industrial free cash flow. Positive industrial free cash flow is not expected until 2027.

Tariff expenses are projected between €1.0 billion and €1.2 billion. The summer closure along with higher raw material costs are set to impact third-quarter performance. Management anticipates that the majority of the second-half earnings will be realized in the fourth quarter.

Risks: Dealers might require increased incentives to reduce inventory. Europe continues to post losses. Tariffs and raw material expenses may offset ongoing savings. A plan focused on the fourth quarter allows minimal margin for setbacks.

July inventory figures are up next, followed by North American margin results. Unless there are gains on both fronts, the majority of operating profit will continue to be generated outside Stellantis’s main markets.


TS2 TECH • EXTENDED COVERAGE

Further analysis

What caused Stellantis stock to decline even though second-quarter revenue increased by 13%?
Investors prioritized profit quality over the topline revenue recovery. Stellantis reported €773 million in Q2 adjusted operating income, missing the analyst consensus of €914 million. The margin was at 1.8%, as consolidated shipments grew 10%. Shares in Milan closed down 4.3% at €5.06 on Thursday. On the NYSE, shares changed hands at about $5.76 at 16:16 UTC Friday, a decline of ten cents. stellantis.com
Is North America's recovery sufficiently robust?
North American sales climbed 6% and revenue grew 32% from a year earlier. Market share improved to 7.4%, up by 40 basis points. However, regional AOI totaled just €284 million, resulting in a 1.6% margin. Shipments surged 38%, in part due to dealers taking delivery of launch inventory ahead of summer shutdowns. The recovery is clear, but operating leverage continues to lag. stellantis.com
Is Stellantis still on track to achieve its 2026 targets?
The company maintained its outlook for mid-single-digit revenue growth and a low-single-digit AOI margin. Revenue increased by 10% in H1, with the AOI margin at 2.1%, suggesting the revenue goal can be met. However, cash generation poses a challenge: H1 industrial free cash flow was still negative at €921 million. Management anticipates Q3 shutdown pressure, followed by a stronger Q4. Guidance remains unchanged, but execution risk is considerable. stellantis.com
How significant is the issue of declining profits in Europe?
Enlarged Europe posted an adjusted operating loss of €94 million for Q2, resulting in a negative margin of 0.6%, even with a 3% rise in sales. EU30 market share declined by 80 basis points to 16.0%. Group net pricing decreased by €456 million, mainly due to pressure on European prices. Leapmotor sales increased sixfold, but higher volumes have yet to return the region to profit. stellantis.com
Are vehicle stockpiles reaching hazardous levels?
Inventory totaled 1.444 million vehicles as of June 30, reflecting a 20% rise from a year earlier. The company said most of the gain was due to new model launches and preparations for shutdowns. Management expects preliminary July sales rates to bring inventory down from June levels. However, North American shipments increased by 38%, while sales grew by just 6%. This difference could increase the risk of higher discounts and working-capital exposure if demand slows.
To what extent could tariffs and raw material costs impact earnings?
Stellantis forecasts net tariff costs between €1.0 billion and €1.2 billion for 2026. In the first half, tariff expenses reached €300 million following a €400 million IEEPA reimbursement. The projected full-year amount is around 58%-69% of H1 adjusted operating profit, which serves as an illustration of scale rather than a specific profit projection. Management anticipates greater raw-material cost pressure in the second half. Significant changes in tariff policy could have a material impact on the estimate. stellantis.com
Is the balance sheet robust enough to support the turnaround?
As of June 30, industrial available liquidity amounted to €44.1 billion. The industrial net financial position was positive at €10.0 billion, supported by €5 billion in perpetual hybrid securities. These securities have initial coupon rates ranging from 6.25% to 8.25%. The credit ratings are Baa3 and BBB-, the minimum levels for investment grade. Liquidity levels are high, but financing costs are elevated.
What are analysts' current projections for the share price?
The latest analyst consensus indicates a neutral stance with an average price target of €6.94. Projections vary widely, from €4 up to €12.50. With shares closing at €5.06 in Milan on Thursday, the average target points to an approximate 37% potential increase. The lowest estimate suggests a 21% decline, while the highest indicates a possible 147% rise. This range reflects significant disagreement regarding margins, cash flow, and execution. Q2 results were released yesterday, so the consensus could change. investing.com
When will dividends or buybacks be reinstated?
Stellantis will not issue an annual dividend in 2026 following a net loss in 2025. No share buybacks took place in the first half of 2026. The company projects that positive industrial free cash flow will not appear until 2027, making capital returns unlikely in the short term. Distribution for 2027 is uncertain and will depend on available cash. stellantis.com
What factors would lend credibility to the FaSTLAne 2030 plan?
FaSTLAne aims for €190 billion in revenue and a 7% AOI margin by 2030. It also seeks €6 billion in industrial free cash flow that year. Annual cost savings are targeted to hit €6 billion by 2028. Management anticipates that 40% of these measures will be executed by the end of 2026. These steps are expected to deliver €2.4 billion in AOI gains in 2027. Investors require quarterly confirmation via North American margin, European pricing, and cash flow metrics—these are the critical indicators. stellantis.com

Michał Rogucki is a senior markets reporter at TS2.tech, specializing in stocks, technology and macroeconomic developments. A graduate of Humboldt University of Berlin, he previously worked in investment research and market analysis before transitioning to financial journalism. He covers the trends and events that matter most to investors worldwide.

AI PORTFOLIO

Top Stock Picks

Today’s highest-ranked model selections.

#1 STRONG BUY

Xylem

NYSE: XYL 94 / 100
#2 STRONG BUY

AerCap

NYSE: AER 92 / 100
#3 BUY ON WEAKNESS

Visa

NYSE: V 90 / 100
#4 BUY

Chevron

NYSE: CVX 86 / 100
#5 ACCUMULATE

UPS

NYSE: UPS 84 / 100
View full portfolio
Editorial model selection. Not personalised advice.
Dow Jones Gains Led by Five Stocks While Broader Market Lags
Previous Story

Dow Jones Gains Led by Five Stocks While Broader Market Lags

Next Story

US Stocks Hold Steady Midday Amid AI-Driven Gains, Treasury Yield Stands at 4.73%