NEW YORK, August 1, 2026, 10:06 EDT — Trading on U.S. markets has ended.
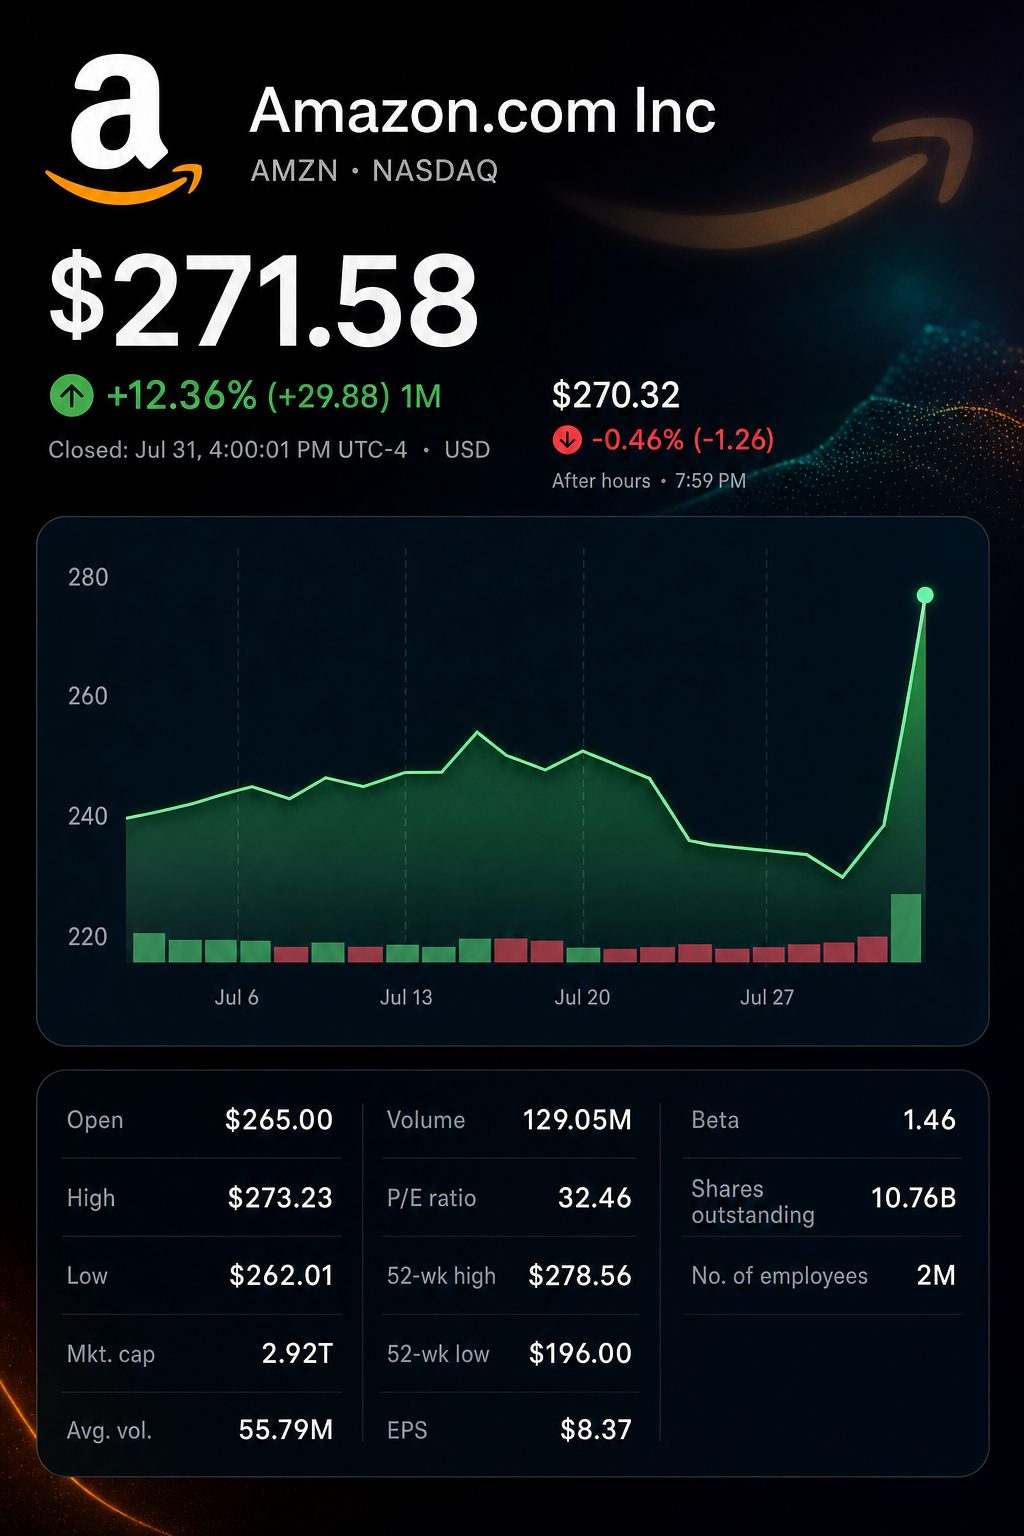
- Amazon ended Friday at $271.58, rising 15.32% on the day, with a weekly increase of around 17.0%.
- Amazon’s year-on-year rise in operating income was driven by AWS, which accounted for 77.9% of the total increase.
- Expected capital expenditure for 2026 increased to $220 billion, as trailing free cash flow declined to a negative $7.6 billion.
Amazon’s surge on Friday was driven by factors beyond AWS’s 37% growth. The cloud division accounted for $6.46 billion of the $8.29 billion rise in Amazon’s operating profit.
This amounted to 77.9% of incremental profit, compared with 34.5% of incremental sales. For every additional dollar of AWS sales, around 57 cents in operating income was produced.
The split accounts for the market reaction. Amazon continues significant spending, yet AWS now demonstrates direct profit conversion.
Amazon Q2 report card — $ billions unless otherwise stated
| Metric | Q2 2026 | Q2 2025 | Change |
|---|---|---|---|
| Net sales | $200.61 | $167.70 | up 19.6% |
| Operating income | $27.46 | $19.17 | up 43.2% |
| Operating margin | 13.7% | 11.4% | up 2.3 pts |
| AWS sales | $42.23 | $30.87 | up 36.8% |
| AWS operating income | $16.62 | $10.16 | up 63.6% |
| AWS operating margin | 39.4% | 32.9% | up 6.5 pts |
| Advertising services | $19.81 | $15.69 | up 26.2% |
The cloud segment outperformed the overall company. AWS surpassed the $40.54 billion forecast from LSEG referenced by CNBC by 4.2%. Companywide revenue came in 2.1% above the $196.47 billion consensus projection.
Reported earnings come with a caveat. Pre-tax profits of $53.4 billion, primarily due to Anthropic, boosted earnings per share to $5.75.
Amazon’s sources of additional growth — $ billions
Figures based on company-disclosed segment data.
| Segment | Added sales | Share of sales growth | Added operating profit | Share of profit growth | Incremental margin |
|---|---|---|---|---|---|
| North America | $16.11 | 49.0% | $1.61 | 19.4% | 10.0% |
| International | $5.44 | 16.5% | $0.22 | 2.7% | 4.1% |
| AWS | $11.36 | 34.5% | $6.46 | 77.9% | 56.9% |
| Amazon total | $32.90 | 100.0% | $8.29 | 100.0% | 25.2% |
Chief Executive Andy Jassy described AWS as “booming.” Amazon reported that its AI and chip divisions each surpassed a $25 billion yearly run rate, with both segments posting triple-digit growth. Amazon
Orders are placed well in advance. AWS backlog stood at $496 billion, rising from $364 billion in the previous quarter. Nearly all 2027 inventory and portions of what will be available in 2028 have been allocated.
Retail performance continued, with North America sales up 16%. Advertising revenue increased by 26% to $19.8 billion. Despite this, AWS remained the primary driver of additional profit.
Capital costs compared with committed demand
| Metric | Latest figure | Comparison | Change |
|---|---|---|---|
| Planned 2026 capital spending | $220.0 | Previous plan: $200.0 | +10.0% |
| AWS backlog | $496.0 | Q1 2026: $364.0 | +36.3% |
| Trailing operating cash flow | $161.4 | Previous year period: $121.1 | +33.2% |
| Trailing net property purchases | $169.0 | Previous year period: $103.0 | +64.2% |
| Trailing free cash flow | -$7.6 | Previous year period: $18.2 | -$25.8 shift |
“Amazon is earning the right to keep spending,” said Thomas Monteiro, senior analyst at Investing.com. However, cash outlays are still considerable. Over the past year, net property acquisitions have been greater than operating cash flow. Reuters
The cloud sector results were challenging. Microsoft NASDAQ:MSFT delivered 43% growth in Azure revenue. Alphabet NASDAQ:GOOGL saw Google Cloud revenue climb 82%, a figure that was partly driven by increased sales of TPU systems.
Cloud platform comparison — most recent reported quarter
Incremental margins reflect year-on-year reported changes.
| Platform | Segment revenue | Year-on-year growth | Operating margin | Incremental margin |
|---|---|---|---|---|
| Amazon AWS | $42.23 billion | 36.8% | 39.4% | 56.9% |
| Microsoft Intelligent Cloud | $39.31 billion | 31.6% | 40.6% | 40.5% |
| Google Cloud | $24.77 billion | 81.8% | 35.6% | 53.7% |
AWS delivered both significant scale and margin, posting a 39.4% margin that was close to Microsoft’s larger Intelligent Cloud division. Google Cloud recorded a 35.6% margin. The comparison is approximate, given differences in reporting scope.
Amazon projected more stable performance for its third quarter, forecasting revenue growth between 9% and 12%. The outlook factors in an 80-basis-point headwind from foreign exchange. Absent the impact of Prime Day’s timing, sales would expand by almost four percentage points more.
Amazon forecasts for third quarter
| Metric | Q3 2026 outlook | Q3 2025 actual | Growth indicated |
|---|---|---|---|
| Net sales | $197 billion-$202 billion | $180.17 billion | +9% to +12% |
| Operating income | $22.5 billion-$26.5 billion | $17.42 billion | +29% to +52% |
| Currency impact on sales growth | Roughly -0.8 percentage point | — | Negative effect |
Amazon advanced 17.0% over the past week. The S&P 500 increased 1.05%, with the Nasdaq climbing 1.59%.
Three major events are on the calendar for next week. Advanced Micro Devices NASDAQ:AMD will announce results after Tuesday’s market close. ISM services data is set to be published Wednesday, and July payrolls are due on Friday.
Risks: AWS expansion could slow ahead of revenue from added capacity. Rising memory prices might push capital expenditure higher. Persistently strong services inflation could increase yields, and slower hiring might weigh on retail consumption.
Related articles: NASDAQ:MSFT