
NEW YORK, August 8, 2026, 12:08 EDT
- SoFi ended trading on Friday at $18.38, a gain of 1.55% on the day, bringing its weekly increase to 12.7%. The Nasdaq advanced 5.19%.
- The company’s numbers suggest second-half adjusted EBITDA of approximately $902 million, a 29% increase over the first half, with revenue up around 9% at the midpoint of the forecast range.
- The consensus from 13 analysts on Google Finance is Hold. KBW continues to rate the stock as Sell, keeping a $16 price target.
U.S. stock markets did not open on Saturday. SoFi Technologies, Inc. NASDAQ:SOFI finished Friday at $18.38, rising 1.55%. Shares advanced 12.7% across the past five sessions.
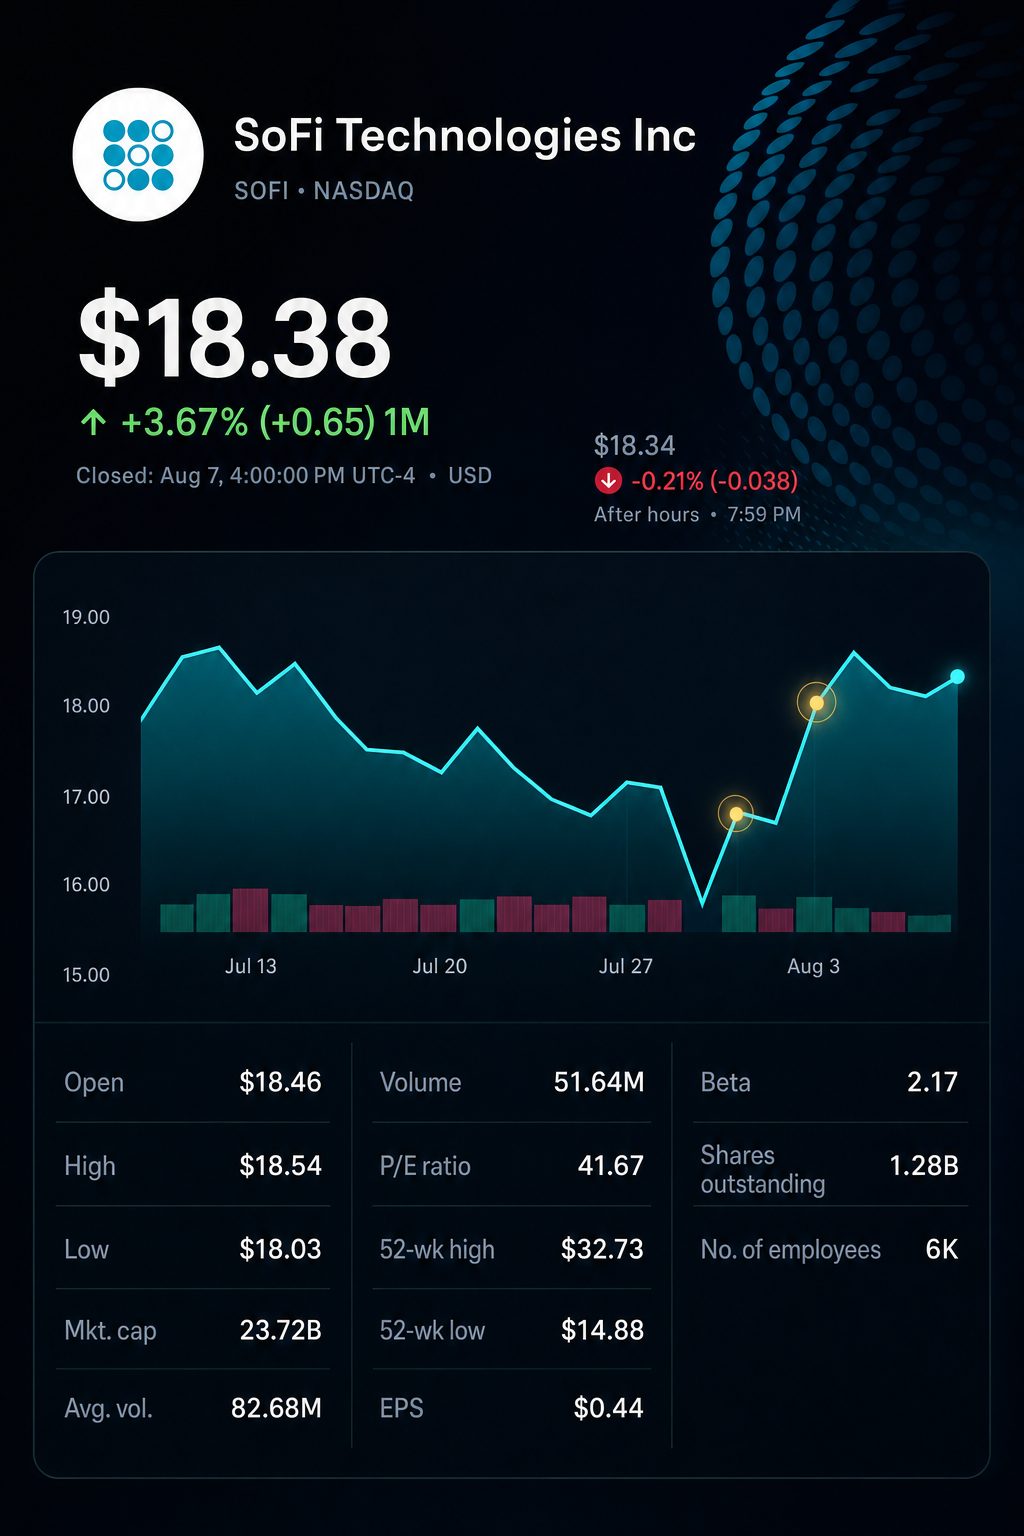
The rebound outperformed the Nasdaq’s 5.19% gain for the week. The S&P 500 advanced by 3.58%. A disappointing payrolls report on Friday reduced the likelihood of a September rate hike to 44%, fueling further gains across the market.
The following test presents a greater challenge. SoFi increased its 2026 adjusted revenue forecast following its second quarter update. Adjusted EBITDA, net income, and EPS targets remain the same. This outlook means profit must outpace revenue growth.
SoFi surpassed the weekly stock performance of two major consumer fintech competitors. The stock returns below are calculated using closing prices from July 31 and August 7.
| Instrument | August 7 close | Friday change | Weekly change |
|---|---|---|---|
| SoFi Technologies NASDAQ:SOFI | $18.38 | up 1.55% | up 12.7% |
| Robinhood Markets NASDAQ:HOOD | $93.29 | up 2.84% | up 7.8% |
| Affirm Holdings NASDAQ:AFRM | $75.25 | down 1.74% | up 5.2% |
| Nasdaq Composite | 26,690.62 | up 1.30% | up 5.19% |
| S&P 500 | 7,757.64 | up 0.62% | up 3.58% |
The recovery began strongly, with SoFi surging 10.55% on Monday before giving back some of those gains later in the week. On Friday, trading volume reached 51.6 million shares, approximately 34% under its 65-day average.
Despite the rebound, SoFi is still 43.8% under its 52-week peak of $32.73. The shares are trading at roughly 41.7 times their trailing earnings. While momentum picked up, questions over valuation persist.
Based on first-half performance and annual forecasts, the implied second-half hurdle is as follows. Calculations are mathematical estimates and do not represent formal quarterly guidance from the company.
| Metric | H1 2026 actual | Full-year 2026 guidance | Implied H2 estimate | H2 versus H1 |
|---|---|---|---|---|
| Adjusted net revenue | $2.293 billion | $4.75–$4.85 billion | $2.457–$2.557 billion | +7.2% to +11.5% |
| Adjusted EBITDA | $697.7 million | About $1.60 billion | $902.3 million | +29.3% |
| Adjusted net income | $327.1 million | About $825 million | $497.9 million | +52.2% |
| Adjusted diluted EPS | $0.24 | About $0.60 | $0.36 | +50.0% |
| Adjusted EBITDA margin | 30.4% | About 33%–34% | 35.3%–36.7% | Increase of 4.9 to 6.3 points |
To reach the midpoint of the revenue forecast, H2 adjusted revenue has to grow 9.4% from H1 levels. EBITDA is required to increase by 29.3%, while adjusted net income needs to climb 52.2%. For H2, the implied EBITDA margin stands at around 36%, compared with 30.4% reported in H1.
The second quarter backed up the margin improvement. Fee-based revenue totaled $472.3 million, accounting for 39% of total revenue, and rose 22% compared to Q1. Deposit funding generated estimated annualized savings of $712.6 million versus warehouse facilities.
The distribution was still imbalanced. Lending net revenue increased 63% compared to the same period last year. Technology Platform revenue declined by 23%, and its contribution margin decreased to 14% from 30%.
The latest quarterly results highlight the overall scale as well as the key area of weakness.
| Operating measure | Q2 2026 | Q2 2025 | Change |
|---|---|---|---|
| Adjusted net revenue | $1.206 billion | $858.2 million | +40% |
| Adjusted EBITDA | $357.8 million | $249.1 million | +44% |
| Adjusted diluted EPS | $0.12 | $0.08 | +50% |
| Members | 15.8 million | 11.7 million | +35% |
| Total products | 24.4 million | 17.1 million | +42% |
| Total loan originations | $14.8 billion | $8.76 billion | +69% |
| Technology Platform revenue | $84.5 million | $109.8 million | -23% |
CEO Anthony Noto told Reuters: “Spending remains strong, demand remains strong, and credit performance continues to meet or exceed our expectations.” Annualized charge-offs for personal loans dropped to 2.62%, down from 3.03% in the first quarter. Reuters
Wall Street analysts are split. According to Google Finance’s three-month data, there are four Buy, six Hold, and three Sell recommendations. The mean price target stands at $19.27, just 4.8% higher than where shares finished on Friday.
| Analyst recommendation measure | Current reading |
|---|---|
| Buy recommendations | 4 |
| Hold recommendations | 6 |
| Sell recommendations | 3 |
| Overall consensus | Hold |
| Mean price target | $19.27, or +4.8% |
| Top price target | $30.00, or +63.2% |
| Lowest price target | $15.00, or -18.4% |
KBW’s Tim Switzer maintained a Sell rating on Thursday, setting a $16 price target, which is 12.9% under Friday’s closing price. Price forecasts overall range from $15 to $30.
Attention turns to rate risk in the week ahead. July consumer price index figures are due on Wednesday, producer prices on Thursday, and retail sales data on Friday. Reuters poll of economists forecasts headline CPI at 3.4% and core inflation at 2.5%.
Risks: Elevated inflation has the potential to drive yields higher and weigh on SoFi’s valuation. Softer labor market conditions could dampen borrowing demand or increase credit risk. The Technology Platform’s limited strength makes growth more reliant on lending and leveraging the balance sheet.
The share surge has given SoFi additional leeway, but not assurance. Achieving management’s reiterated objectives now depends on delivering the profit increase anticipated for the second half.
Related articles: NASDAQ:SOFI