
NEW YORK, August 10, 2026, 04:11 EDT — U.S. regular session finished, while premarket activity continued.
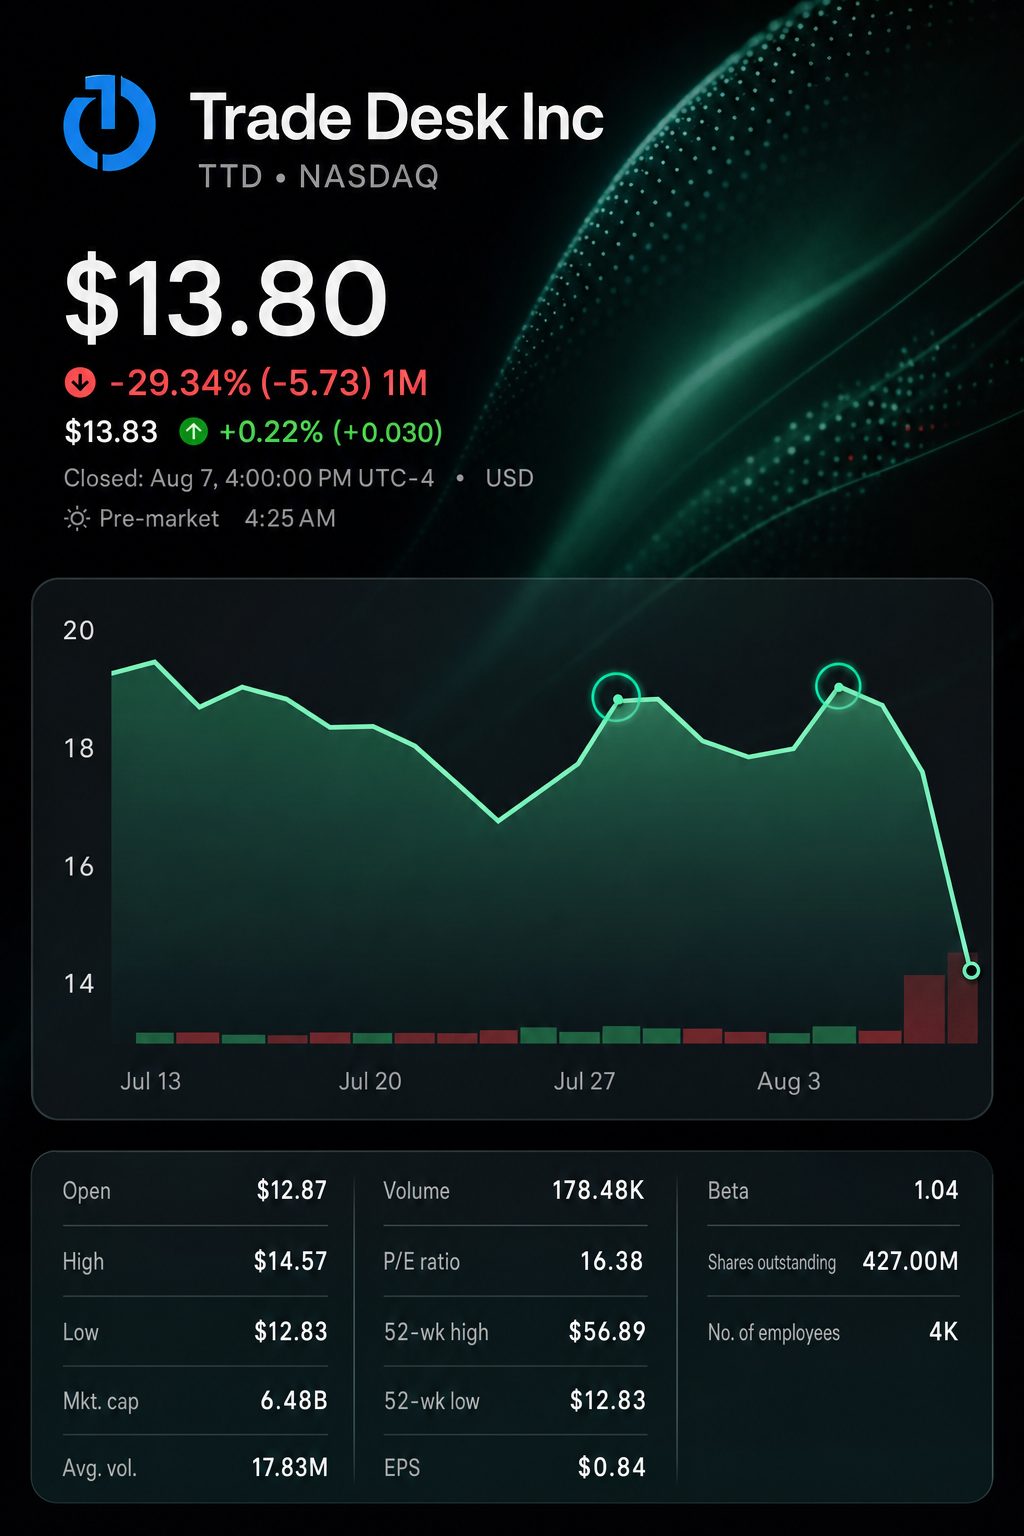
- The stock ended Friday at $13.80, a decline of 21.9%, with trading volume reaching six times the daily average.
- The Q3 revenue floor points to a 12.0% drop year-on-year and a 24.6% EBITDA margin, based on initial estimates provided in company guidance.
The Trade Desk, Inc. NASDAQ:TTD moved into Monday’s premarket session following a 21.9% drop on Friday. The company forecasted third-quarter revenue of no less than $650 million, setting a minimum that signals a 12% decline year-over-year.
Guidance is increasingly important after the earnings shortfall. The $650 million baseline is 19.4% under previous analyst expectations. Revenue for the second quarter came in 5.0% below the consensus forecast.
The margin reset is more pronounced. Adjusted EBITDA guidance at the revenue floor now signals a 24.6% margin, down from 43% in the previous year.
Customer retention remained above 95%, making it unlikely that widespread customer departures are behind the results. With competitors reporting stronger growth, possible reasons include reduced client spending, increased pricing pressure or a decline in wallet share. This analysis is based on disclosed data.
The pace of change in the company’s economics is evident in its quarterly trajectory. Below are the company’s results and initial guidance estimates.
| Period | Revenue | Year-on-year growth | Adjusted EBITDA | EBITDA margin |
|---|---|---|---|---|
| Q3 2025 actual | $739 million | 18% | $317 million | 43% |
| Q1 2026 actual | $689 million | 12% | $206 million | 30% |
| Q2 2026 actual | $715 million | 3% | $241 million | 34% |
| Q3 2026 forecast | No less than $650 million | Roughly -12% | Approximately $160 million | Roughly 24.6% |
*Indicative figures derived from the lower end of guidance alongside Q3 2025 actual results.
A sector comparison casts doubt on an explanation based solely on macro factors. Magnite, Inc. (NASDAQ:MGNI) and PubMatic, Inc. NASDAQ:PUBM both reported 11% growth in second-quarter revenue. Magnite saw a 36% increase in connected-TV contribution.
The peer numbers are not entirely comparable due to variations in business models. However, both firms posted higher growth rates and more robust profit performance.
| Company | Q2 revenue | Revenue growth | Adjusted EBITDA | Margin | Latest signal |
|---|---|---|---|---|---|
| The Trade Desk | $715 million | 3% | $241 million | 34% | Q3 revenue guidance at minimum $650 million |
| Magnite | $192.8 million | 11% | $70.6 million | 37%¹ | 2026 ex-TAC growth target increased to 13%-14% |
| PubMatic | $78.6 million | 11% | $19.6 million | 25% | Achieved return to double-digit revenue growth |
¹Magnite determines its margin based on contribution, not including traffic-acquisition costs.
Chief Executive Jeff Green admitted the company missed expectations. “This quarter did not meet the standard we set for ourselves,” he said. Green further committed to improved execution and announced plans for a platform upgrade. The Trade Desk
Analysts responded promptly. Raymond James Financial, Inc. NYSE:RJF downgraded TTD to Underperform. Truist Financial Corporation NYSE:TFC changed its rating to Hold, and Susquehanna adjusted to Neutral.
The distribution of recommendations shifted significantly. The number of Hold ratings climbed to 29, and Buy ratings dropped to six.
| Analyst recommendation | Three months ago | One month ago | Current |
|---|---|---|---|
| Buy | 14 | 14 | 6 |
| Overweight | 1 | 2 | 1 |
| Hold | 23 | 23 | 29 |
| Underweight | 2 | 1 | 1 |
| Sell | 3 | 3 | 6 |
| Consensus | Hold | Overweight | Hold |
The present median price target stands at $14, implying a 1.4% potential gain from Friday’s closing level. Targets for the stock span a low of $9 to a high of $30.
TTD declined 24.6% over the prior week. The S&P 500 increased 3.58%, and the Nasdaq advanced 5.19%. On Friday, TTD was the poorest-performing S&P 500 constituent.
Volume surged to 133.3 million shares, roughly six times higher than its 65-day daily average, amid uncommonly active trading. The stock fell to a new 52-week low of $12.83.
One avenue of backing persists. As of June 30, the company still had $269 million authorised for buybacks. This represents about 4.1% of the firm’s market capitalisation as of Friday, according to an initial estimate.
Economic data will provide the next test. July consumer price figures are set for release on Wednesday, with producer prices to follow on Thursday and retail sales on Friday. All three reports are scheduled for 8:30 a.m. EDT.
Risks: Revenue may fall short of forecasts if there is a sharper drop in brand spending, additional price reductions, or new execution issues. Conversely, improved operational performance, increased client expenditure, or larger-than-expected buybacks could lead to a rapid upside in the trade.
Related articles: NASDAQ:TTD