
NEW YORK, August 3, 2026, 05:08 EDT
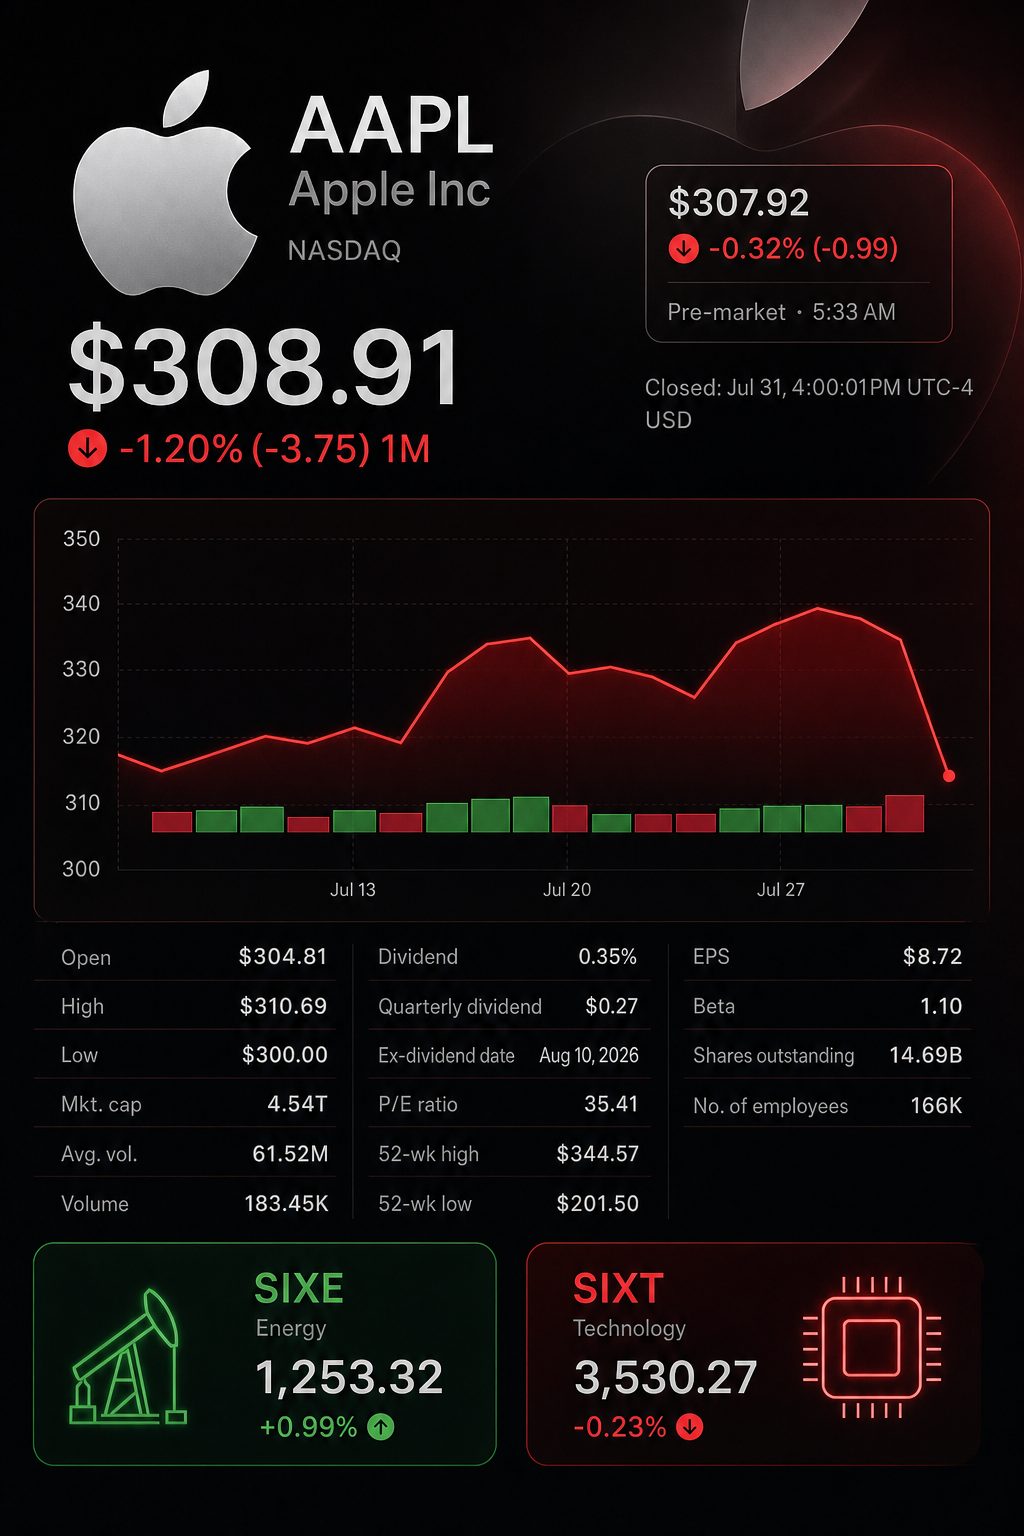
- Apple hovered close to $308 in premarket trade, after finishing Friday at $308.91, marking a 7.35% fall.
- Initial estimate: The Services shortfall implied a gross profit impact of $364 million, which was 2.3 times larger than the estimated boost from the iPhone beat.
- Earnings came in at $2.02 per share, with $0.11 coming from tariff refunds. Earnings, excluding refunds, were approximately $1.91, compared to the forecast of $1.89.
Apple Inc. NASDAQ:AAPL slipped 0.3% prior to Monday’s market open. U.S. regular trading stayed shut. On Friday, 132.5 million shares were traded in a selloff.
The drop was driven by more than just a conservative outlook. The core problem was earnings composition. High-margin Services underperformed as lower-margin iPhone sales outpaced expectations.
Services accounted for 28.1% of sales but contributed 42.4% of total gross profit, making each lost Services dollar particularly costly.
The quarter surpassed total revenue forecasts. Robust hardware sales offset shortfalls in Services, iPad, and Greater China. Results reflect SEC disclosures alongside analyst projections reported by Reuters.
| June-quarter metric | Actual | Estimate | Beat/(miss) |
|---|---|---|---|
| Total revenue | $109.42B | $108.65B | $0.77B |
| iPhone revenue | $54.25B | $53.86B | $0.39B |
| Mac revenue | $10.35B | $8.74B | $1.61B |
| iPad revenue | $6.19B | $6.92B | $(0.73)B |
| Services revenue | $30.74B | $31.22B | $(0.48)B |
| Greater China revenue | $18.82B | $19.67B | $(0.85)B |
iPhone sales increased by 21.7%, and Mac revenue climbed 28.7%. The services segment grew 12.1%, but was $481 million below expectations. D.A. Davidson analyst Gil Luria noted that “services growth was slowing.” Reuters
Apple’s reported margins highlight the impact of the miss. Services posted a gross margin of 75.6%, while products achieved 40.1%.
| June-quarter economics | Products | Services |
|---|---|---|
| Revenue | $78.68B | $30.74B |
| Share of revenue | 71.9% | 28.1% |
| Gross-margin rate | 40.1% | 75.6% |
| Gross profit | $31.53B | $23.25B |
| Share of gross profit | 57.6% | 42.4% |
An initial estimate uses Apple’s overall Products margin to calculate the iPhone difference, and the Services margin for the Services segment difference. Apple does not reveal margins specific to iPhones.
| Preliminary gross profit bridge | Revenue difference | Margin indicator | Estimated impact |
|---|---|---|---|
| iPhone outperformed | $0.392B | 40.1% | $0.157B |
| Services underperformed | $(0.481)B | 75.6% | $(0.364)B |
| Total impact | — | — | $(0.206)B |
The bridge results in a $157 million gain for iPhone. Services account for a $364 million negative impact. The overall effect is negative $206 million. The figure is an estimate and does not represent company guidance.
Reported earnings were further boosted by tariff refunds. Earnings surpassed consensus by $0.13 per share, with refunds accounting for $0.11 of that—or about 85% of the beat. Without the refunds, earnings were just 1.1% higher than consensus.
Gross margin followed a similar trend. The reported figure surpassed consensus expectations by 218 basis points. When excluding refunds, the margin advantage decreased to 18 basis points.
Guidance subsequently adjusted the pace of growth. Apple projected revenue for the September quarter to climb between 9% and 11%. Analysts on Wall Street had anticipated nearly 12%, and Apple provided margin guidance in the range of 47% to 48%.
Chief Executive Tim Cook described supply constraints as “very significant.” Apple notified regulators that these challenges and component expenses could increase. The company’s filing mentioned advanced semiconductors, NAND storage, and DRAM memory. Reuters
Despite Friday’s decline, investors continued to pay a premium. The comparison below is based on the most recent regular-session prices and trailing earnings multiples.
| Company | Price | Market value | Trailing P/E |
|---|---|---|---|
| Apple Inc. NASDAQ:AAPL | $308.91 | $4.55T | 35.5x |
| NVIDIA Corporation NASDAQ:NVDA | $200.75 | $4.90T | 30.6x |
| Microsoft Corporation NASDAQ:MSFT | $464.72 | $3.46T | 27.7x |
| Alphabet Inc. NASDAQ:GOOGL | $356.13 | $4.36T | 17.9x |
| Amazon.com Inc. NASDAQ:AMZN | $271.58 | $2.96T | 21.8x |
Apple’s multiple was 16% higher than NVIDIA’s and 28% higher than Microsoft’s. It was almost twice that of Alphabet. This premium increases the pressure on Services to deliver results.
Apple shares dropped 7.2% between July 24 and Friday. Trading volume on Friday reached 2.33 times the stock’s 65-day average. Meanwhile, the S&P 500 climbed 0.7% on the same day, highlighting a repricing specific to Apple.
Analysts will focus on estimate revisions in the coming week. On Friday, four brokerages trimmed their price targets and three increased them. The median target of $330 indicates a potential 6.8% gain from Friday’s close. Apple’s dividend record date is August 10, and the payment will be made on August 13.
Risks: Limited supply may restrict shipments and drive up memory prices. Increased prices have the potential to dampen demand. App Store modifications could impact growth in high-margin Services.
Apple faces an immediate challenge: hardware sales need to remain robust, while services must continue to warrant their higher price.
Related articles: NASDAQ:AAPL