Marvell Shares Drop 10.3% Amidst Scrutiny Over AI Revenue Margins
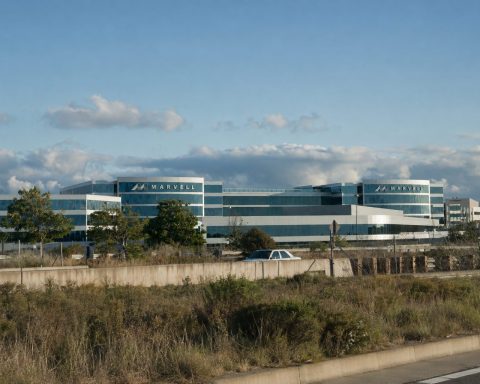
Marvell Technology fell 10.3% on Friday, wiping out approximately $22 billion in market value, after reporting its highest ever quarterly revenue.
PayPal Holdings fell $7.81 on Friday, wiping out the takeover premium linked to speculation about a $53 billion offer.
−12.71% · −$7.81
Aug. 28 session
12.7% above close
Industry median ≈15×
Non-GAAP EPS
Close / guide ≈ 10.0×
Q2 repurchases · ≈33M shares
TTM buybacks: $6.0B
47 ratings
34 Hold · 8 positive · 5 negative
Average $56.16
Only 4.7% above close
Investor bridge: the 12.7% selloff removed roughly the same premium that the abandoned $60.50 bid would now offer. Standalone support depends on converting 10% payment-volume growth into margin recovery.
| Measure | Q2 | Q3 guide |
|---|---|---|
| Revenue | $2.739B | $3.150B ±5% |
| Non-GAAP GM | 58.9% | 58.0% midpoint |
| Non-GAAP EPS | $0.94 | $1.10 ±$0.05 |
The growth guide is strong. The 90-basis-point gross-margin step-down and Google revenue timing pushed attention toward execution.
| Metric | MRVL | Reference |
|---|---|---|
| Forward P/E | 58.4× | Broadcom 32.2× |
| Median target | $295 | +36.2% vs close |
| Ratings | 37 Buy/OW | 6 Hold · 0 Sell |
| FY28 revenue target | $18B | 6.6× Q2 run-rate quarter |
| Cash | $3.933B |
| Quarterly operating cash flow | $605.5M |
| Stock-based compensation | $326.2M |
| Q2 GAAP net income | $308.0M |
Google-linked revenue becomes more meaningful in fiscal 2029. Investor Day: Oct. 6, 2026.
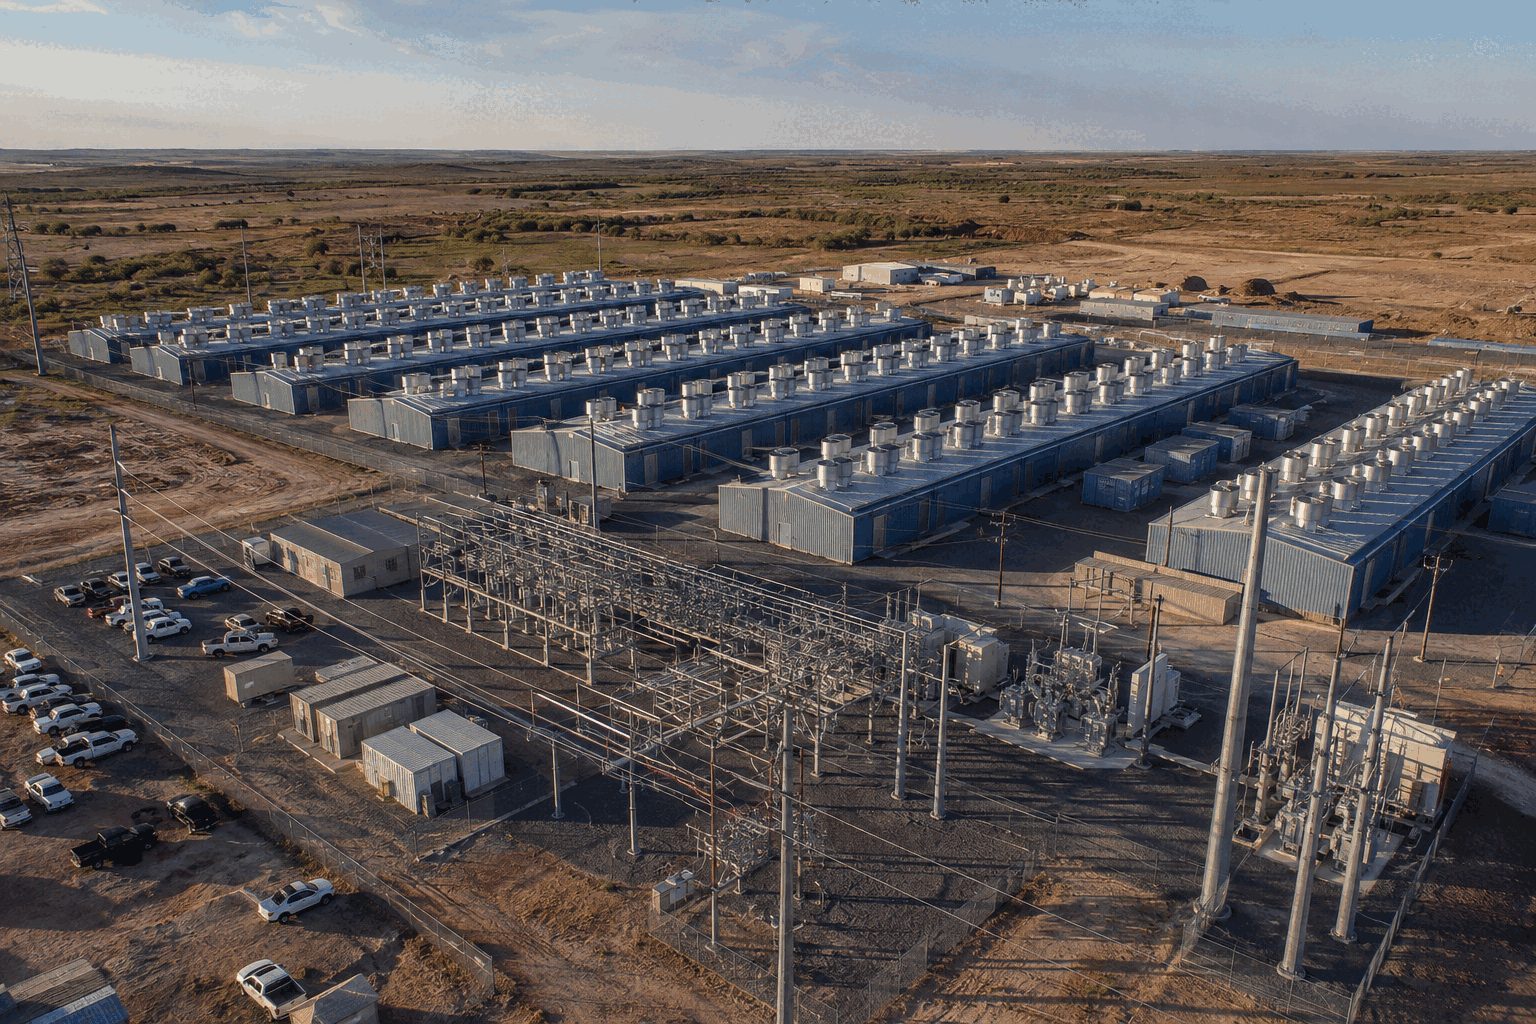
AI Cloud became 51.4% of quarterly revenue. Source: IREN FY26 results, Aug. 27.
Adjusted EBITDA fell 68%; margin contracted to 14.0% from 41.1%.
| Metric | Value | Multiple |
|---|---|---|
| Closing market value | $12.67B | — |
| FY26 GAAP revenue | $707M | 17.9× |
| Operating ARR, Aug. 26 | $1.0B | 12.7× |
| Contracted 2026 ARR | $4.0B | 3.2× |
ARR is non-GAAP and assumes contracted GPUs operate 8,760 hours; recognized revenue may be lower.
| Company | Price | Day |
|---|---|---|
| IREN | $35.45 | −12.6% |
| CoreWeave | $84.23 | −2.9% |
| Nebius | $209.18 | −4.3% |
IREN underperformed both neocloud peers by more than eight percentage points.
| FY26 | Value | YoY |
|---|---|---|
| Total revenue | $707.0M | +41% |
| AI Cloud revenue | $128.8M | +685% |
| Adjusted EBITDA | $245.7M | −9% |
| Net result | −$702.6M | vs +$86.9M |
Net loss included $638.8M of non-cash impairments.
H.C. Wainwright: Buy, $90 target, reiterated Aug. 28.
B. Riley: commercial and financing path validated; execution now moves to commissioning.
Visible Alpha quarterly adjusted-EBITDA consensus was $57.1M versus $19.2M reported.
Horizon 2 commissioning; Horizon 3–4 target Q4 2026.
$1B operating ARR must approach $4B contracted ARR.
$14B of cash, committed financing and prepayments supports rollout.
Delays, customer concentration, GPU pricing, debt and obsolescence.
BMNR selloff versus marked Ethereum assets
ETH marked at $2,438; other assets use August 23 company disclosures. Market cap uses 603.23M shares and Friday's close.
| ETH held | 5.848M |
| ETH staked | 5.067M |
| Share staked | 86.7% |
| 7-day yield | 2.67% |
| Annualized revenue | $330M |
| Measure | Current | Change / sensitivity |
|---|---|---|
| BMNR | $23.80 | −7.14% |
| Ether | ≈$2,438 | ≈−3.0% / 24h |
| Value impact of 1% ETH move | — | ≈$143M |
| Quarterly common-holder loss | May 2026 | −$83.6M |
| Stockholders' equity | May 2026 | $11.60B |
| Item | Status | Investor use |
|---|---|---|
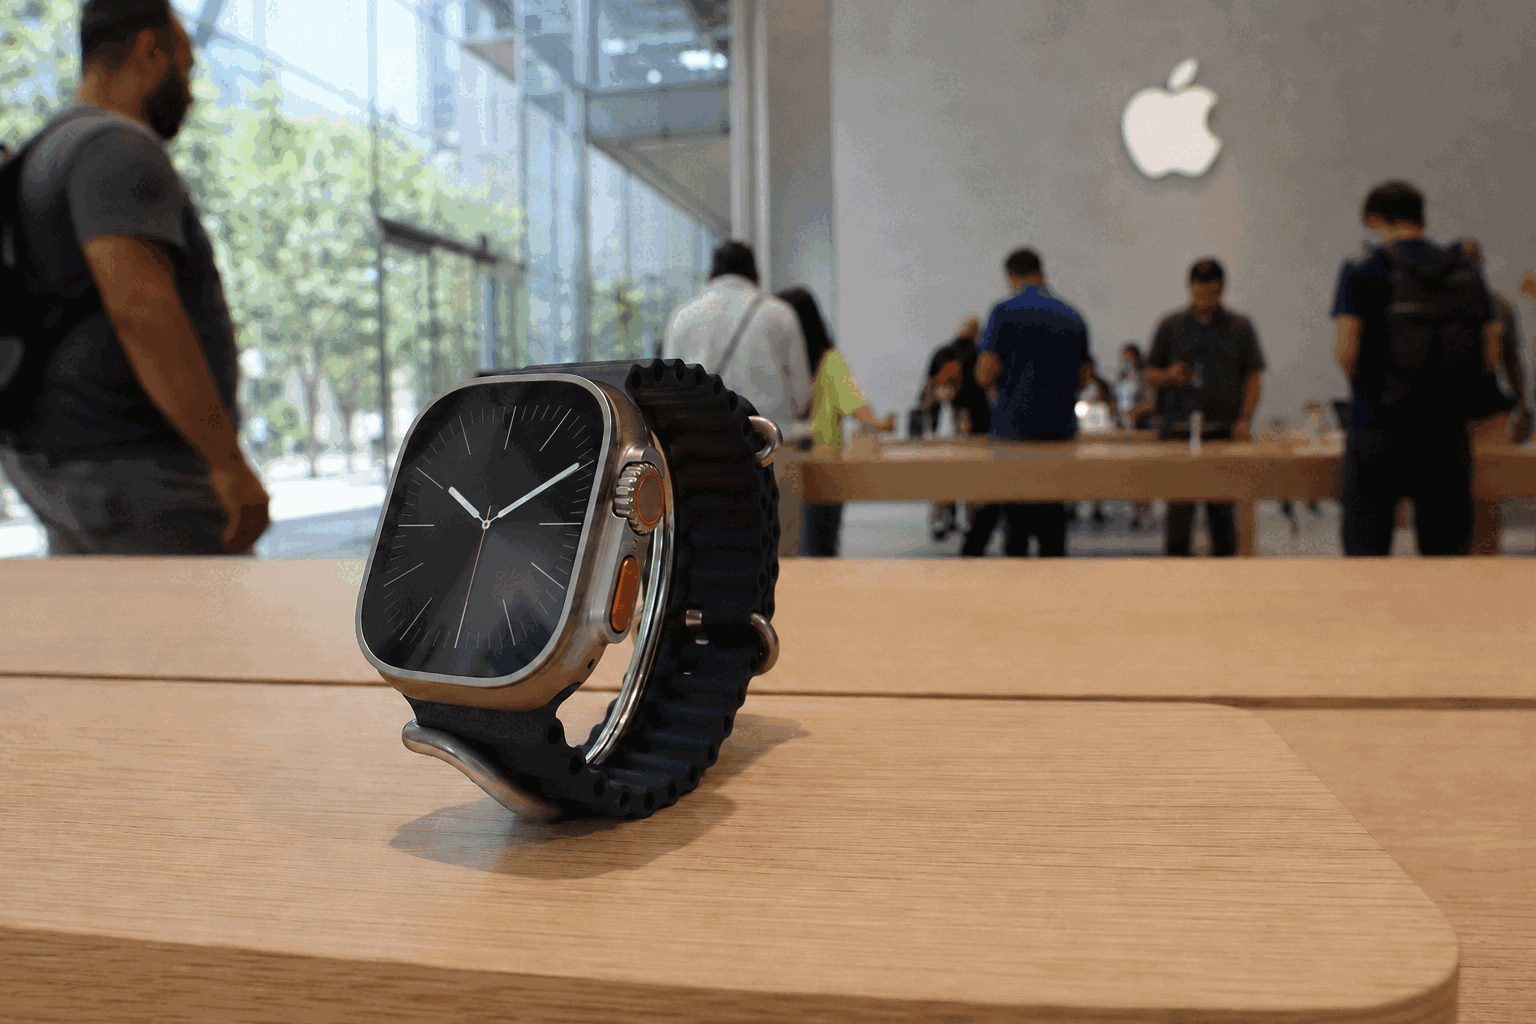
| Apple event | Confirmed | Launch catalyst |
| “Apple Watch Ultra 4” | Not announced | Search term only |
| Current Ultra 3 | $799; 42 hours | Price and battery benchmark |
| Ultra revenue | Not disclosed | Tracked inside $7.88B category |
| Upside | Premium price holds and new health or connectivity features widen upgrade demand. |
| Middle | Incremental update sustains category growth near the latest 6.5% rate. |
| Downside | Limited differentiation shifts buyers to cheaper Watch models or delays upgrades. |
| Metric | FY2026 | Reference |
|---|---|---|
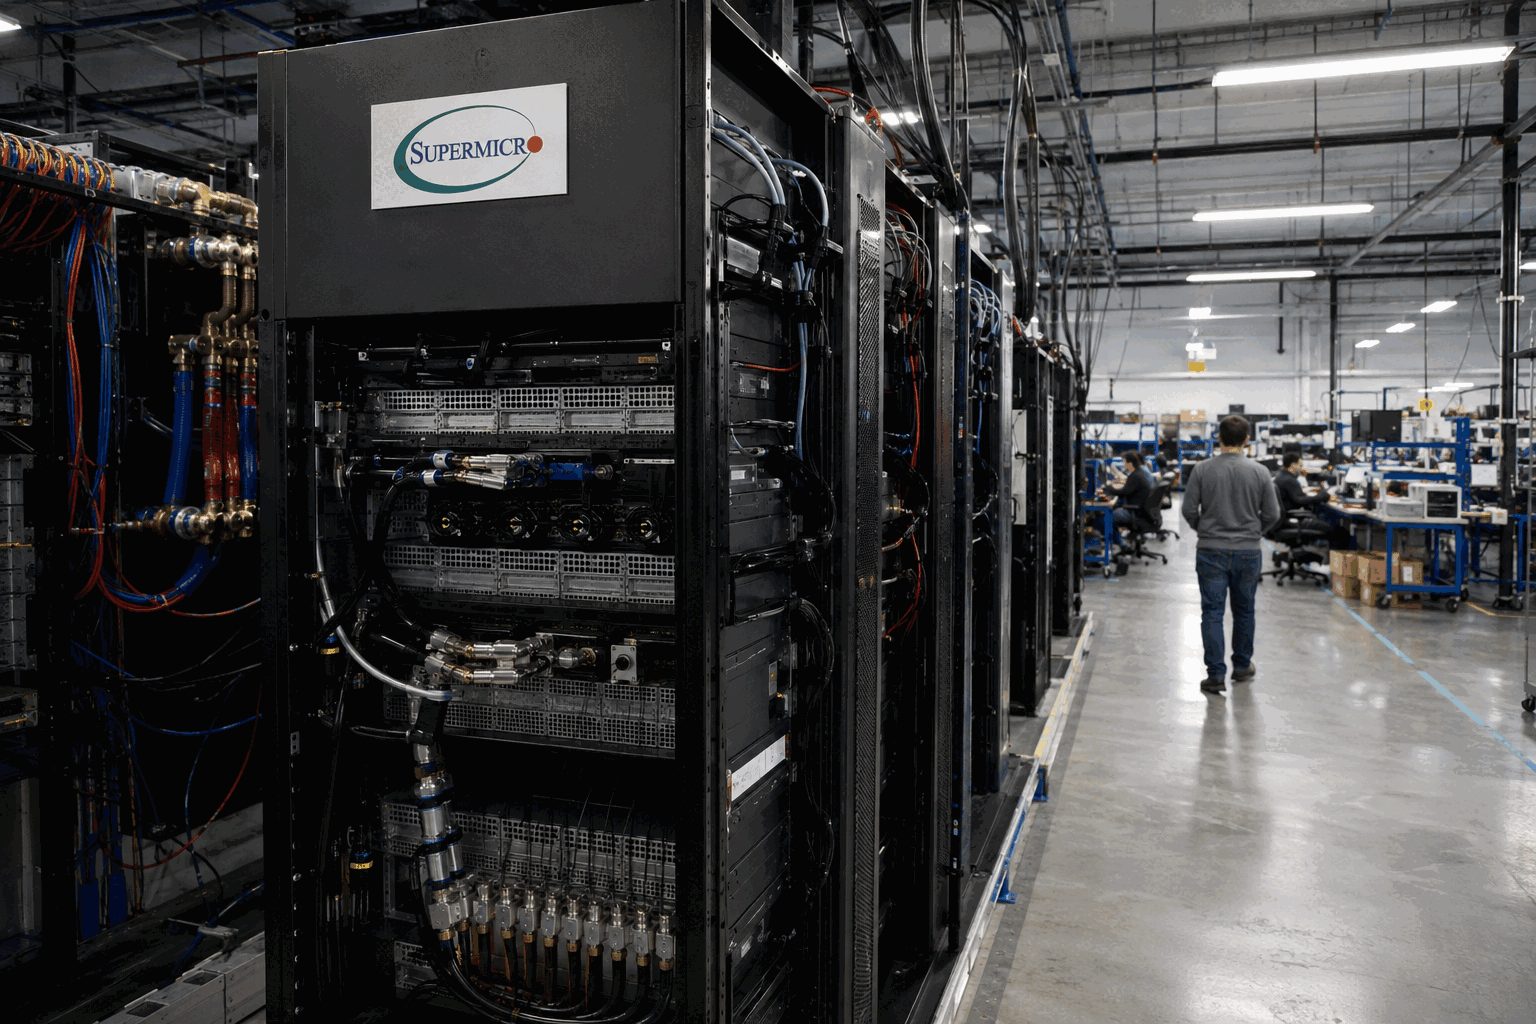
| Revenue | $39.1B | +78% YoY |
| Gross margin | 10.8% | 11.1% prior year |
| Net income | $2.2B | $1.0B prior year |
| Diluted EPS | $3.26 | $1.68 prior year |
| Positive | Quarterly revenue approaches $15B while gross margin holds above the 10.8% full-year level. |
| Neutral | Revenue scales, but mix pulls margin back toward the fiscal-year average. |
| Negative | Customer timing or power and cooling constraints delay rack acceptance. |
| Metric | Q2 2026 | Change |
|---|---|---|
| Revenue | $30.4M | -50% |
| Operating result | -$141M | From +$11M |
| Adjusted EBITDA | -$23.7M | From +$6.6M |
| Continuing loss | -$64M | -$0.11/share |
| Milestone | Current state | Signal |
|---|---|---|
| Commercial demand | Negotiations at three sites | Signed lease needed |
| Washington HPC | 18 MW conversion | No HPC revenue yet |
| Funding | $458M convertibles | 1.25%, due 2032 |
| Legacy exit | Mining decommissioned at key sites | Near-term revenue gap |
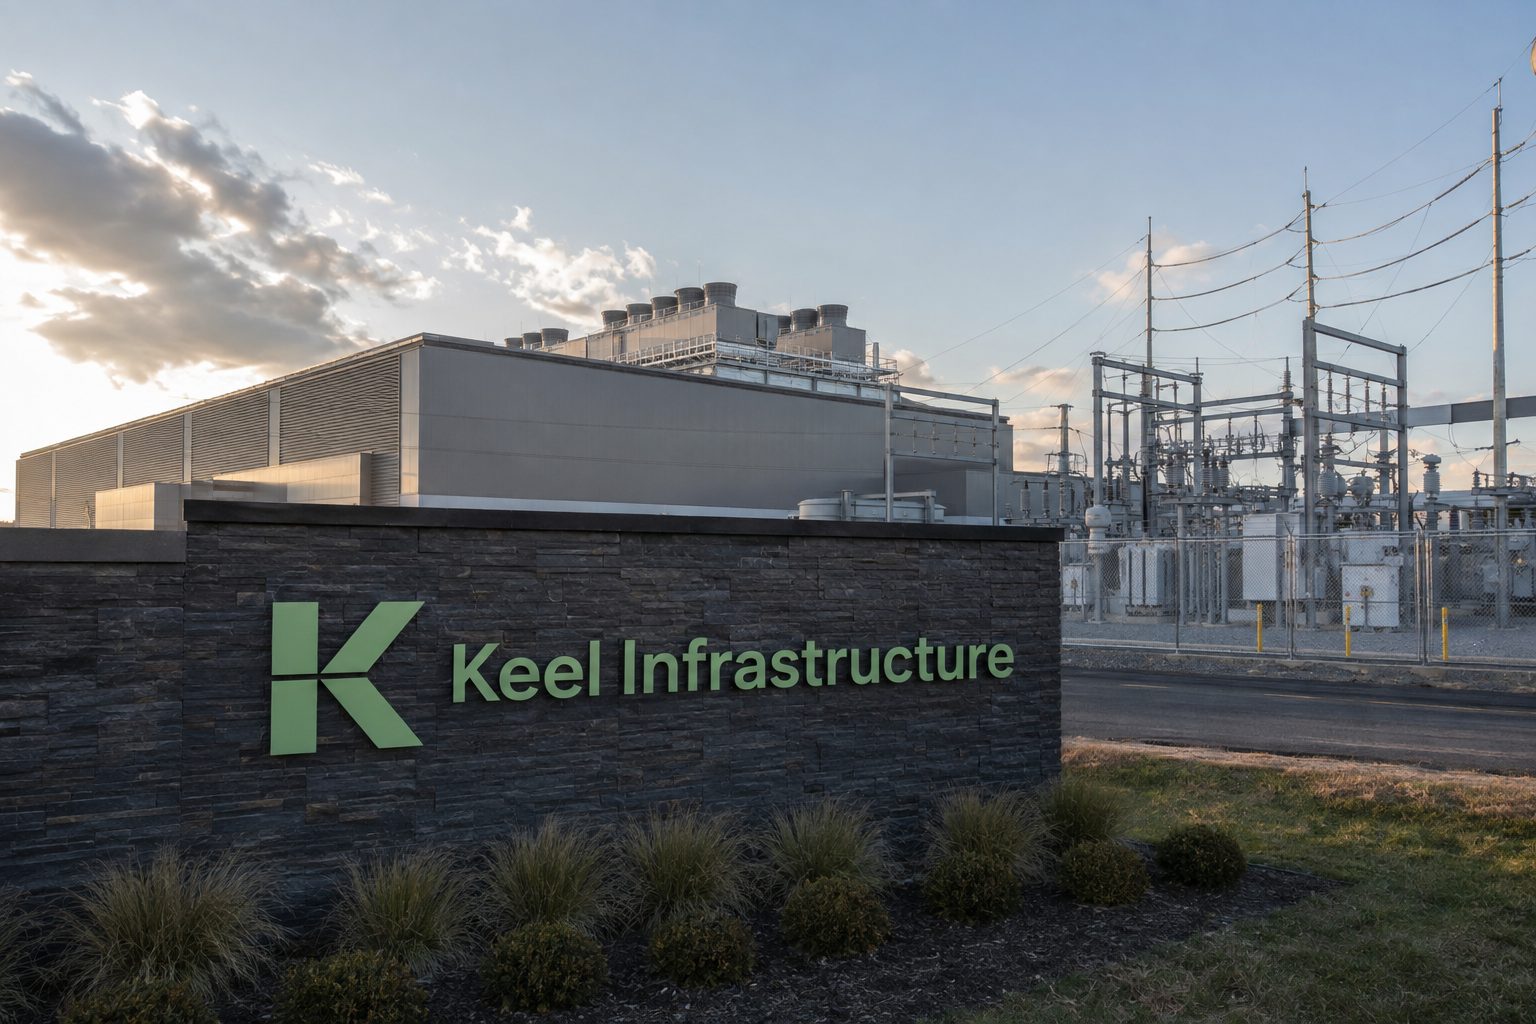
The valuation case depends on converting powered land into long-duration AI leases before liquidity is consumed. Each 100 MW of signed capacity would materially improve visibility, but economics remain undisclosed.

41 fewer problems per 100 vehicles year over year.
~300 veteran engineers added to weekly design reviews.
AI inspection supports plant-floor anomaly detection.
| Business | Q2 2026 EBIT | Investor read |
|---|---|---|
| Ford Pro | +$1.7B | Commercial profit anchor |
| Ford Blue | +$1.1B | Primary warranty leverage |
| Model e | −$919M | Still absorbs core savings |
| Total adjusted | +$2.5B | Up 17% year over year |
| Ford | −0.54% |
| GM | +0.09% |
| Stellantis | +2.56% |
The market did not award Ford a quality premium Friday.

Sep. 15, 2025
Trump files $15B defamation action.
Sep. 19, 2025
Judge strikes 85-page complaint under Rule 8.
July 27, 2026
Dismissal motion deferred; revision allowed.
Aug. 27, 2026
Court-set amendment deadline.
| Metric | Value | YoY |
|---|---|---|
| Revenue | $762.5M | +11.2% |
| Operating profit | $118.0M | +10.8% |
| Digital subscription revenue | $407.9M | +16.4% |
| Digital ad revenue | $114.0M | +20.7% |
| Signal | Market response | Reading |
|---|---|---|
| Q2 subscriber miss · Aug. 5 | Stock −13% | Growth expectations materially repriced |
| Lawsuit trend · Aug. 28 | Stock +0.10% | No visible litigation repricing |
| Friday volume | 995,063 shares | Ordinary trading, not a stress signal |
The $15 billion figure is a plaintiff’s demand. Court rulings, amended pleadings, dismissal arguments, discovery costs and settlement decisions can change exposure. Search interest alone does not establish a new liability.
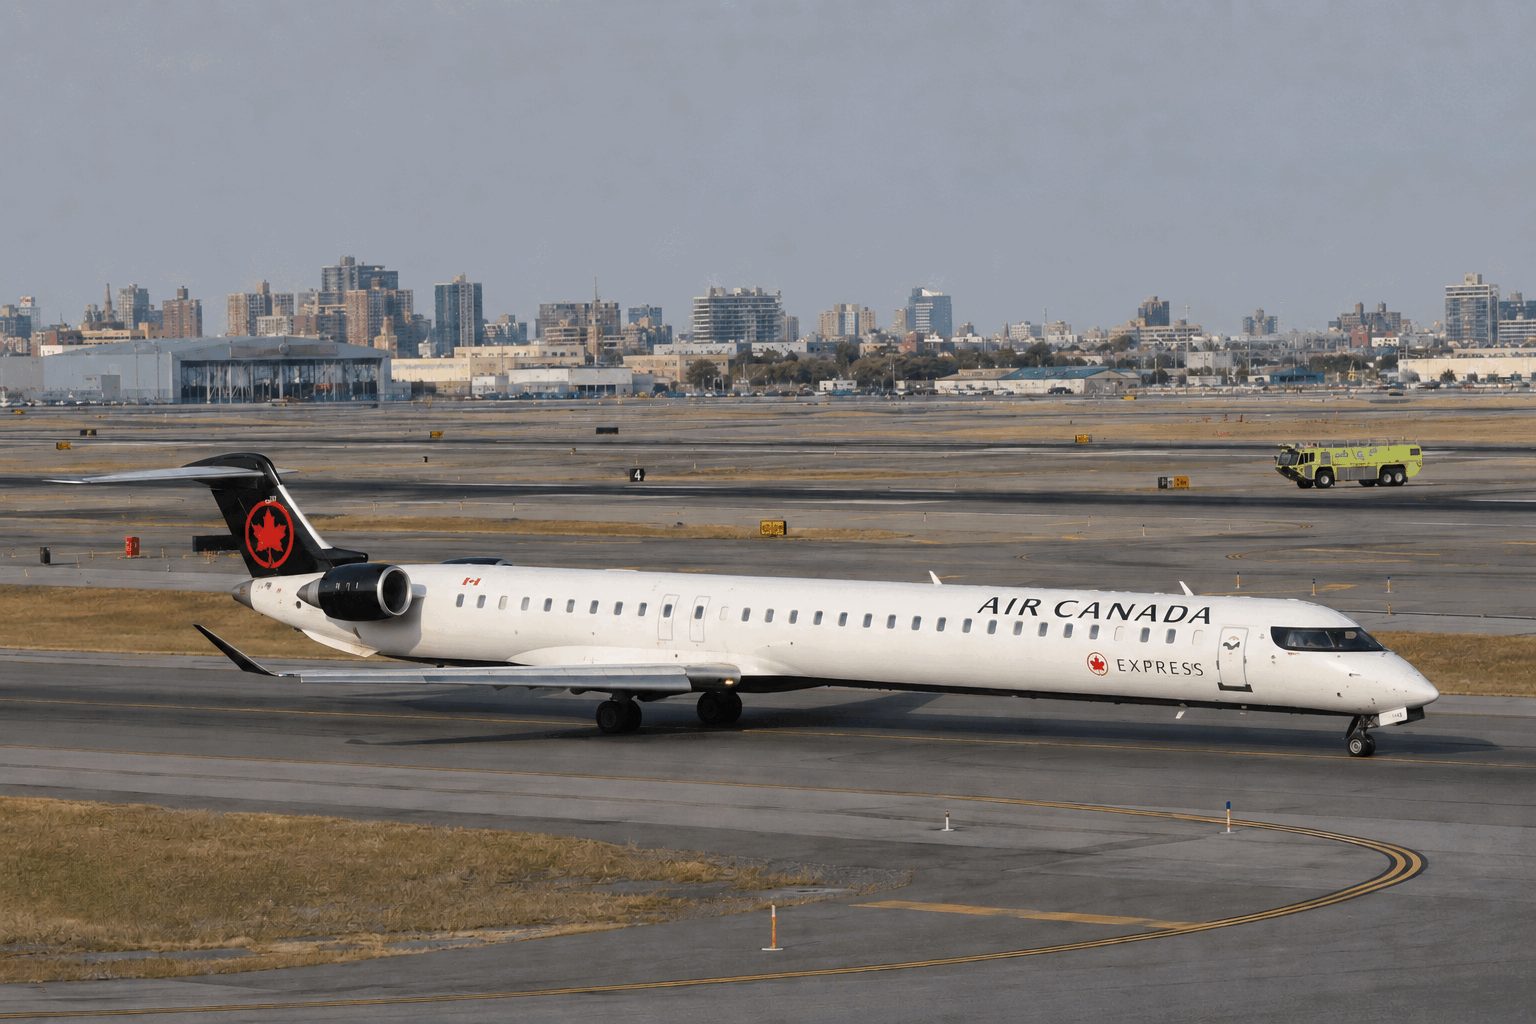
The FAA moved to dismiss two controllers who allegedly left LaGuardia early before the March 22 Air Canada Express collision.
The action targets controllers. The NTSB has not assigned final cause, limiting any direct attribution to Air Canada.
| Q2 2026 | Value |
|---|---|
| Revenue | C$6.266B |
| Operating loss | C$215M |
| Operating margin | −3.4% |
| Adjusted EBITDA | C$719M |
| Adjusted EBITDA margin | 11.5% |
| Signal | Verified fact | Investor reading |
|---|---|---|
| LaGuardia load | 70 flights handled in 97 minutes vs 31 scheduled | Staffing and system-resilience question |
| Accident impact | 2 pilots killed; 6 serious injuries; 39 hospitalized | Legal, insurance and brand exposure |
| Transborder franchise | 50 U.S. airports; up to 382 daily flights | Material route network under scrutiny |
| Valuation cross-check | Aeroplan implied value: C$10B | Above Air Canada’s C$7.77B equity value |
Final NTSB findings are pending. A controller-focused action may not translate into airline liability. Fuel costs, the reduced EBITDA range and weak operating margin remain more direct earnings variables.
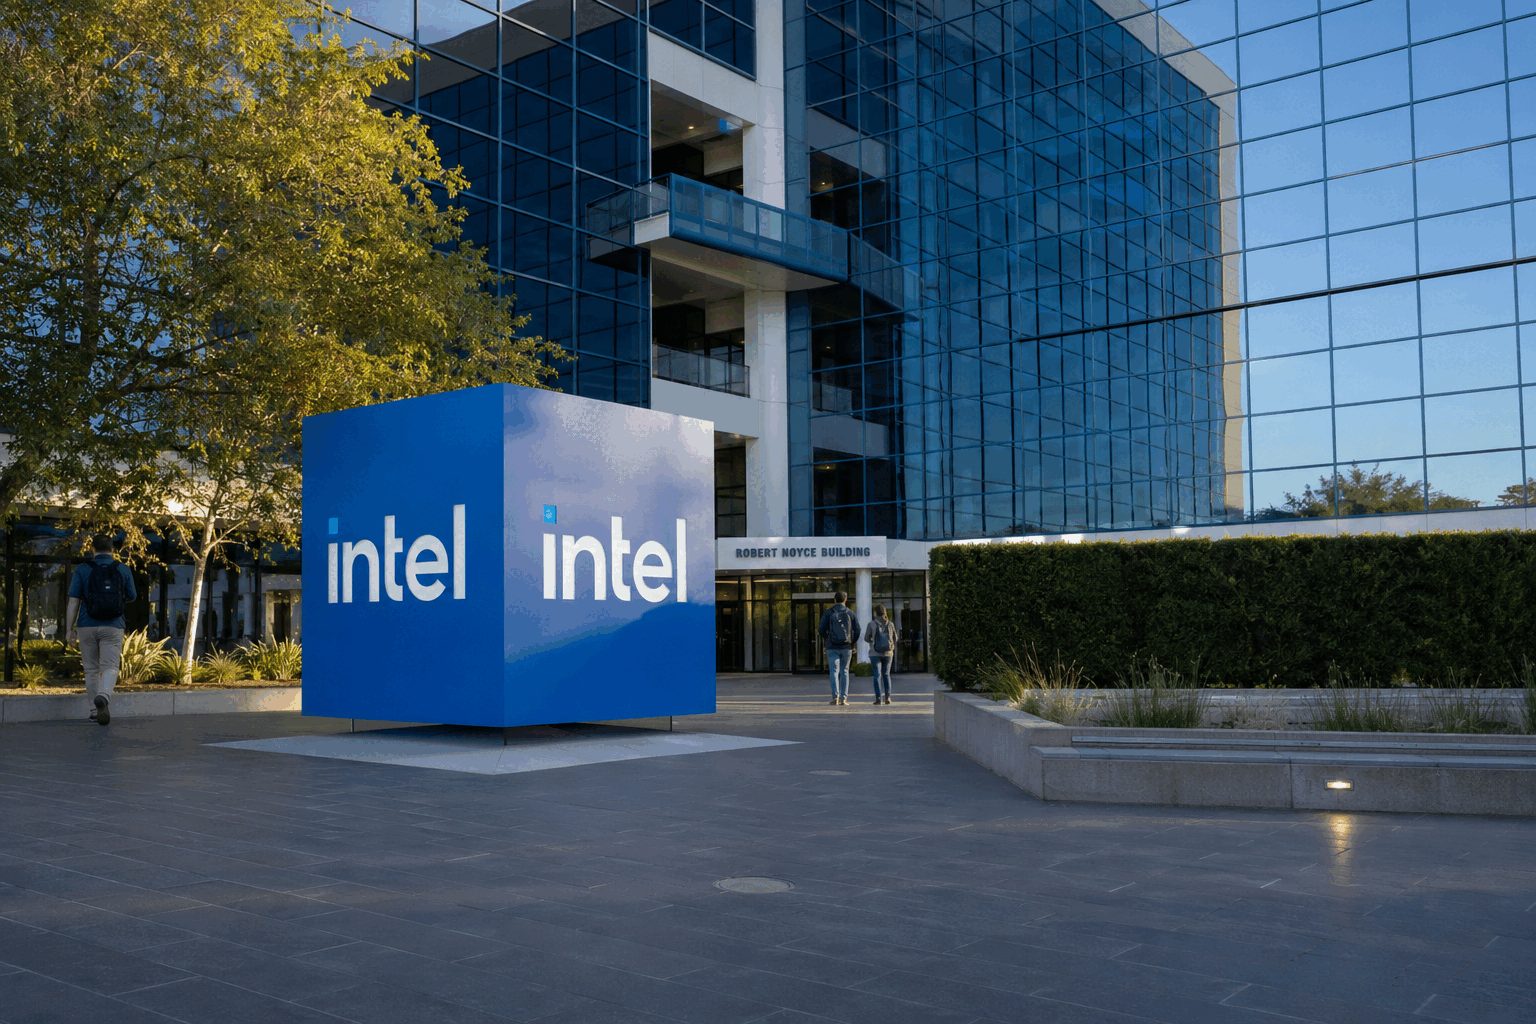
| Company | Close move | Market signal |
|---|---|---|
| Marvell | −10.39% | Google-deal economics |
| Nvidia | −4.59% | Margin reset |
| Intel | −2.83% | Funding/foundry test |
| AMD | −2.34% | Sector repricing |
| Consensus | Hold |
| Ratings | 5 Buy · 24 Hold · 2 Sell |
| Average target | $116.84 |
| Implied upside | +30.6% |
| Target range | $80–$200 |
Sources: market data at Aug. 28 close; Intel Newsroom; Reuters; analyst consensus updated Aug. 28, 2026.
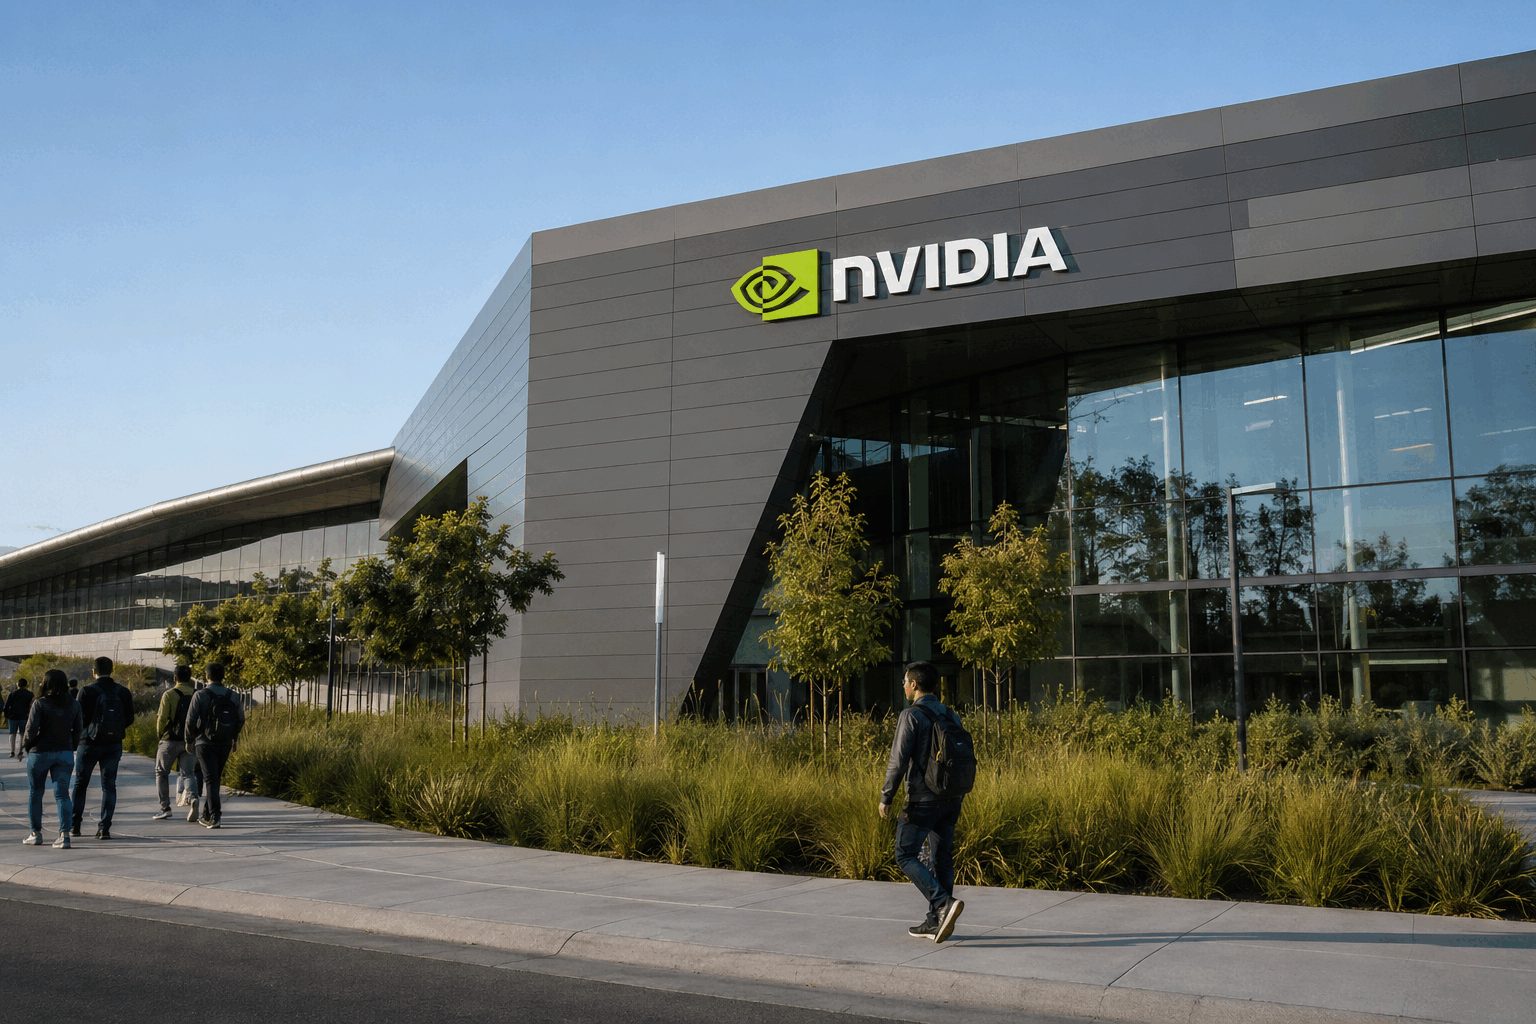
| Metric | Q1 FY27 | Q2 FY27 | Q3 guide |
|---|---|---|---|
| Revenue | $81.6B | $96.2B | $108.0B ±2% |
| Seq. growth | 20.0% | 17.9% | 12.2% |
| Gross margin | 74.9% | 75.0% | 74.0% ±0.5 pt |
| Data center | $75.2B | $89.0B | Not guided |
| Consensus | Buy |
| Ratings mix | 57 Buy · 7 Overweight · 2 Hold · 1 Sell |
| Median target | $316.60 · 45.5% above close |
| Q2 capital returned | $26.0B |
| Remaining repurchase authority | $99.0B |
Sources: NVIDIA Q2 FY2027 release; Reuters, Aug. 27–28, 2026; FactSet via WSJ/MarketWatch. Market figures are time-sensitive and stated as of the timestamps above.

PagerDuty's rally reflects confidence in cost discipline. The next test is whether a leaner organization can lift retention without weakening product delivery.
| Current headcount reduction | ≈15% |
| Estimated charges | $5.5m–$7.5m |
| Most charges expected | Q3 FY27 |
| Substantially complete | By Q4 FY27 end |
| Cash and investments | $470.0m |
At the midpoint, restructuring charges equal about 20% of quarterly free cash flow.
| Metric | Latest |
|---|---|
| GAAP operating income | $10.2m |
| Non-GAAP operating income | $29.5m |
| GAAP net income | $4.7m |
| Paid customers | 15,506 |
| Customers above $100k ARR | 884 |
| Q3 revenue midpoint | $124.0m |
Sources: PagerDuty Q2 FY2027 results; Form 8-K; Canaccord action; market figures timestamped above.

Callaway cut the co-brand relationship as its equipment franchise expands.
| Category | Sales | Growth | Share of Q2 sales |
|---|---|---|---|
| Golf clubs | $316.5M | +1.2% | 51.7% |
| Golf balls | $113.8M | +14.8% | 18.6% |
| Apparel | $105.2M | +0.9% | 17.2% |
| Gear and other | $76.7M | −9.0% | 12.5% |
Raised after Q2
| Q2 2026 | Value | Year-over-year |
|---|---|---|
| Total revenue | $612.2M | +2.0% |
| Golf Equipment revenue | $430.3M | +4.5% |
| Golf Equipment operating income | $100.3M | +31.6% |
| Adjusted EBITDA | $124.9M | +35.8% |
| U.S. revenue | $414.7M | +3.4% |
+28.7% from $15.83
| High | $23.00 |
| Low | $19.00 |
| Ratings | 4 Buy · 5 Hold · 0 Sell |
The event is measurable but not yet material to guidance. Callaway disclosed no lost sales or termination cost beyond the donation. Brand protection can preserve long-term demand, while litigation, additional retailer action or weaker access to younger golfers could offset that benefit.
Sources: Callaway Aug. 4 financial results; Reuters and AP Aug. 27–28 reports; Google Finance. Price and market value are U.S. quotes at 12:05 EDT on Aug. 28, 2026.
A $3.1B pullback leaves most of the earnings rerating intact.
Friday retraced about 29% of Thursday’s estimated $10.6B market-value gain.
| Measure | Latest | Signal |
|---|---|---|
| Q3 revenue | $2.477B | +42% YoY |
| GAAP net income | $545.8M | +125% YoY |
| Non-GAAP EPS | $3.91 | Above guide |
| FY revenue midpoint | $9.715B | Raised |
| Operating cash-flow target | ≈$2.8B |
| Free cash-flow target | ≈$2.6B |
| FCF / revenue midpoint | 26.8% |
| Average analyst target | $544.97 |
| Target upside | ≈21% |
Ansys integration costs, slower EDA demand and weaker cash conversion could compress the earnings multiple. The gap between 41.5% non-GAAP and 10.4% GAAP operating-margin guidance remains large.
Q4: $2.530B–$2.580B revenue and $4.10–$4.16 non-GAAP EPS. Full year: $15.04–$15.10 non-GAAP EPS and approximately $2.6B free cash flow.
Sources: Synopsys fiscal Q3 release and financial supplement; market data at 11:33:12 EDT; analyst consensus accessed Aug. 28. Market-value changes are estimates derived from reported price moves and current capitalization. Not investment advice.

Reuters reported Nvidia paused some credit-support deals that exchanged financing help for cloud-revenue participation.
Nvidia said the broader compute-access model remains in place and continues to evolve.
| Metric | Value | Signal |
|---|---|---|
| Revenue | $1.93M | +412% YoY |
| Adjusted EBITDA | $0.59M | Positive |
| Net loss | −$430.4M | Mostly non-cash |
| Cash | $1.861B | Build-out buffer |
| Current note liabilities | $1.007B | Financing weight |
| Checkpoint | Why it matters |
|---|---|
| Financing terms | Determines deployment cost and equity dilution |
| GPU acceptance | Triggers capacity availability and revenue |
| Customer utilization | Turns reserved capacity into billed sales |
| Contract amendments | Tests whether Nvidia's pause reaches SharonAI |
| Cash burn | Measures runway during infrastructure ramp |
The stock move values implementation risk, not simply demand. SharonAI's SEC filing already says deployments need additional debt or equity financing and face phased acceptance tests.
Key question: can $8.8 billion of contracted value convert into revenue without costly new capital?

$150 million divided by $6.67. This is a scenario, not a forecast; the program does not require purchases.
| Metric | Reading | Change / signal |
|---|---|---|
| Net sales | $319.6M | −1.4% YoY |
| Adjusted EBITDA | $35.8M | −32.1% YoY |
| Core Aurora margin | 14.2% | 24.7% prior year |
| Free cash flow | −$74.7M | Cash use |
| FY EBITDA guidepost | $200M–$225M | Cut by $25M |
| Signal | Reading | Investor test |
|---|---|---|
| Expected year-end cash | $700M–$750M | No outstanding debt expected |
| Expected 2027 tax refund | $160M | Additional optionality |
| Analyst consensus | Hold · 4 ratings | Targets may need adjustment |
| Average target | $14.67 | Verify post-distribution basis |
| Premarket volume | 7,420 | Thin price discovery |
1 Regular-session liquidity should reveal the cleaner post-payment valuation.
2 Repurchase disclosures will show whether authorization becomes actual demand.
3 Aurora’s 14.2% core margin must stabilize against memory costs and stranded expenses.
4 Cash deployment must balance buybacks, organic investment and acquisitions.
$5 special distribution · $150 million buyback increase · Q2 2026 results · OCC contract adjustment
Do not read the raw −42.65% as like-for-like.
The buyback is discretionary. Aurora still faces margin pressure, negative recent free cash flow and post-divestiture execution risk.
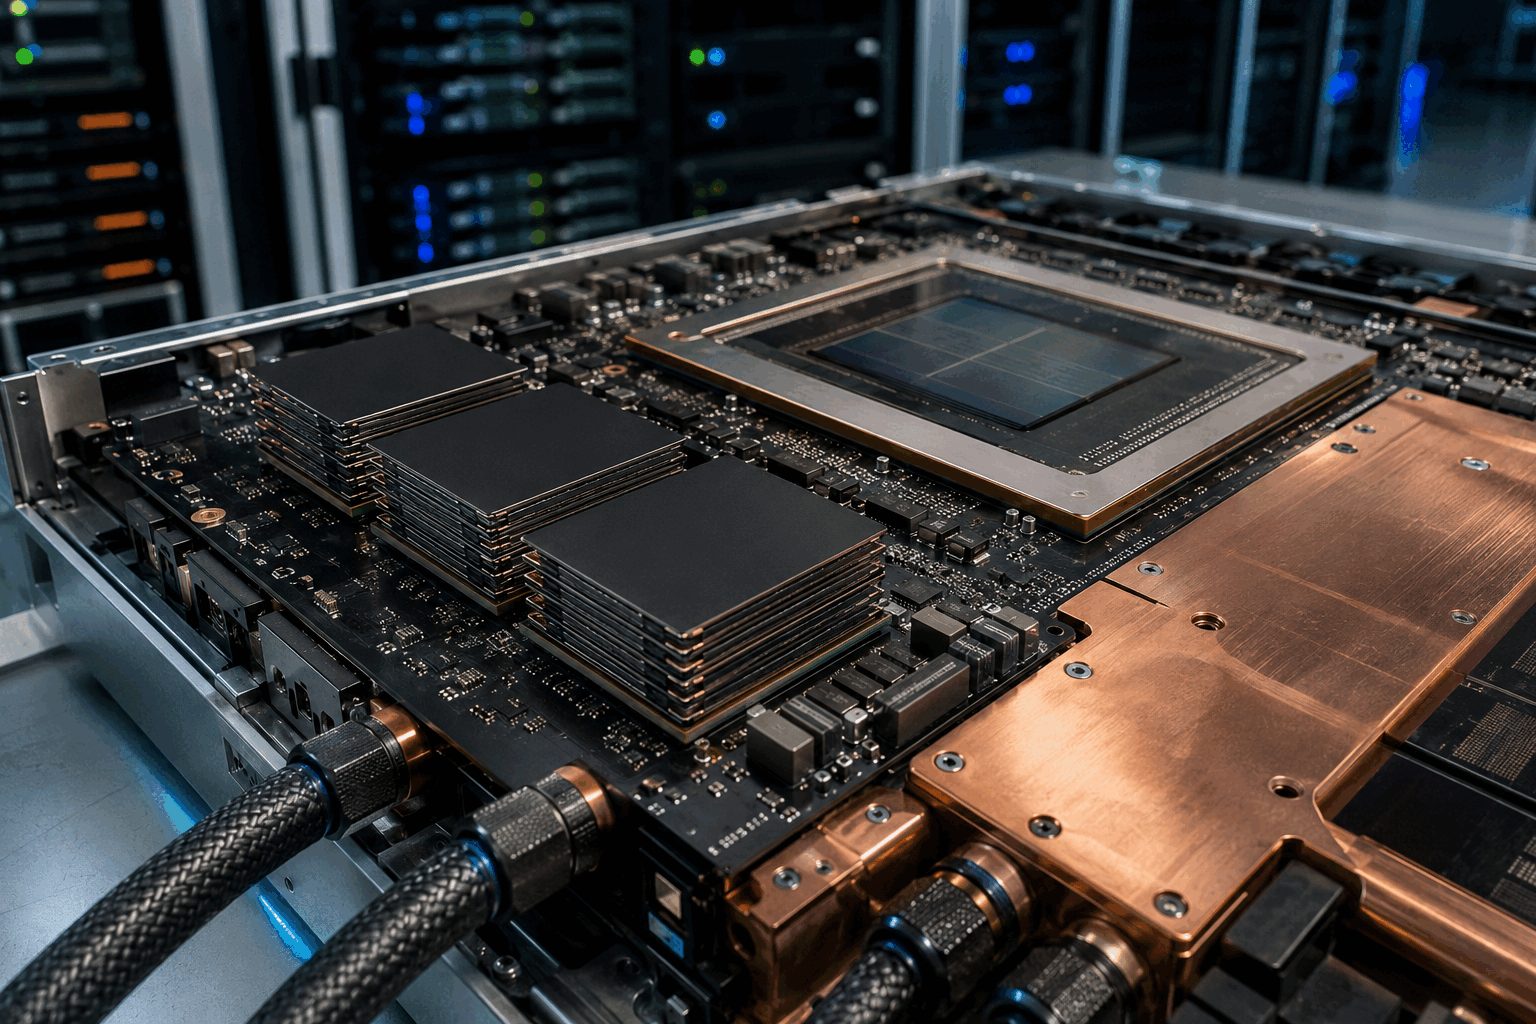
The AI-memory read-through remains strong. Price action says investors still want Micron-specific proof on HBM volume, pricing and margins.
August 27 value is intraday at 09:39 EDT; earlier values are official closes. The stock opened at $967.01 before fading.
| Metric | Current / latest | Comparison | Investor reading |
|---|---|---|---|
| Fiscal Q3 revenue | $41.46B | $23.86B prior quarter | +73.8% sequential |
| Operating cash flow | $25.39B | $11.90B prior quarter | Cash conversion strengthened |
| Adjusted free cash flow | $18.3B | $7.1B capex | Funds expansion internally |
| Adjusted gross margin | 84.9% | 74.9% prior quarter | Exceptional, hard to sustain |
| Forward P/E | 6.5× | 21.2× trailing | Large earnings-cycle assumption |
| Net cash | $23.75B | $21.03 per share | Balance-sheet cushion |
HBM is stacked memory placed beside AI accelerators. Higher accelerator shipments increase the addressable memory content, but Micron’s realized revenue still depends on qualification, allocation, pricing and yield.
| Reference | Target / value | Upside from $943.46 | Implied FY2027 P/E |
|---|---|---|---|
| Current price | $943.46 | — | 6.1× |
| BMO / Mizuho | $1,300 | 37.8% | 8.4× |
| Analyst average | $1,515 | 60.6% | 9.8× |
| Analyst low | $361 | −61.7% | 2.3× |
| Analyst high | $2,200 | +133.2% | 14.2× |