
DETROIT, August 2, 2026, 15:55 EDT — Markets in the U.S. are now closed.
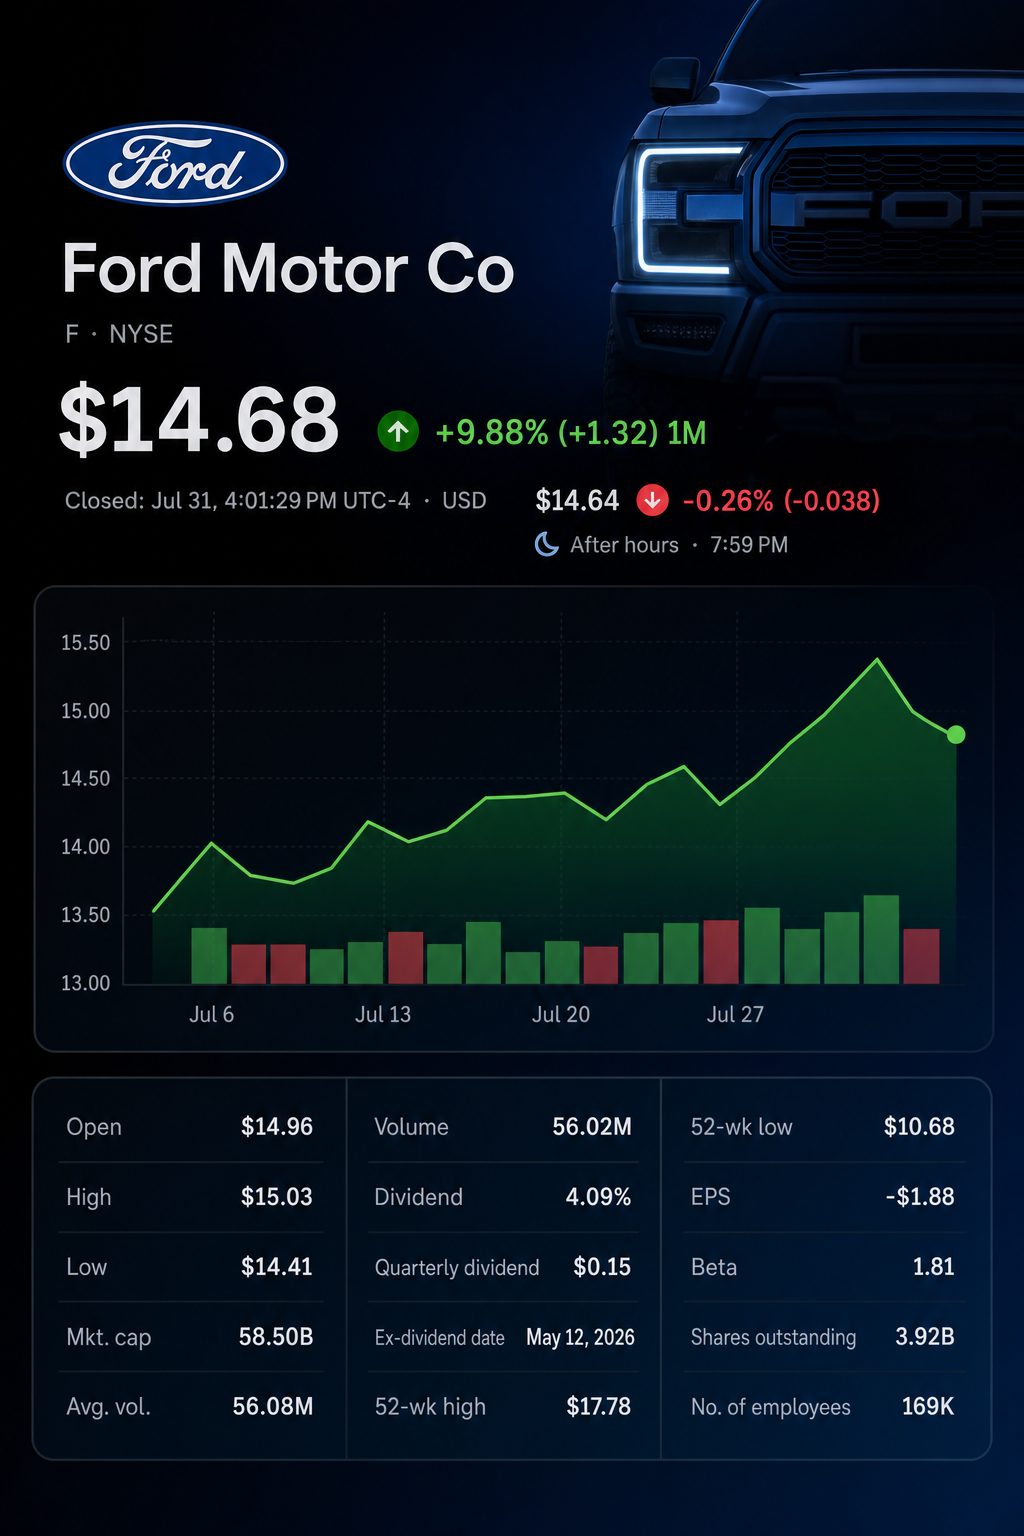
- Ford ended Friday at $14.68, the same as its closing price on Monday.
- Adjusted EBIT per wholesale vehicle increased by roughly 36% during the second quarter.
- Ford needs to produce between $5.8 billion and $6.8 billion in adjusted free cash flow in the second half.
Ford Motor Company NYSE:F finished earnings week at the same price it began, with shares closing Friday at $14.68, after peaking at $16.29 on Wednesday. The stock’s movement shifted focus from guidance on earnings to cash generation.
Ford increased its 2026 adjusted free cash flow forecast to a range of $6 billion to $7 billion. Adjusted free cash flow in the first half of the year was $200 million, leaving $5.8 billion to $6.8 billion expected for the second half, from July to December.
The implied share for the second half accounts for 96.7%-97.1% of the annual target. In comparison, adjusted EBIT shows less of a back half weighting. Ford requires $4 billion-$5 billion in the remainder of the year, following $6 billion generated in the first half.
| Ford 2026 target | First-half result | Guidance for the full year | Required in second half | Proportion in second half |
|---|---|---|---|---|
| Adjusted EBIT | $6.0 billion | $10.0-$11.0 billion | $4.0-$5.0 billion | 40.0%-45.5% |
| Adjusted free cash flow | $0.2 billion | $6.0-$7.0 billion | $5.8-$6.8 billion | 96.7%-97.1% |
Ford’s daily closing prices illustrate the swift decline of the earnings rally. The daily changes are based on the closing prices provided below.
| Session | Closing price | Daily change | Intraday high |
|---|---|---|---|
| Monday, July 27 | $14.68 | — | $14.87 |
| Tuesday, July 28 | $14.96 | up 1.9% | $15.02 |
| Wednesday, July 29 | $15.28 | up 2.1% | $16.29 |
| Thursday, July 30 | $14.86 | down 2.7% | $15.37 |
| Friday, July 31 | $14.68 | down 1.2% | $15.03 |
The high on Wednesday was 11.0% higher than the close on Monday. By Friday, the price had fallen 9.9% from that peak. After investors responded positively to the improved outlook, the whole week’s advance was erased.
The operating metrics shifted differently. Ford’s vehicle output declined, yet adjusted profit increased. The computed rows result from dividing the figures reported by the company by wholesale volumes.
| Second-quarter indicator | 2025 | 2026 | Change |
|---|---|---|---|
| Wholesale vehicle count | 1.185 million | 1.039 million | -12.3% |
| Sales revenue | $50.2 billion | $48.3 billion | -3.8% |
| Adjusted EBIT | $2.1 billion | $2.5 billion | +19.0% |
| Adjusted EBIT margin | 4.3% | 5.2% | +0.9 points |
| Average revenue per wholesale vehicle | $42,363 | $46,487 | +9.7% |
| Adjusted EBIT per wholesale vehicle | $1,772 | $2,406 | +35.8% |
The per-vehicle figure serves as a directional measure. Adjusted EBIT for the entire company also factors in Ford Credit and other operations. Nonetheless, it shows that gains from higher-value products and cost reductions are balancing out the impact of lower volumes.
Ford’s “industrial system is getting fitter,” according to Chief Financial Officer Sherry House. CEO Jim Farley noted that the company’s trucks, off-road vehicles and hybrids are showing “real pricing power.” Reuters
A Wall Street Journal report over the weekend highlighted Ford’s ongoing focus on product strategy. The automaker no longer offers sedans, inexpensive hatchbacks, or minivans. Customization executive Matt Simpson described the company’s current portfolio as “the most passionate lineup that Ford has ever had.” The Wall Street Journal
The results for each segment highlight ongoing inconsistency in earnings quality. Ford Blue saw gains, while Ford Pro’s performance declined. Model e persisted in absorbing a significant portion of profits from other areas.
| Ford segment, second quarter | Revenue | EBIT | EBIT margin | EBIT change from 2025 |
|---|---|---|---|---|
| Ford Blue | $26.1 billion | $1.135 billion | 4.4% | +$474 million |
| Ford Pro | $17.8 billion | $1.718 billion | 9.7% | -$600 million |
| Ford Model e | $1.0 billion | -$919 million | -89.6% | +$410 million |
Ford Blue posted EBIT growth even as wholesales dropped by 8%. Ford Pro’s margin slipped to 9.7%, down from 12.3%. Model e registered annual improvement but continued to report a loss of nearly one dollar per dollar of revenue.
General Motors Company NYSE:GM provides a helpful reference point for cash flow timing. In the first half, GM reported $6.302 billion in adjusted automotive free cash flow. With a full-year goal of $9.5 billion to $11.5 billion, that suggests the company expects to generate between $3.2 billion and $5.2 billion in the second half.
This represents approximately 34%-45% of GM’s annual goal, while Ford has reached around 97%. The automakers apply different non-GAAP metrics. As a result, the comparison reflects timing differences rather than a direct measure of operational performance.
Ford has clear backing for its cash increase. Its outlook factors in approximately $500 million in anticipated tariff-related reimbursements. The company also projects an earnings boost from Novelis of around $1 billion, primarily in the latter half.
Early industry outlook: J.D. Power estimates the U.S. seasonally adjusted annual sales rate for July at 16.9 million vehicles. Ford projects a full-year range between 16.0 million and 16.5 million. Such demand levels, if verified, would help sustain both pricing and truck output.
Ford has not scheduled any investor events for the upcoming week. The next test for the market will likely focus on pricing, progress in restoring production, and cash flow generation. The company has achieved higher earnings per vehicle. Now, investors are looking for the corresponding improvement in cash flow.
Risks: Ford’s cash target for the second half depends on steady production levels and consistent pricing. Losses for Model e are still significant, and margins at Ford Pro have decreased. Additional tariffs or fresh supplier disruptions could widen the gap between earnings and cash flow.
Related articles: NYSE:F