
NEW YORK, August 3, 2026, 08:14 EDT
Microsoft stock was indicated up 2.1% at $474.40 ahead of the market open. The quote was recorded at 07:47 EDT. The main Nasdaq session was yet to start.
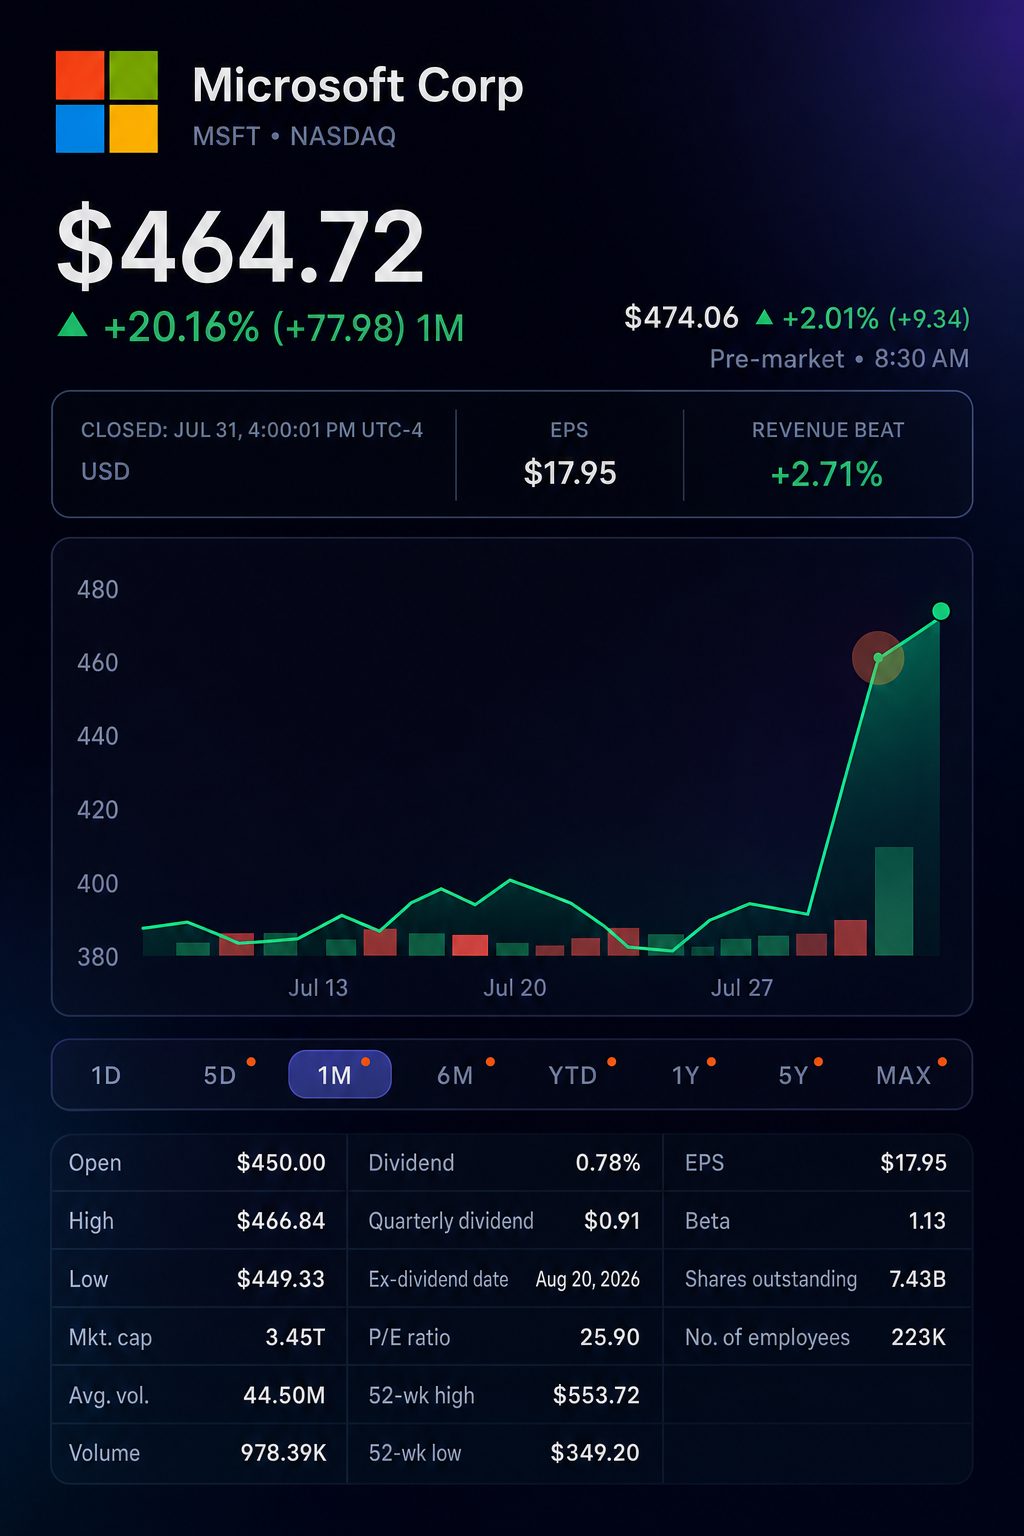
This came after a 21.8% increase over the previous Friday. On July 31, Microsoft finished trading at $464.72, rising 3.0% on the session. That price was $83.02 above where shares closed on July 24.
Investor appeal is now primarily found beyond OpenAI. Commercial remaining performance obligations climbed to $678 billion, an increase of 84%. Growth from the previous quarter was driven entirely by clients not classified as frontier-model firms.
Roughly 30% of that backlog is expected to turn into revenue over the next 12 months. This translates to $203.4 billion, according to an initial estimate. That amount represents 1.16 times Microsoft’s updated forecast for reported capital expenditure in calendar-2026.
The ratio indicates revenue predictability rather than returns on investment. The backlog takes in non-Azure deals and spans another timeframe. Microsoft’s smaller capex number is due to a lease-accounting adjustment, not a cutback in spending.
The stock outperformed the major indexes, with trading volume picking up pace.
| Period or measure | Microsoft | Comparator | Difference |
|---|---|---|---|
| July 31 session | +3.02% | S&P 500: +0.70% | +2.32 points |
| July 24–31 | +21.75% | Nasdaq Composite: +1.59% | +20.16 points |
| July 31 volume | 60.85 million | 65-day average: 40.64 million | 1.50 times |
| August 3 premarket | +2.08% | Nasdaq futures: +0.40% | +1.68 points |
Based on a preliminary estimate with 7.43 billion shares, the weekly rise in equity value is close to $617 billion. Reuters calculated that Thursday’s gain alone was approximately $450 billion, marking the largest single-day increase on record.
The quarter surpassed expectations on both operational and guidance fronts. Azure delivered the strongest outperformance.
| Measure | Actual or guidance | Wall Street estimate | Beat |
|---|---|---|---|
| Quarter revenue | $90.00 billion | $87.62 billion | 2.7% |
| Adjusted earnings per share, ex-OpenAI | $4.74 | $4.24 | 11.8% |
| Azure sales growth | 43.00% | 39.98% | 3.02 points |
| Fiscal Q1 revenue, midpoint | $90.40 billion | $89.66 billion | 0.8% |
| Fiscal Q1 Azure growth, at constant currency | 45.00% | 40.92% | 4.08 points |
According to Dave Wagner, portfolio manager at Aptus Capital Advisors, Azure is “staying right there in the race.” Chief Financial Officer Amy Hood noted that demand “continues to exceed available supply.” Reuters
The outlook for cash conversion was less straightforward. Operating cash flow increased, while free cash flow declined amid the rapid pace of expansion.
| Measure | Fiscal Q4 2025 | Fiscal Q4 2026 | Change |
|---|---|---|---|
| Commercial RPO | $368.0 billion | $678.0 billion | +84% |
| Quarterly capital spending | $24.2 billion | $41.0 billion | +69% |
| Operating cash flow | $42.6 billion | $55.4 billion | +30% |
| Free cash flow | $25.6 billion | $19.6 billion | -23% |
| Initial RPO for every $1 of quarterly capital spending | 15.2 times | 16.5 times | +8.6% |
The last row indicates contract visibility is growing at a quicker rate than quarterly infrastructure costs. There are no details yet on margin or when revenue is recognized. The number of paid Microsoft 365 Copilot seats surpassed 30 million, compared to 20 million previously.
New business from customers adds weight to the wider demand case. ArcelorMittal SA NYSE:MT said on Monday that Azure would continue as its main cloud platform. The company is also planning to implement Microsoft Fabric, Purview, and Foundry. No financial details were provided.
Filings from competitors indicate increasing demand among the top three cloud service providers. Microsoft leads with the largest backlog-to-capex ratio.
| Company | Latest cloud growth | Backlog or RPO | 2026 capex plan | Raw backlog/capex |
|---|---|---|---|---|
| Microsoft | Azure: 43% | $678 billion | About $175 billion | 3.9 times |
| Alphabet Inc. NASDAQ:GOOGL | Google Cloud: 82% | $514 billion | $195–$205 billion | 2.6 times |
| Amazon.com Inc. NASDAQ:AMZN | AWS: 37% | $496 billion | $220 billion | 2.3 times |
Calculated using Alphabet’s guidance midpoint of $200 billion.
The ratios reflect trends. Microsoft’s commercial RPO covers more than just Azure. The peer backlogs relate only to cloud, but all three spending plans encompass the entire company.
This week features a series of key tests. Monday at 10:00 EDT sees the release of July manufacturing figures. Advanced Micro Devices Inc. NASDAQ:AMD will post results Tuesday after market close, with services data following on Wednesday and July payroll numbers out on Friday. Microsoft has provided guidance, expecting fiscal first-quarter capex to top $50 billion.
Risks: Free cash flow declined by 23%, with quarterly capital expenditures increasing 69%. Gross margin at the company decreased to 67%. Uncommenced data-center leases totaled $329.1 billion. Revenue from Windows OEM and Devices decreased 7%, and Xbox content and services revenue fell 10%.
Related articles: NASDAQ:MSFT