SoFi Technologies (NASDAQ:SOFI) Shares Dip Ahead of Q2 Amid 38% EBITDA Margin Challenge
28 July 2026
2 mins read

SoFi Technologies (NASDAQ:SOFI) Shares Dip Ahead of Q2 Amid 38% EBITDA Margin Challenge

NEW YORK, July 28, 2026, 15:10 EDT — U.S. regular market trading remained underway.

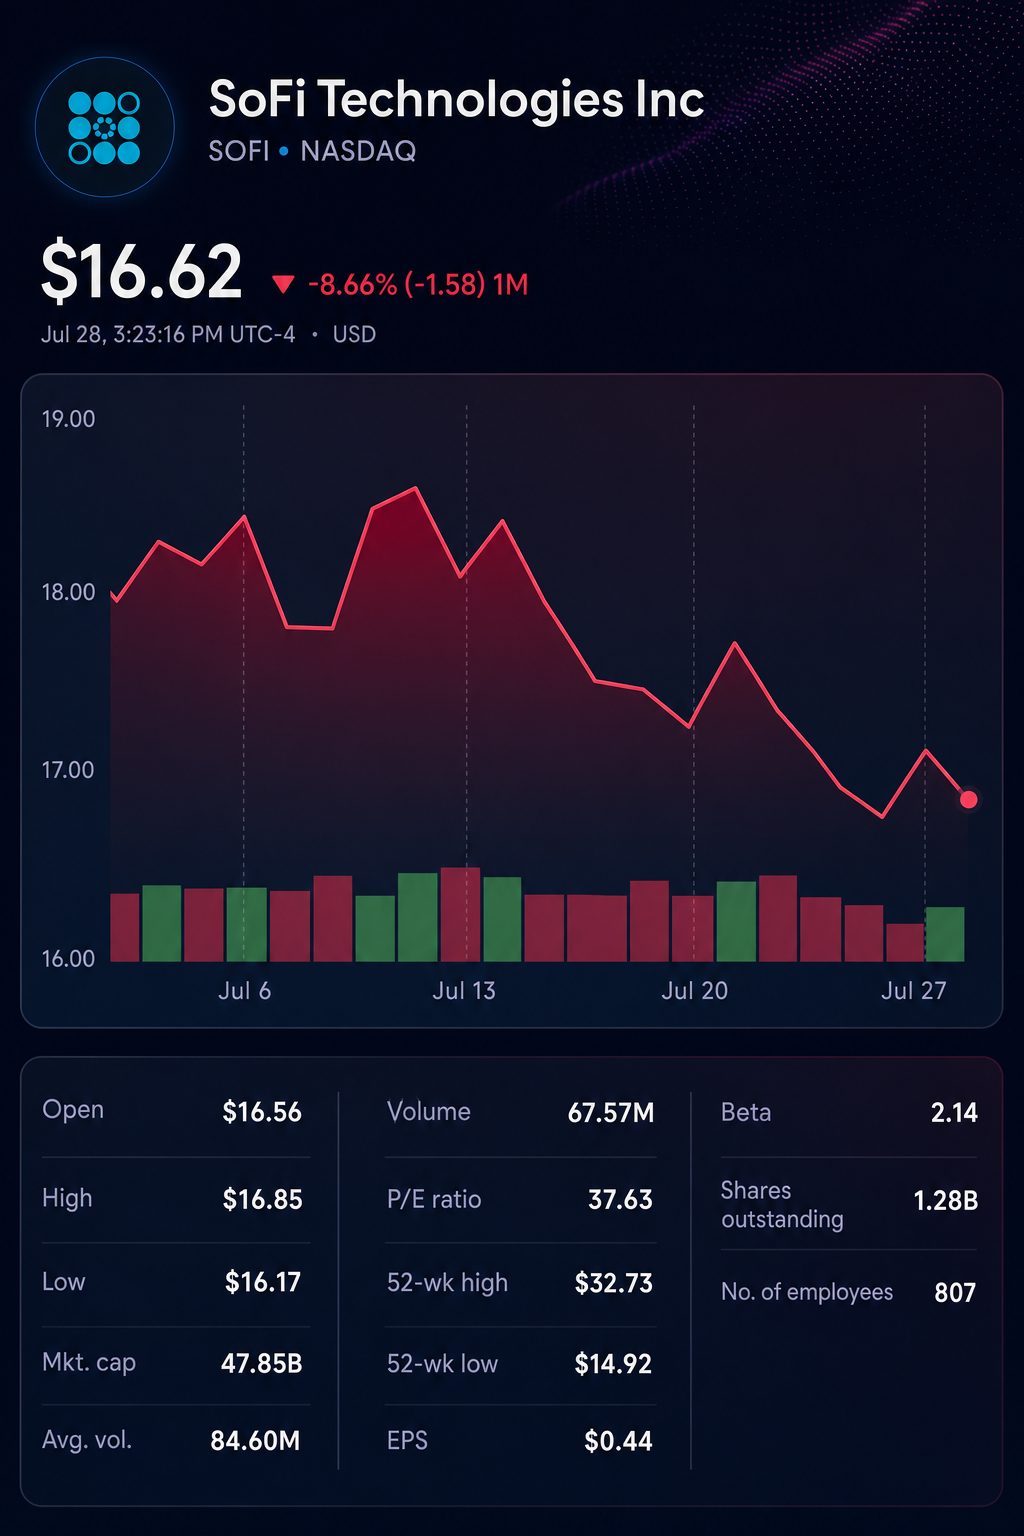
SoFi Technologies slipped 1.5% to $16.63 during late trading on Tuesday. The Nasdaq Composite showed little change earlier in the afternoon.

The fintech company is set to publish its second-quarter results around 07:00 EDT on Wednesday, followed by a conference call an hour later. Analysts are projecting earnings of 11 cents per share.

The projection aligns with management’s guidance of 10 to 11 cents. More challenging conditions are expected after June.

SoFi’s yearly goals call for a sharp increase in profit in the latter half of the year. The main metric is adjusted EBITDA, which stands for earnings before interest, taxes, depreciation and amortization.

Adjusted measureQ1 actualQ2 company guideH2 quarterly average needed
Net revenue$1.087 billionAbout $1.115 billionAbout $1.226 billion
EBITDA$339.9 millionAbout $330 millionAbout $465.0 million
EBITDA margin31%About 30%About 37.9%

Early estimate. It assumes Q2 is in line with guidance and full-year goals stay at $4.655 billion in adjusted revenue and $1.6 billion in adjusted EBITDA. These figures are non-GAAP.

This calculation results in $2.453 billion of adjusted revenue projected for the second half. The average per quarter is 10% higher than the Q2 outlook.

SoFi must also deliver approximately $930 million in adjusted EBITDA for the second half, requiring $465 million per quarter—41% higher than the Q2 outlook.

The implied margin stands at 37.9%, compared to about 30% in Q2. Execution is crucial.

Management has previously indicated expectations for back-end weighting. Seasonal payroll taxes along with accelerated marketing expenditures impacted the first half.
Stock chart for NASDAQ:SOFI

Chief Financial Officer Chris Lapointe stated that these investments are expected to drive growth in the future. He maintained the full-year outlook as of April.

First-quarter results provide some backing. Adjusted revenue increased by 41% to $1.087 billion. Adjusted EBITDA jumped 62% to $339.9 million.

Funding continues to be a fundamental strength. In Q1, deposits made up over 90% of average liabilities.

Their average expense was 155 basis points less than warehouse funding. SoFi projected $621.8 million in annualized interest savings.

The segment performance was uneven. Lending adjusted revenue increased by 53% to $629.3 million. Revenue from the Technology Platform dropped 27% to $75.1 million.

Credit remains the primary offset. SoFi projected a 4.4% comprehensive personal-loan charge-off rate, not counting sales of delinquent loans. This figure was unchanged from the previous quarter.

Chief Executive Anthony Noto told Reuters following the first quarter, “The health of our consumer base remains strong.” However, the company’s shares dropped 12% after the report. Reuters

According to William Blair analyst Andrew Jeffrey, SoFi “uncharacteristically did not flow through first-quarter revenue and EBITDA upside, keeping 2026 guidance effectively unchanged.” Reuters

On Tuesday, the stock was valued at 27.7 times the projected 2026 adjusted earnings per share. MarketWatch’s consensus rating of 26 continued to be Hold.

The key focus on Wednesday is guidance rather than just an EPS beat. If the outlook is raised, it would ease the implied margin pressure in the second half.

Risks: Increased credit losses, reduced loan demand, or a slow rebound in the Technology Platform may jeopardize the margin outlook. Conversely, stronger growth or stricter cost management could have a positive effect.

TS2 TECH • EXTENDED COVERAGE

Further analysis

When is SoFi scheduled to report, and what are analysts’ expectations for key figures?

SoFi is set to announce its second-quarter earnings on Wednesday, July 29, with results expected at approximately 7 a.m. ET. The firm’s conference call will begin at 8 a.m. ET. Analysts’ consensus forecasts point to revenue of about $1.11 billion and earnings per share of $0.11. Differences in published estimates exist since some sources report GAAP while others use adjusted figures. SoFi Investors

What is SOFI’s trading level ahead of its earnings report?

At 2:49 p.m. ET Tuesday, July 28, the stock was at $16.625, down 1.51%. Volume reached 63.8 million shares traded within a range of $16.18 to $16.845. Market capitalization was about $22.9 billion. The share price was 36.5% lower than its $26.18 close at year-end. Tiingo

What would qualify as a robust second-quarter report?

Management forecast adjusted net revenue close to $1.115 billion, indicating growth around 30%. The company projected an adjusted EBITDA margin of about 30%, and an adjusted net income margin in the 12%–13% range. Meeting or exceeding revenue expectations while maintaining margins would achieve the set operational goals. Attention may shift to the outlook; shares declined following Q1 record results when management reaffirmed 2026 objectives. SEC

Is SoFi planning to update its full-year 2026 guidance?

The company is keeping its full-year outlook at $4.655 billion in adjusted revenue, $1.6 billion in EBITDA, and $825 million in adjusted income. Management also aims for adjusted earnings per share of $0.60. Based on the first quarter results and current guidance for the second quarter, about $2.453 billion in revenue is needed in the second half, or roughly $1.226 billion per remaining quarter. While a higher projection is possible, management has not indicated any increase following Q1. SEC

Does the growth in membership continue to underpin the investment rationale?

Membership for the first quarter reached 14.7 million, up 35% compared to a year ago. SoFi posted an all-time high by adding 1.055 million new members and 1.8 million new products. Total products climbed 39% year over year to 22.2 million. Cross-buy activity hit 43%. To fulfill its full-year guidance, at least 30% member growth is needed, providing limited scope for a significant slowdown. SEC

Is it possible for lending growth to persist without a decline in credit performance?

Q1 originations totaled $12.18 billion, up 68% from the prior year. Personal loans accounted for $8.3 billion, student loans for $2.6 billion, and home loans for $1.22 billion. All-in personal-loan charge-offs were approximately 4.4%, remaining flat quarter over quarter. Recent vintages posted cumulative losses of 4.64% with 36% of balances outstanding. For comparison, the equivalent 2017 vintage posted 6.32%, highlighting credit as the major factor. SEC

Do deposits continue to support SoFi’s interest margins?

Deposits grew by $2.7 billion in Q1 to total $40.2 billion, making up over 90% of average liabilities. Deposit funding remained 155 basis points cheaper than warehouse facilities, resulting in approximately $622 million in annualized savings. The net interest margin increased by 22 basis points from the previous quarter to 5.94%. Year-on-year, average asset yields declined by 63 basis points, forming the primary source of margin pressure. SEC

Is the downturn in the technology platform being balanced out by performance in fee-based operations?

Fee-based revenue in Q1 climbed 23% to $386.8 million. Revenue from Financial Services grew 41% to $428.5 million. Technology Platform revenue declined 27% to $75.1 million, with enabled accounts down 16%. However, enabled accounts added four million from the prior quarter. Q2 results will indicate if platform stabilization can help maintain the wider revenue mix. SEC

Has the 2026 selloff made SOFI undervalued?

SOFI shares traded at $16.625, about 37 times its trailing earnings. Shares also valued the stock at close to 28 times management’s adjusted EPS goal of $0.60. Based on projected adjusted revenue, the market cap was roughly 4.9 times that figure. These metrics combine GAAP and non-GAAP numbers, affecting the precision of comparisons. The valuation continues to price in high growth, despite a 36.5% drop in the year so far. SEC

Roman Perkowski is a senior markets reporter at TS2.tech, specializing in stocks, technology and macroeconomic trends. A graduate of the Cracow University of Economics, he previously worked in investment research and corporate finance. His coverage helps readers understand the key forces driving global financial markets and emerging industries. Follow Roman Perkowski on Google News.

AI PORTFOLIO

Top Stock Picks

Today’s highest-ranked model selections.

#1 BUY IN STAGES

AerCap

NYSE: AER 95 / 100
#2 BUY ON WEAKNESS

Xylem

NYSE: XYL 93 / 100
#3 ACCUMULATE

General Dynamics

NYSE: GD 91 / 100
#4 BUY WITH LIMITS

Visa

NYSE: V 88 / 100
#5 TACTICAL BUY

IDEX

NYSE: IEX 85 / 100
View full portfolio
Editorial model selection. Not personalised advice.
JetBlue (NASDAQ:JBLU) Shares Rise as 2028 Profit Goal Hinges on Lower Fuel Costs
Previous Story

JetBlue (NASDAQ:JBLU) Shares Rise as 2028 Profit Goal Hinges on Lower Fuel Costs

Plug Power (NASDAQ:PLUG) Shares Slip 4% Ahead of $80 Million Liquidity Deadline
Next Story

Plug Power (NASDAQ:PLUG) Shares Slip 4% Ahead of $80 Million Liquidity Deadline