NEW YORK, August 3, 2026, 10:46 EDT – Alphabet stock surged as a $98 billion investment windfall distorted the company’s price-to-earnings ratio.
Shares of Alphabet Inc. (NASDAQ:GOOGL; NASDAQ:GOOG) gained 3.4% to trade at $368.19 during morning hours. The company’s market capitalisation was around $4.51 trillion.
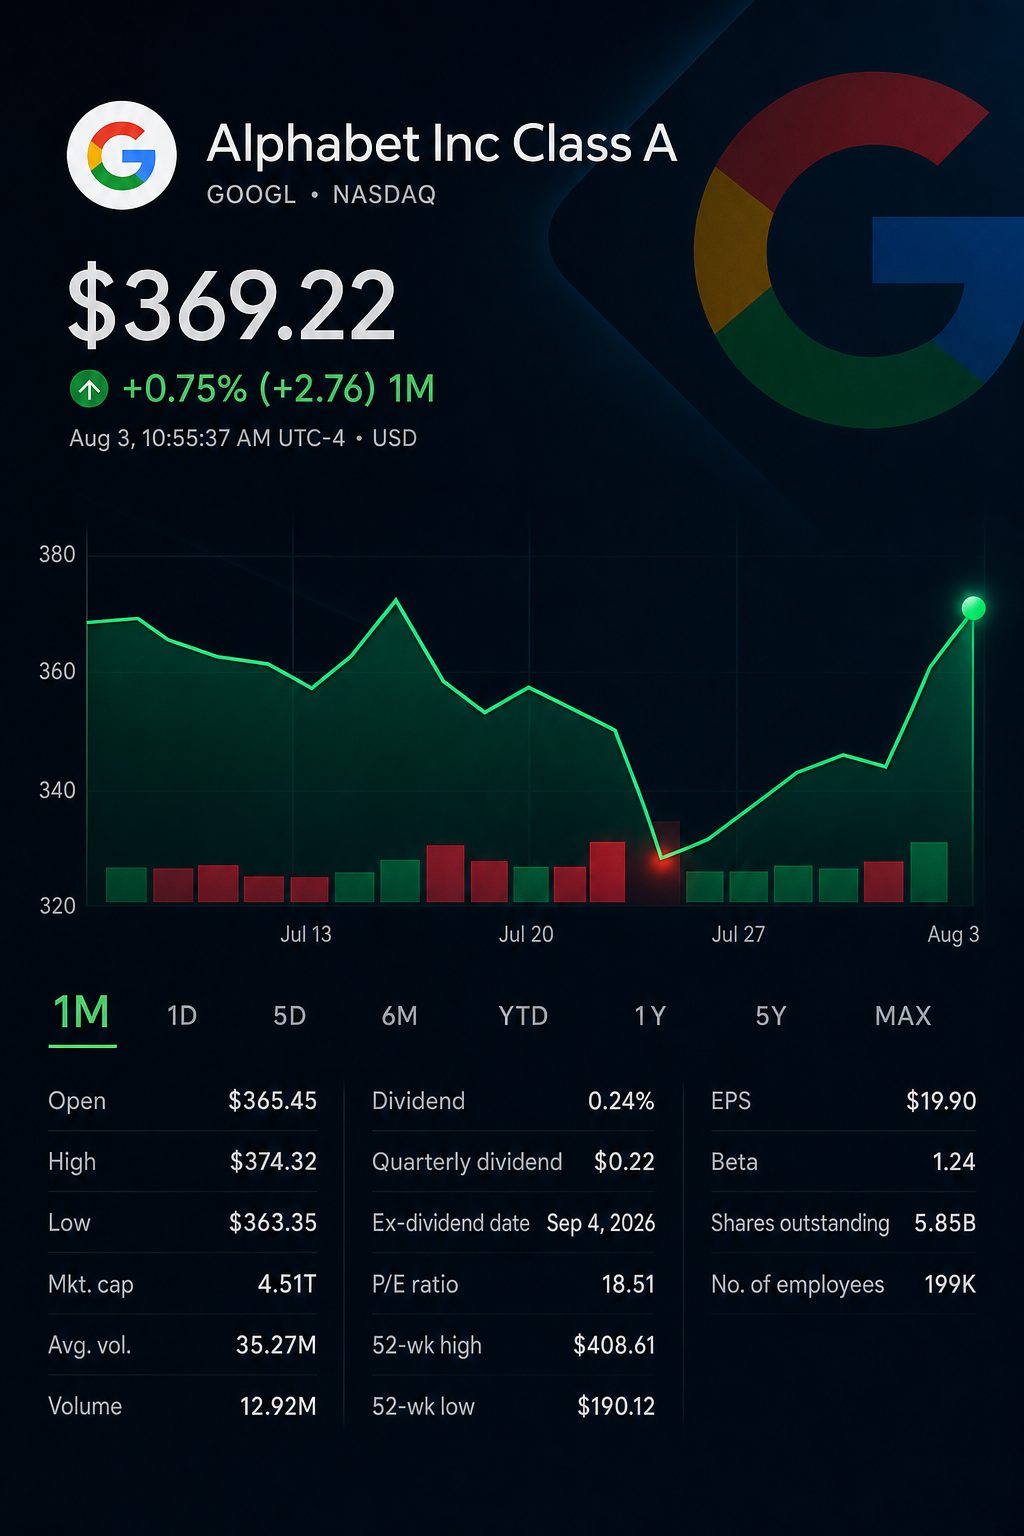
Initial estimates show Monday’s increase in equity value was close to $148 billion, representing approximately 74% of Alphabet’s projected $200 billion midpoint for capital spending in 2026.
Alphabet is not reduced to a plain value play by the change. Its trailing P/E of 18.5 is boosted by a substantial mark-to-market gain.
Wall Street sentiment improved. Oil slid over 5.5% amid optimism for U.S.-Iran negotiations. Communication services outperformed within S&P 500 sectors.
Shares of Microsoft Corporation NASDAQ:MSFT, Meta Platforms Inc. NASDAQ:META, and Amazon.com Inc. NASDAQ:AMZN outpaced other gains. Recent earnings from Amazon and Microsoft helped alleviate concerns over returns on AI investments.
| Company | Price | Monday move | Market value | Trailing P/E |
|---|---|---|---|---|
| Alphabet | $368.19 | up 3.4% | $4.51 trln | 18.5x |
| Microsoft | $485.61 | rose 4.5% | $3.62 trln | 28.9x |
| Meta Platforms | $587.70 | gained 5.6% | $1.51 trln | 22.1x |
| Amazon.com | $285.80 | advanced 5.2% | $3.12 trln | 23.0x |
Quotes shown with a delay as of 10:29 a.m. EDT. P/E ratios reflect trailing data.
The median P/E among peers stood at 23.0 times. Alphabet came in almost 20% below this level, though the comparison is not straightforward.
Alphabet posted $97.98 billion in other income for the second quarter. The company saw a $99.03 billion gain from equity securities, boosting net income by $77.1 billion. This also increased diluted EPS by $6.26.
| Alphabet metric | Q2 2025 | Q2 2026 | Change |
|---|---|---|---|
| Revenue | $96.43 bln | $119.80 bln | up 24% |
| Operating income | $31.27 bln | $40.77 bln | up 30% |
| Google Cloud revenue | $13.62 bln | $24.77 bln | up 82% |
| Google Cloud operating income | $2.83 bln | $8.81 bln | up 212% |
| Other income, net | $2.66 bln | $97.98 bln | 36.8 times higher |
| Diluted EPS | $2.31 | $9.11 | up 294% |
Figures as reported by the company. Growth percentages derive from original, unrounded numbers.
The core business continued to strengthen. Cloud operating margin increased to 35.6% compared to 20.7%. Cloud profit more than tripled.
CEO Sundar Pichai stated, “Our AI investments are redefining what’s possible across every part of our business.” Finance chief Anat Ashkenazi commented, “The demand still outpaces that investment.” SEC
Cash conversion declined. Capital expenditure for the second quarter rose to $44.9 billion, surpassing operating cash of $39.1 billion. Free cash flow was negative by $5.9 billion.
| Quarter | Operating cash flow | Capital spending | Free cash flow | Capex/operating cash |
|---|---|---|---|---|
| Q3 2025 | $48.4 bln | $24.0 bln | $24.5 bln | 49% |
| Q4 2025 | $52.4 bln | $27.9 bln | $24.6 bln | 53% |
| Q1 2026 | $45.8 bln | $35.7 bln | $10.1 bln | 78% |
| Q2 2026 | $39.1 bln | $44.9 bln | $(5.9) bln | 115% |
Alphabet’s non-GAAP measure is applied for free cash flow.
The trajectory over the past four quarters is evident. In late 2025, capital expenditure accounted for 49% of operating cash. By June, this figure had climbed to 115%.
Investing.com senior analyst Thomas Monteiro stated that “capital has a real cost again.” He noted that Alphabet’s margin for error was narrowing each quarter. Reuters
Risks are still significant. Alphabet reported $17.4 billion in accrued legal and regulatory penalties. The company also detailed $44.1 billion in potential backstops and contingent funding obligations.
Free cash flow provides another straightforward indicator. A rebound would lend more weight to the discounted valuation. For now, headline EPS does not fully reflect the situation.
Related articles: NASDAQ:MSFT