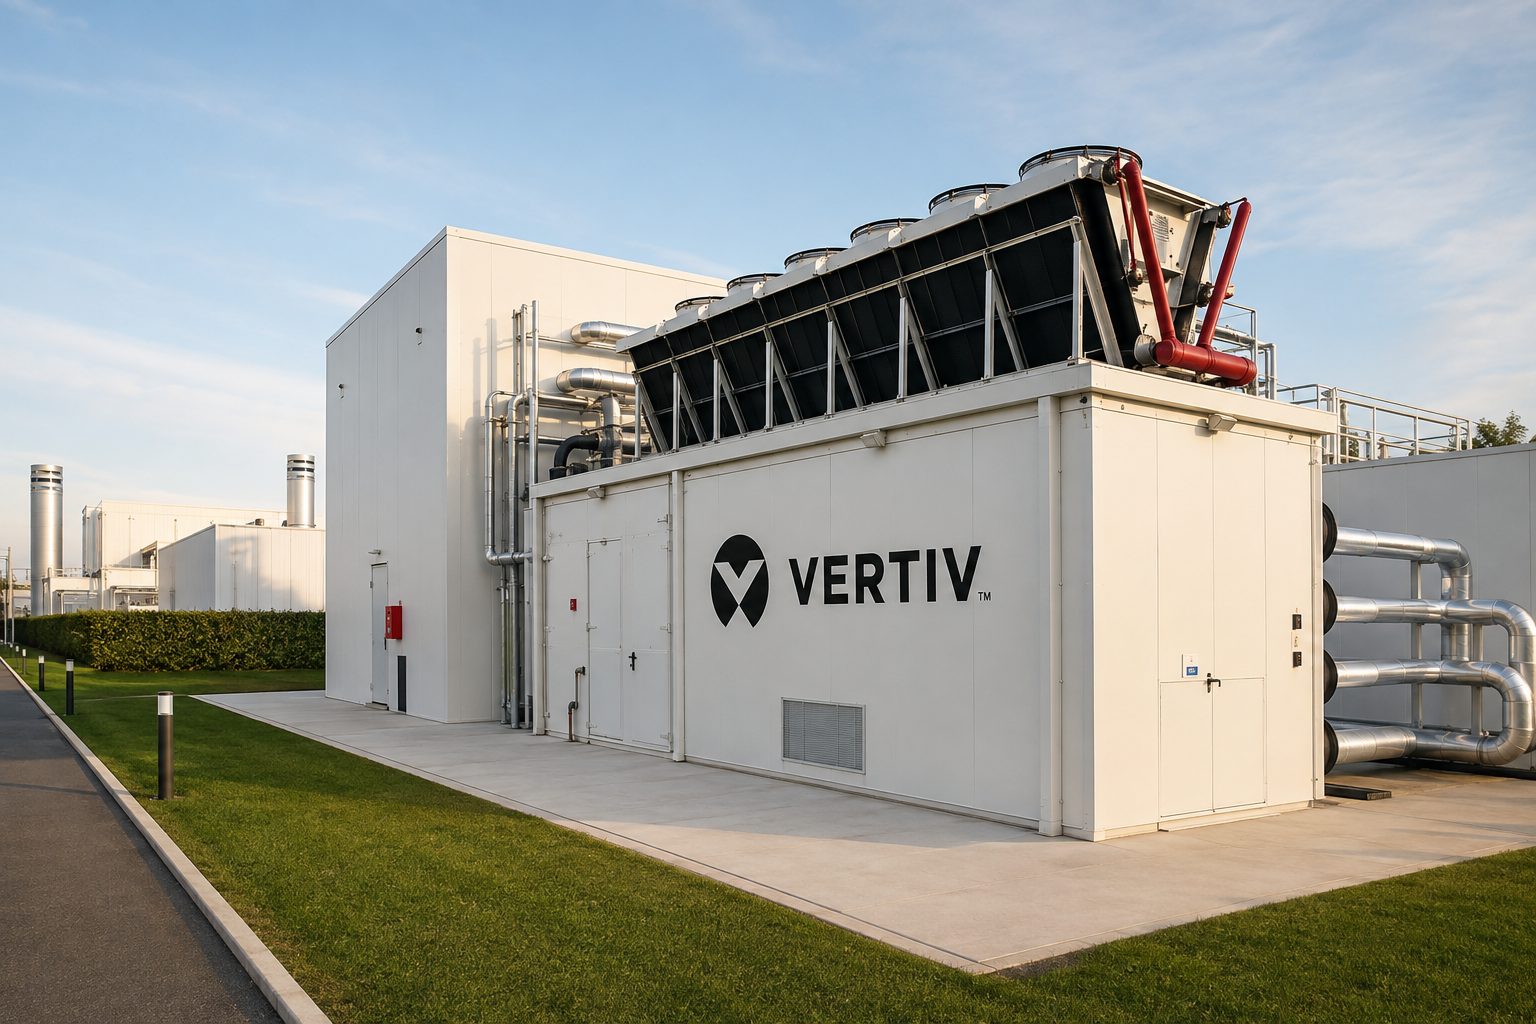

WESTERVILLE, Ohio, August 23, 2026, 08:11 EDT — Vertiv Holdings (VRT.N) dropped 10.9% over the past week as investors reacted to a sharp rise in yields that challenged the stock’s artificial intelligence premium.
- Vertiv shares dropped 10.9% last week, wiping about $12.3 billion off its market capitalization.
- The bulk of the losses occurred on Tuesday and Wednesday, when rising bond yields weighed on high-priced AI-infrastructure stocks.
- Wall Street projects an average increase of 29.1%, though forecasts range from a 9.9% decline to a 63.0% rise.
Vertiv Holdings Co NYSE:VRT dropped 10.9% during the past week, wiping out an estimated $12.3 billion in market capitalization. Despite the decline, shares remain 109.5% higher year-on-year after Friday’s close.
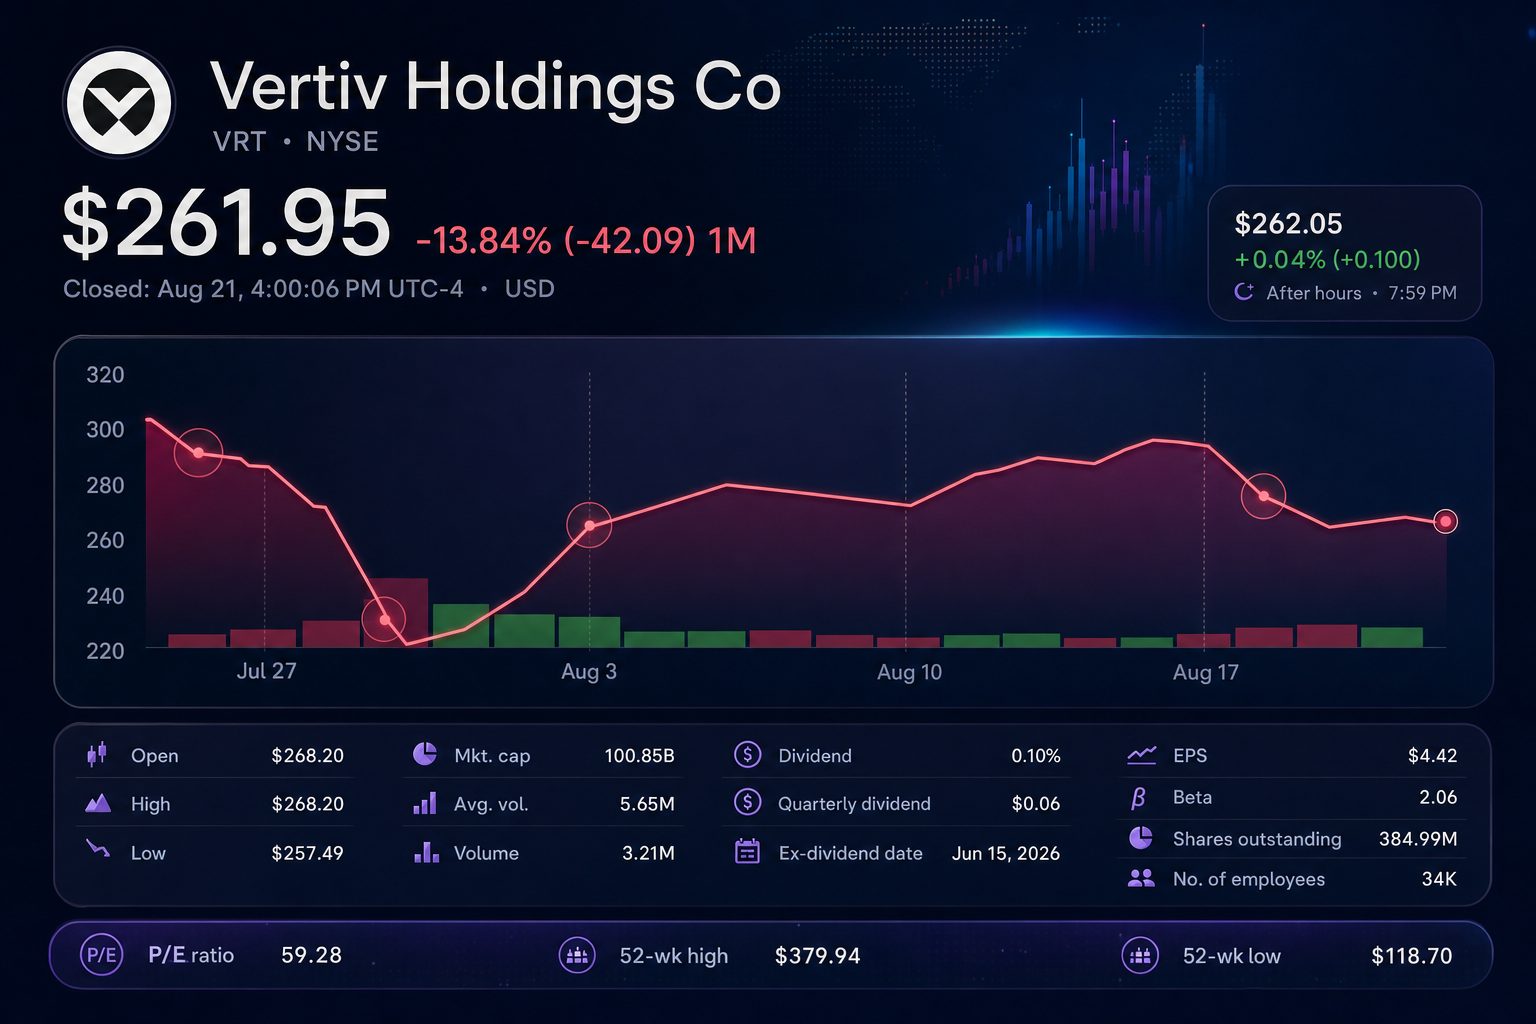
The significance lies in the fact that Vertiv did not deliver a new profit warning. However, investors still reduced the value of a rapidly expanding AI provider as long-term Treasury yields climbed and technology stocks slipped.
The shift in pricing was sudden. Almost the entire decline for the week took place on Tuesday and Wednesday, followed by a brief recovery on Thursday.
| Date | Close ($) | Daily move | Volume |
|---|---|---|---|
| Aug. 14 | 293.84 | increased 2.36% | 3.15m |
| Aug. 17 | 292.43 | fell 0.48% | 3.55m |
| Aug. 18 | 272.54 | dropped 6.80% | 5.55m |
| Aug. 19 | 261.00 | declined 4.23% | 6.14m |
| Aug. 20 | 264.63 | rose 1.39% | 4.76m |
| Aug. 21 | 261.95 | down 1.01% | 3.21m |
High-valuation AI stocks were caught up in Tuesday’s wider market decline. The Nasdaq slipped 1.3% as investors considered the payoff from AI investments amid higher yields. Shares in Vertiv slid roughly 7% on the day.
The company’s sensitivity is apparent. Vertiv is valued at 59.1 times its trailing earnings, Yahoo Finance data shows. Despite this, the firm’s second-quarter performance continued to post significant improvements in margins and cash flow.
| Second-quarter measure | Reported | Comparison | Investor read-through |
|---|---|---|---|
| Net sales | $3.274bn | Up 24% from a year earlier; misses Street by around 3% | Momentum was robust, but timing of projects impacted results |
| Adjusted EPS | $1.52 | Up 60% from last year; tops consensus of about $1.42 | Profit margins outpaced forecasts |
| Adjusted operating margin | 22.6% | Increase of 410 basis points | Improvements in pricing and productivity offset tariff impacts |
| Adjusted free cash flow | $925m | 234% higher year on year | Company moved to a net cash position |
Revenue showed slight impacts from supply-chain congestion and the timing of key projects. Adjusted EPS surpassed consensus, and Vertiv lifted its full-year guidance on main metrics.
Chief Executive Giordano Albertazzi stated, “Demand for AI and general compute continues to intensify.” Vertiv is now aiming for $14.0 billion in 2026 sales at the midpoint, forecasting 31% organic growth and $2.5 billion in adjusted free cash flow.
| August recommendation | Analysts | Share of 28 |
|---|---|---|
| Strong Buy | 21 | 75.0% |
| Buy | 3 | 10.7% |
| Hold | 4 | 14.3% |
| Sell / Strong Sell | 0 | 0.0% |
Analysts are optimistic overall, though their price targets vary more than usual. The broad range suggests differing views about the extent to which Vertiv’s present valuation already reflects the AI buildout.
| Target scenario | Target price ($) | Change from $261.95 |
|---|---|---|
| Lowest | 236.00 | -9.9% |
| Average | 338.15 | +29.1% |
| Median | 345.00 | +31.7% |
| Highest | 427.00 | +63.0% |
The coming week will reveal if Thursday’s rally can hold. Investors are advised to track long-term Treasury yields, hyperscaler investment trends, and signs that postponed projects are translating to sales in the third quarter.
Vertiv projects third-quarter sales between $3.65 billion and $3.85 billion, and expects its adjusted operating margin to be in the 24%-25% range. Results approaching the higher end of these forecasts would help justify the stock’s premium valuation.
Risks: A further increase in yields may put additional pressure on the multiple. Supply bottlenecks, delays in project timelines, or reduced AI capital expenditures could postpone revenue. Improved conversion rates and margins would counter bearish arguments.
Related articles: NYSE:VRT