
IRVINE, California, August 31, 2026, 09:10 EDT
- Rivian ended Friday’s session at $16.07, falling 4.35%, with 40.92 million shares traded.
- The share price was $15.96 at 09:00 EDT, up just 3.0% from the $15.50 offer in July.
- Revenue for the second quarter increased by 27% to $1.66 billion, while automotive gross profit stayed in negative territory.
- Operating cash outflow for the first half totaled $1.19 billion as R2 inventory and production increased.
Rivian Automotive (NASDAQ: RIVN) declined 4.35% on Friday to close at $16.07. Ahead of the market open, shares were at $15.96 as of 09:00 EDT, shedding another 0.68%.
Rivian’s R2 cash test
Financials: quarter and six months ended June 30, 2026
Operating progress: growth returned, cash conversion did not
What supports the gross profit
The consolidated $179 million profit still depends on software and services.
Q2 operating scorecard
| Measure | Q2 2025 | Q2 2026 | Change |
|---|---|---|---|
| Production | 5,979 | 12,613 | +111% |
| Deliveries | 10,661 | 12,194 | +14% |
| Automotive revenue | $927M | $1.143B | +23% |
| Software revenue | $376M | $515M | +37% |
| Net loss | −$1.115B | −$837M | Improved $278M |
Liquidity and funding bridge
| Measure | Value | Context |
|---|---|---|
| June 30 liquidity | $5.846B | −$742M from December |
| H1 capital spending | $734M | Normal plant and platforms |
| July equity raise | ≈$1.3B | 86.25M shares at $15.50 |
| April VW funding | $1.0B | ≈63M shares at $15.90 |
| R2 ramp cost | ≈$100M | Incremental Q2 cost |
Valuation and positioning
| Market value | $23.27B |
| 52-week range | $12.39–$22.69 |
| Average analyst target | $19.23 |
| Target range | $13–$25 |
| Implied upside to average | 20.5% |
High short interest and above-average volume can magnify R2 news.
Investor lens
Watch first: automotive gross profit per vehicle as R2 volume rises.
Cash test: inventory and deferred-revenue swings must normalize.
Valuation test: $15.50 is the fresh financing anchor.
Risk: launch quality, warranty costs, demand and tariffs can delay margin gains.
The decision keeps Rivian just above the level set by its July share sale. That figure is significant since cash usage continues to be a tougher metric than stated gross profit.
| Market measure | Latest | Investor context |
|---|---|---|
| Friday close | $16.07, −4.35% | August 28, 16:00 EDT |
| Premarket | $15.96, −0.68% | August 31, 09:00 EDT |
| Friday volume | 40.92 million | Represents 127% of 65-day average |
| July offering | $15.50 | Premarket traded 3.0% above this level |
Rivian secured approximately $1.3 billion in July through the sale of 86.25 million shares. This transaction came after April’s $1 billion funding, which was linked to milestones with Volkswagen.
The recent capital injection backed a business now expanding once more. Revenue for the second quarter increased by 27.2% to $1.658 billion, with vehicle deliveries up 14% to 12,194 units.
| Second-quarter measure | 2025 | 2026 | Change |
|---|---|---|---|
| Revenue | $1.303 billion | $1.658 billion | up 27.2% |
| Automotive revenue | $927 million | $1.143 billion | up 23.3% |
| Software and services revenue | $376 million | $515 million | up 37.0% |
| Vehicle deliveries | 10,661 | 12,194 | up 14.4% |
| Consolidated gross profit | −$206 million | $179 million | up $385 million |
| Net loss | −$1.115 billion | −$837 million | $278 million improvement |
The underlying tension is clear from the breakdown. Automotive operations recorded a $36 million loss at the gross-profit level, while software and services delivered $215 million, driving overall profitability.
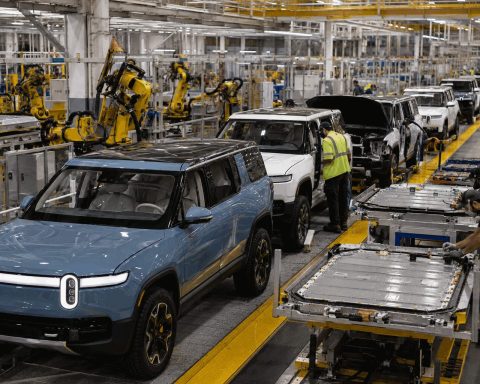
R2 shipments started in the quarter. The production scale-up resulted in roughly $100 million in abnormal manufacturing expenses. Management anticipates that losses per vehicle will decline as output grows.
Cash flow reversed direction. Operating cash outflow totaled $1.19 billion during the first half, up from $124 million a year prior. Rivian attributed this to reduced deferred revenue and inventory buys associated with R2.
| Funding and valuation measure | Value | Read-through |
|---|---|---|
| Liquidity as of June 30 | $5.846 billion | $742 million lower than December |
| Operating cash used in first half | $1.190 billion | 9.6 times greater than the same period last year |
| Capital expenditure, first half | $734 million | Tied to standard plant operations and new models |
| Equity raised in July | About $1.3 billion | 86.25 million shares priced at $15.50 each |
| Consensus analyst price target | $19.23 | 20.5% higher than the price before market open |
Analysts are split on the outlook. Out of 26 analysts monitored, the consensus rating is neutral. Price targets range from $13 to $25, with recommendations including 12 buy, eight hold, and five sell.
Trading volume on Friday reached 40.92 million shares, surpassing the 65-day average by 27%. As of August 14, short interest stood at 16.38% of the public float. This mix can intensify R2-related headlines in both directions.
The key benchmark is straightforward. Automotive gross profit needs to move into positive territory as working-capital usage declines. If not, the July financing could resemble a short-term bridge instead of providing lasting support.
Risks: Accelerating R2 output may enhance factory utilization and boost margins. However, weaker demand, issues at launch, shifts in tariffs, or increased warranty expenses could prolong losses and renew dilution worries.
Related articles: NASDAQ:RIVN