Leokadia Głogulska is a financial and technology journalist at TechStock² covering listed companies, earnings, artificial intelligence and developments across European and global equity markets. She previously worked in financial analysis and graduated from Wrocław University of Economics and Business.
At 05:00 EDT, U.S. stock futures edged down as fresh clashes between the U.S. and Iran pushed oil prices past $90. Nasdaq futures managed…
·2 min read
U.S. premarket · 05:00 EDT
Monday, August 31, 2026 · first hour
Available interval: 04:00–05:00 EDT
S&P futures
7,709.75
-0.16%
Dow futures
53,503
-0.15%
Nasdaq futures
29,512
+0.07%
Brent crude
$90.40
about +3%
Session-to-date vs last hour
Proxy
Level
04:00–05:00
Last hour
SPY
$768.33
-0.13%
-0.13%
QQQ
$716.04
-0.05%
-0.05%
IWM
$296.09
+0.11%
+0.11%
DIA
$534.42
-0.12%
-0.12%
The premarket was exactly one hour old, so both columns cover the same available interval.
Active leaders
Halliburton+2.43%
Valero+2.25%
Chevron+1.83%
GE Vernova-1.64%
Microsoft-0.78%
Nvidia+0.60%
Transmission map
What to watch
Two-year Treasury yields, Gulf headlines and airline/utility reactions. Chicago PMI comes later Monday; ISM manufacturing follows Tuesday and payrolls Friday.
Breadth and consolidated volume are not representative before the 09:30 EDT cash open.
Sources: Yahoo Finance futures snapshot at 05:00 EDT; Investing.com premarket snapshot at 04:45 EDT; MarketWatch; Reuters/AP market reports.
Ondas Inc. ended Friday down 9.71% at $7.90. Volume totaled 69.97 million shares, representing roughly 81% of the company's 65-day average.
·2 min read
NASDAQ: ONDS · Stock move
Ondas: backlog growth meets a loss test
Market: Aug. 28, 2026, 16:00 EDT Prepared: Aug. 31, 2026, 02:12 EDT
Friday close
$7.90
−9.71% · −$0.85
Volume
69.97M
81% of 65-day average
Market value
≈$3.98B
Aug. 28 close
After hours
$7.93
+0.38% · 19:59 EDT
Revenue ramp
Backlog conversion
$757M
Pro-forma backlog at June 30
1.41× midpoint 2026 revenue guide
Q2 adjusted EBITDA
−$50.6M
versus −$10.9M in Q1
Liquidity and deployment
June 30 cash + restricted cash + short-term investments
$1.4B
Q3 cash used for DZYNE and Cyberhawk
≈$325M
Modeled remainder before other flows
≈$1.08B
Analyst snapshot
Strong Buy
9 analysts$19.42 average target
Target range: $13–$25. Targets are estimates, not guarantees.
Execution checkpoint
Current evidence
What changes the thesis
Q3 revenue
$140M–$155M guide
Delivery timing and mix
Margins
50.4% adjusted gross margin in Q2
Operating leverage must offset integration costs
Profitability
Platform target: Q4 2026
Sequential EBITDA improvement
M&A
Aran: ≈$33M for ≈$26M expected 2026 sales
Q3 closing and integration
Risk frame
Backlog includes acquired businesses and depends on shipment schedules. Customer concentration, program delays and integration spending can shift revenue and cash flow between quarters.
Humana Inc. fell 1.79% Friday as investors weighed a 2027 Medicare Advantage pullback affecting about 600,000 members. That total represents roughly 8% of its…
·2 min read
NYSE: HUM · Investor dashboard
Humana’s 2027 margin reset
Market: Aug. 28, 2026, 16:00 EDT Prepared: Aug. 31, 2026, 01:05 EDT
Friday close
$385.54
−1.79% · −$7.03
Market value
$46.3B
36.4× trailing EPS
Members affected
600K
≈8% of 7.2M MA members
Expected recapture
40%
≈240K members
Membership bridge: exit scale versus retention
Investor read: The exits shrink volume, but they remove weaker capital-return plans. The valuation case depends on recapture and progress toward a sustainable individual MA pretax margin of at least 3% by 2028.
Operating checkpoints
2Q adjusted EPS
$7.61
FY26 adjusted EPS guide
≥$9.00
FY26 GAAP EPS guide
≥$6.52
2Q Insurance benefit ratio
91.2%
FY26 benefit-ratio guide
92.75% ±25 bp
FY26 individual MA growth
≈25%
What supports the reset
2027 CMS payment change +2.48%Risk-trend-inclusive change +4.98%More than $13B industry payment increase25% 2026 individual MA growthTargeted low-return plan exits
Hyperliquid Strategies Inc. lost 9.51% Friday as investors marked down a fast-growing digital-asset treasury after earnings. The drop followed an 11% gain on Thursday.
·2 min read
NASDAQ:PURR · Stock move
Hyperliquid Strategies
Market: Aug. 28, 2026, 16:00 EDT Token: Aug. 30, 2026, 16:31 EDT
PURR Friday close
$11.61
▼ 9.51% · 38.0M shares
HYPE token
$82.60
24/7 market · Sunday snapshot
HYPE held
29.28M
Company figure · June 30
Current gross token value
$2.42B
29.28M × $82.60
What the equity is pricing
The apparent discount is not free money. The company reported deferred taxes, preferred shares, warrants and ongoing equity issuance.
Sensitivity
HYPE move
Treasury impact
+$1
+$29.3M
−$1
−$29.3M
+10%
+$241.9M
−10%
−$241.9M
A 10% HYPE move equals about 10% of PURR’s basic market value.
Fiscal net income
$305.5M
Mostly unrealized token gains
Unrealized HYPE gains
$709.9M
Before one-time losses and tax
Staking + validator revenue
$9.5M
Fiscal year ended June 30
Remaining cash
$132.6M
As of Aug. 19 · includes $12M USDC
Capital engine
Action
Amount
Price / result
Equity raised
$646.6M
$8.70 average issue price
HYPE acquired
$773.4M
16.5M tokens at $46.77
PURR repurchased
$27.8M
5.8M shares at $4.80
Debt
$0
June 30 balance sheet
Investor checklist
Token exposure per diluted share
Primary KPI
Staking yield versus expenses
Recurring return
Equity issued above NAV
Dilution test
Deferred tax treatment
Asset discount
Protocol security and regulation
Tail risk
Sources: Hyperliquid Strategies SEC-filed FY2026 results and presentation; Yahoo Finance market close; CoinGecko Sunday token snapshot. Calculations use 29.28 million HYPE and are rounded.
SoFi Technologies lost 5.84% on Friday, closing at $18.06. The move erased roughly $1.4 billion from its equity value.
·2 min read
NASDAQ: SOFI · Stock move
SoFi growth meets a 30× earnings test
Market snapshot: Aug. 28, 2026, 4:00 p.m. ET Fundamentals: quarter ended June 30, 2026
Close
$18.06
Aug. 28 regular close
Daily move
−5.84%
≈ $1.4B equity value erased
Volume
45.67M
61% of 65-day average
Market cap
$23.33B
1.29B shares outstanding
Price context
Price, range, beta and performance as of Aug. 28, 2026, 4:00 p.m. ET.
Operating scorecard
Metric
Q2 2026
Q2 2025
Change
GAAP net revenue
$1.219B
$854.9M
+43%
GAAP net income
$156.6M
$97.3M
+61%
Adjusted EBITDA
$357.8M
$249.1M
+44%
Members
15.8M
11.7M
+35%
Technology Platform revenue
$84.5M
$109.8M
−23%
Company-reported results for the quarter ended June 30, 2026; released July 29, 2026.
2026 outlook
Adjusted net revenue$4.75B–$4.85B
Adjusted EBITDA≈ $1.60B
Adjusted net income≈ $825M
Adjusted EPS$0.60
Member growth≥ 30%
Revenue guidance increased on July 29. EBITDA, net income and EPS guidance stayed unchanged.
Investor bridge
Friday's selloff cut roughly $1.4 billion from SoFi's value despite 43% quarterly revenue growth. At about 30 times the unchanged 2026 adjusted EPS guide, faster member and lending growth must now produce a higher per-share profit outlook.
American Airlines Group Inc. closed down 0.6% on Friday after the company announced seven new daily international routes scheduled for 2027. The move increases…
·3 min read
American Airlines · NASDAQ:AAL
Routes grow. Margin must follow.
Market data: Aug. 28, 2026, 16:00 EDT Dashboard: Aug. 30, 2026, 10:57 EDT
Friday close
$13.64
−0.6%
Volume
63.4M
60% of 3-month average
Market cap
$9.0B
Approximate
Jefferies target
$15
≈10% implied upside · Hold
Profit bridge: revenue surged, fuel absorbed it
Operating margin: 2.7% Revenue rose about $2.3B; fuel expense rose more than $2.2B. The route plan needs premium fares, not just fuller aircraft.
Premium mix target
Current departures
25%
Planned mix
40%
Key financial signals
Metric
Reading
Q2 adjusted EPS
$0.15
Consensus before report
$0.03
Q3 revenue guide
+16% to +19%
Q3 adjusted EPS guide
−$0.70 to −$0.10
FY26 adjusted EPS guide
−$0.65 to +$0.65
Trailing EPS
−$0.49
Company guidance and reported figures as of July 23, 2026; market figures as of the Aug. 28 close.
2027 international additions
CLT → Barcelona · 777-200ERORD → Tokyo NRT · 787-9JFK → Amsterdam · A321XLRJFK → London · 787-9JFK → Nice · A321XLRPHL → Porto · A321XLRPHL → Reykjavik · A321neoPHL → Vienna · A321XLR
Investor watch: tickets open Aug. 31. Early booking strength and premium-cabin yield will show whether the smaller A321XLR can convert new destinations into margin.
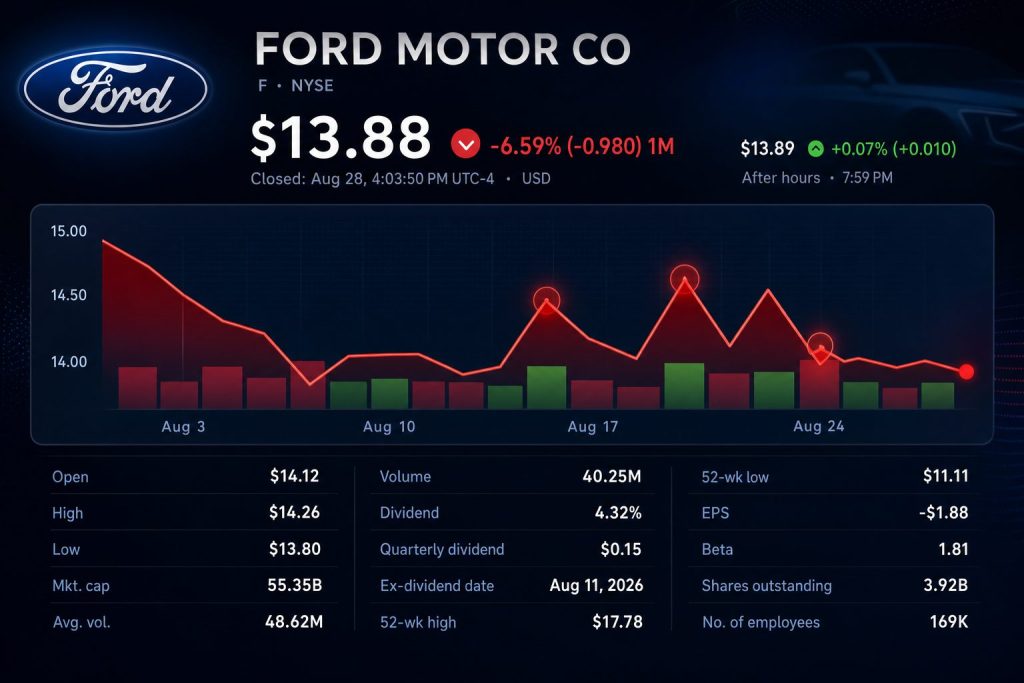
DEARBORN, Michigan, August 30, 2026, 01:10 – Ford Motor Co. shares dipped by 0.5% as the prospect of tariffs from Canada put pressure on…
·3 min read
NYSE: F · Stock move
Ford Motor Company
Low valuation meets renewed North American tariff risk
Market data: Aug. 28, 2026, 16:03 EDT Dashboard: Aug. 30, 2026, 01:10 EDT
Close
$13.88
-0.50% Friday
Forward P/E
7.5x
$1.85 FY2026 EPS estimate
Target gap
+13.9%
$15.81 average target
Volume
40.25M
0.75x 65-day average
Market tape
Measure
Aug. 28
Ford
-0.50%
Automotive group
-1.78%
S&P 500
-0.25%
52-week range
$11.11-$17.78
Market value
$55.34B
Guidance bridge · FY2026
Ford Pro EBIT
$7.0-7.5B
Ford Blue EBIT
$5.0-5.5B
Model e EBIT
~-$4.0B
Adjusted FCF
$6.0-7.0B
Cash-flow valuation
The yield is attractive only if Ford converts guidance into cash after tariff, warranty and EV spending pressures.
Analyst setup
Indicator
Current
Consensus
Overweight
Buy / Overweight
8
Hold
13
Underweight / Sell
2
Target range
$11-$20
Fresh catalyst
U.S.-Canada trade talks stalled over autos. Washington has threatened 50% tariffs on Canadian vehicles and parts from Jan. 1, 2027. The dispute raises sourcing and production risk across North American supply chains.
TariffsCanadaParts costs
Next checkpoint
Oct. 28
Scheduled Q3 2026 earnings report
Q3 EPS estimate
$0.41
Three months ago
$0.37
Q2 adjusted EBIT
$2.5B
Quarter-end liquidity
$43.4B
Investor lens
Ford's 7.5x forward earnings multiple and double-digit guided cash-flow yield offer valuation support. The market is demanding proof that Ford Pro and Ford Blue can absorb Model e losses, special charges and renewed tariff pressure. A clean Q3 cash conversion would narrow that discount; weaker margins would justify it.
Nu Holdings dropped 3.9% on Friday to finish at $14.30, wiping out roughly $2.8 billion in market capitalization. Trading volume was 79.14 million shares.
·3 min read
nu
Nu Holdings NYSE: NU
Digital-bank growth meets a higher U.S. rate premium
Equities close: Aug. 28, 2026 · 16:00 EDT
Friday close
$14.30
−3.90% · day range $14.22–$14.91
Trading activity
79.14M
103% of 65-day average · liquid selloff
Equity-value change
−$2.8B
Approximate one-day loss from a $68.4B close
Valuation
19.5×
Trailing P/E · 24.7% below $18.98 high
Q2 operating engine
Revenue growth
+39%
Net income growth
+49%
Loan growth
+37%
Customer growth
139M
Metric
Q2 2026
Reference
Revenue
$5.88B
$5.60B est.
Net income
$1.06B
$967.2M est.
Risk-adjusted NIM
12.4%
9.9% Q2’25
Cost of credit
$1.69B
−9% QoQ
Monthly ARPAC
≈$17
up QoQ
Price-target map
Consensus: 18 Buy · 3 Hold · 1 Sell. The $10–$23 range signals unusually wide disagreement over credit and expansion costs.
What moved the stock
Fed Chair Kevin Warsh reinforced the inflation fight.
The dollar rose 0.66% against Brazil’s real.
Nu underperformed the S&P 500 by about 3.7 percentage points.
Volume was elevated, but not disorderly.
Signals for the next quarter
Support: risk-adjusted NIM at 12.4% and record profit.
Support: 83.5% activity rate and roughly $17 ARPAC.
Risk: 90+ day NPLs rose 35 basis points to 6.9%.
Risk: efficiency ratio increased to 19.5% from 17.6% QoQ.
Relevant listed set
NU: consumer digital bank across Latin America.
MELI: commerce-led fintech and credit ecosystem.
PAGS: Brazilian merchant acquiring and banking.
STNE: merchant acquiring and business software.
Investor bridge
Friday’s $2.8 billion value loss was mostly a discount-rate reset, not an earnings revision. The rerating survives only if Nu holds risk-adjusted margin near 12% while late delinquencies stabilize.
Klarna Group plc rose 1.21% on Friday after its chief executive acquired approximately $9.9 million in shares. The move puts insider confidence to the…
·3 min read
Klarna Group plc · NYSE: KLAR
CEO buying meets a reset valuation
Market data: August 28, 2026, 19:45:13 EDT · Financials: quarter ended June 30, 2026
Last price
$14.20
+1.21% Friday
Volume
11.94M
Friday session and late prints
CEO purchase
$9.9M
692,506 shares near $14.37
Implied market cap
$5.37B
Using nearly 378M shares
Operating snapshot
Metric
Q2 2026
Change / comparison
Revenue
$1.042B
+27% y/y
GMV
$36.6B
+18% y/y
Transaction margin dollars
$446M
+42% y/y
Adjusted operating income
$91M
vs $29M
Net income
$9M
vs -$53M
Credit-loss provisions / GMV
0.52%
Key risk gauge
2026 guidance and valuation
Revenue midpoint$4.12B
Adjusted operating income midpoint$290M
Market cap / revenue guide
1.30×
Market cap / adjusted OI guide
18.5×
CEO buy / adjusted OI guide
3.4%
Close vs $40 IPO price
-64.5%
Close vs CEO buy price
-1.2%
Price map
What matters next
Germany retail demand
Volume
U.S. GMV growth
+27%
Credit-loss rate
0.52%
Finance leadership transition
Execution
2026 adjusted OI range
$280–300M
Investor read: The insider purchase puts $14.37 on the chart as a visible confidence marker. The stock still needs guidance delivery, stable credit losses and better German demand to turn that signal into a durable rerating.
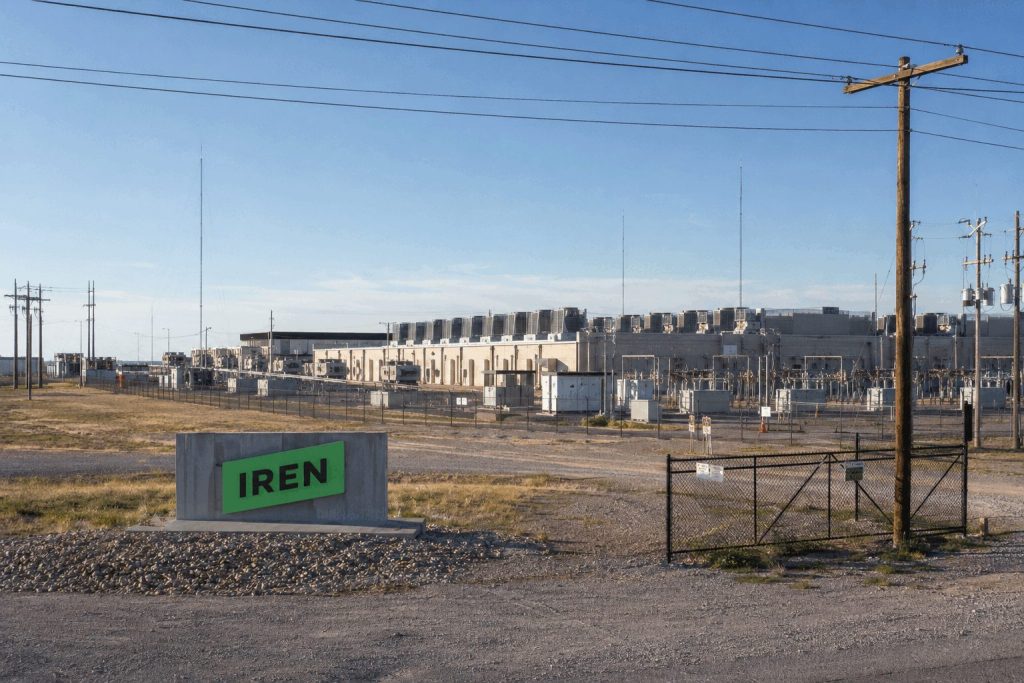
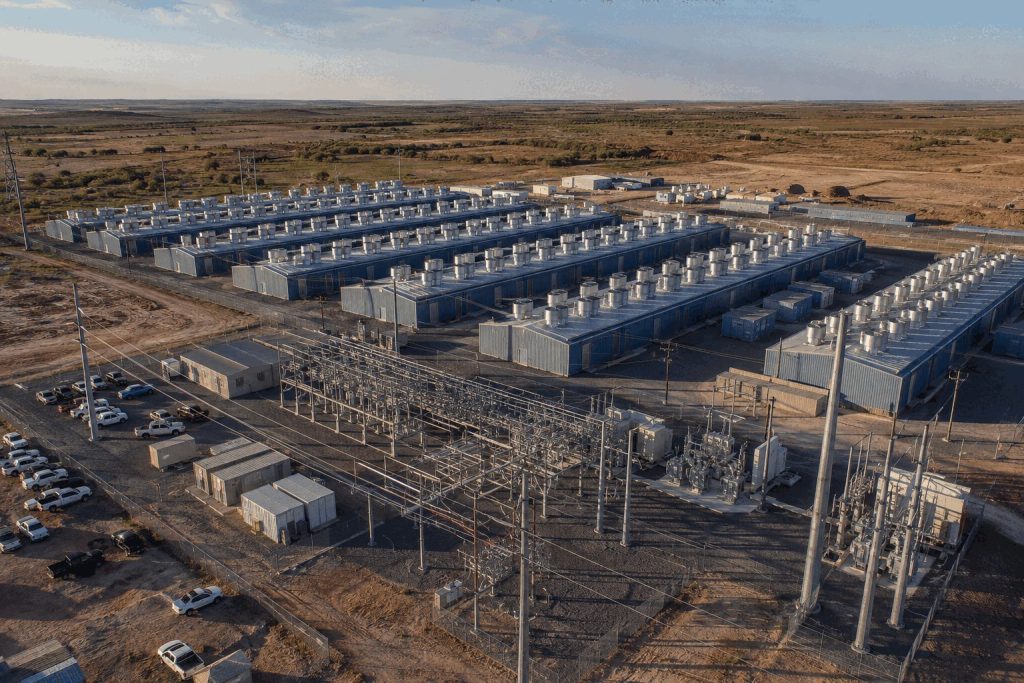
SYDNEY, August 29, 2026, 14:00. IREN shares dropped 12.5% after the company’s $30 billion capital expenditure raised concerns in light of its $4 billion…
·3 min read
IREN · NASDAQ:IREN
AI cloud ramp versus funding burden
Stock data: Aug. 28, 2026, 16:00 EDT Dashboard checked: Aug. 29, 2026, 14:00 EDT
Friday close
$35.45
▼ 12.53%
Friday volume
89.3M
Yahoo Most Active rank 5
Market value
≈$14.0B
≈$2.0B erased Friday
Analyst target
$78.19
+120.6% implied upside
Quarterly pivot
Metric
Q4 FY26
AI cloud revenue
$70.5M · +110% QoQ
Bitcoin mining revenue
$66.7M
Total revenue
$137.2M · −5% QoQ
Adjusted EBITDA
$19.2M · −68% QoQ
Net loss
−$684.0M
Full-year transition
Metric
FY26
AI cloud revenue
$128.8M vs $16.4M
Bitcoin mining revenue
$578.2M
Total revenue
$707.0M
Adjusted EBITDA margin
35% vs 54%
Non-cash impairments
$638.8M
Capital stack
Execution checklist
$4B contracted annualized AI revenue Only about $1B operational at the reporting point
Kailera Therapeutics Inc. fell 12.52% on Friday to $16.21. The stock finished at its session low after opening at $18.26. Volume reached 532,030 shares.
·3 min read
Kailera Therapeutics · NASDAQ: KLRA
Cash cushion, clinical wait
Market data: August 28, 2026 close, 16:00 EDT After-hours quote: August 28, 2026, 20:15 EDT
Regular close
$16.21
−12.52% · August 28 close
After hours
$16.43
+1.36% · 20:15 EDT
Market value
~$2.10B
129.64M shares × $16.21
Cash + securities
$1.172B
June 30, 2026 · 56% of market value
Friday reset versus key anchors
Close sits 1.3% above IPO priceCash/share equals 55.8% of close
What moved
No fresh Kailera filing or press release accompanied Friday's decline. The move exceeded a weak biotech tape.
Asset
Aug. 28
KLRA
−12.52%
XBI biotech ETF
−3.46%
Eli Lilly
−0.18%
Novo Nordisk ADR
−1.42%
Pipeline and capital clock
Program
Stage / scale
Next milestone
Investor issue
Ribupatide injection GLP-1/GIP dual
Three global Phase 3 trials; >4,700 participants
Global data in 2028
Largest valuation event; runway reaches stated timing
High-dose ribupatide
Phase 2b; 264 U.S. participants; fully enrolled
Mid-2027 data
Earlier efficacy and dose signal
Oral ribupatide
FDA IND active
Phase 3 starts in H1 2027
Oral convenience plus tolerability
KAI-7535
Global Phase 2; ~320 planned
2027 data
Lower start and slower titration test GI profile
KAI-4729
Planned Phase 1 tri-agonist
Start by end-2026; data 2027
Earlier-stage option value
Q2 R&D expense
$101.1M
Quarter ended June 30, 2026; +$81.5M year over year
Q2 net loss
$111.3M
Versus $28.9M in Q2 2025
Stated runway
Mid-2028
Company guidance dated August 12, 2026
Volume
532K
August 28 session; 10-day average about 602K
Valuation bridge
Equity value at $16.21
~$2.10B
Less cash and marketable securities
−$1.172B
Market value above cash
~$0.93B
Price / cash per share
1.79×
Cash and securities represent about 56% of equity value. This is not enterprise value; liabilities and other balance-sheet items are excluded.
Street expectations
$42.75
Average tracked target; five ratings; average recommendation Buy
Implied upside from $16.21
+164%
Targets are forecasts, not cash flows. Their range depends on clinical success and timing.
Watch list
Date
Event
What changes
Sep. 23–24, 2026
Bernstein Healthcare Forum
Possible trial-enrollment and capital-allocation detail
Sep. 28–Oct. 2, 2026
EASD meeting
Ribupatide injection-site and Hengrui metabolic data
2027
Three pipeline readouts / starts
First major tests of efficacy, tolerability and execution
Shares of FuboTV Inc. climbed 2.0% on Friday as an announced upgrade shifted ESPN and Fox Sports channels to 1080p resolution. This adjustment increases…
Market close: Aug. 28, 2026 · 16:00 EDT Dashboard checked: Aug. 28, 2026 · 21:58 EDT
Close
$10.30
+1.98%
Volume
813K
52% of 1.55M average
Market value
$1.12B
Google Finance
Analyst view
4 Buy
1 Hold · $17 mean target
Picture-quality jump
720p → 1080p
Reported for ESPN, ESPN2, FS1 and FS2.
Retention sensitivity
$7.4M
Estimated quarterly revenue preserved if 0.5% of 5.75M NA subscribers remain one extra quarter.
Operating bridge
Metric
Latest
Comparison
NA subscribers
5.75M
+2% YoY
NA revenue
$1.474B
~flat pro forma
Adjusted EBITDA
$19.1M
1.3% margin
Net loss
$(25.7)M
Improved from $(72.0)M pro forma
Cash and targets
Measure
Reading
Cash + restricted cash
$236.4M
FY2026 ending cash guide
≥$200M
Positive free cash flow
Expected FY2027
FY2028 adjusted EBITDA target
≥$300M
Sources: Fubo Q3 FY2026 release and SEC exhibit; Fubo pricing and 4K support; Google Finance; Cord Cutters News. The 0.5% retention case is an illustrative estimate, not company guidance. Monthly revenue run-rate uses quarter-end subscribers and includes advertising.
SAN FRANCISCO, August 28, 2026, 13:49 EDT - PagerDuty shares rose 9.9% after the company said a 15% cut to its workforce would boost…
·2 min read
NYSE: PD · earnings reaction
Margins move faster than revenue
PagerDuty's rally reflects confidence in cost discipline. The next test is whether a leaner organization can lift retention without weakening product delivery.
Market data: August 28, 2026, 13:35 EDT / 19:35 CEST
Share price
$13.88
+9.90% · about $99m value added
Q2 revenue
$124.4m
+0.8% year over year
Annual recurring revenue
$501m
Net retention: 98%
Free cash flow
$32.8m
26% of quarterly revenue
Profitability reset
Restructuring equation
Current headcount reduction
≈15%
Estimated charges
$5.5m–$7.5m
Most charges expected
Q3 FY27
Substantially complete
By Q4 FY27 end
Cash and investments
$470.0m
At the midpoint, restructuring charges equal about 20% of quarterly free cash flow.
Operating scorecard
Metric
Latest
GAAP operating income
$10.2m
Non-GAAP operating income
$29.5m
GAAP net income
$4.7m
Paid customers
15,506
Customers above $100k ARR
884
Q3 revenue midpoint
$124.0m
Valuation and analyst check
Retention98% net retention means existing-customer revenue still contracted.
GrowthQ3 revenue midpoint is slightly below the latest quarter.
ExecutionA 15% staff reduction can disrupt product delivery and support.
Accounting gapThe margin thesis leans heavily on non-GAAP measures.