Leokadia Głogulska is a financial and technology journalist at TechStock² covering listed companies, earnings, artificial intelligence and developments across European and global equity markets. She previously worked in financial analysis and graduated from Wrocław University of Economics and Business.
Novavax, Inc. announced that its partners secured regulatory clearance for the XFG-adapted Nuvaxovid vaccine in the United States, European Union and Japan. Shares dipped…
·3 min read
NASDAQ: NVAX · Product/commercial catalyst
Nuvaxovid XFG approval dashboard
Regulatory clearance is complete; royalties now depend on partner-led demand.
Market data: Aug. 28, 2026 11:58 EDT
Share price
$9.00
−0.55% vs. prior close
Market value
$1.48B
164.95M shares outstanding
Intraday range
$8.93–$9.28
Open: $9.18
Volume
1.16M
30% of 3.89M average
Commercial economics
Revenue channel
Economics
What changed
Sanofi royalties
High teens–low 20s % of global net sales
U.S. and EU seasonal approvals enable sales
Takeda
Royalties plus annual approval milestones
Japan approval supports 2026–2027 season
Sanofi supply
Recorded as product sales
Commercial supply planned this season
Technology transfer
$75M potential milestone
Expected mid-2027
2026 financial frame
Adjusted revenue
$235M–$275M
Excludes Sanofi supply sales, royalties and milestones.
Q2 cash
$724M
Versus $751M at Dec. 31, 2025
Quarterly operating signals
Q2 2026
Value
Year-over-year
Total revenue
$57M
−76%
Product sales
$19M
+76%
Net loss
$53M
vs. $107M profit
Net R&D expense
$48M
−34%
SG&A expense
$27M
−39%
Analyst range
Average target
$13.25
+47% from $9.00
High
$19.00
Low
$7.00
Ratings
2 Buy · 1 Hold · 1 Sell
Timeline and proof points
Aug. 27–28XFG-adapted Nuvaxovid clears the U.S., EU and Japan.2026–2027Sanofi broadens U.S. commercialization and launches in Germany, Canada and other markets.Seasonal reportsWatch partner sales, supply revenue and the first royalty disclosures.Mid-2027Manufacturing transfer could trigger a $75 million milestone.
Investor watch
Approvals remove regulatory risk, but the stock's muted reaction signals demand uncertainty. The core sensitivities are vaccine uptake, coverage policy, Sanofi execution and timing of royalty recognition. Management gives no Sanofi sales forecast.
Sources: Novavax Aug. 28 approval update and Aug. 6 financial results; Reuters Aug. 27 FDA report; Google Finance. Prices are delayed U.S. quotes at 11:58 EDT on Aug. 28, 2026.
FingerMotion, Inc. shares surged over threefold on Friday, following the announcement of a modular artificial-intelligence data-center plan with BlueFlare Energy Solutions. The move boosted…
·3 min read
FingerMotion / FNGR
The market priced an AI-infrastructure plan before contracts.
Market data: Aug. 28, 2026 11:26:07 EDT
Share price
$0.6272
+261.7%
Volume
855.35M
shares traded
Market cap
$38.44M
current implied value
Value added
≈$27.80M
versus prior implied cap
From concept to scale
1–2 MW initial module
→
10 MW next stage
→
20 MW larger site
Transaction and demand signals
Measure
Figure
Status
Lyken.AI ownership
9.9%
Acquired
FNGR shares issued
1,674,480
Restricted
Cash paid
$0
Equity-funded
B300 nodes
128
Nonbinding MOU
Execution checklist
Strategy announced with BlueFlare
Secure site control
Sign firm generation and fuel arrangements
Convert customer interest into binding offtake
Close asset-level project financing
Risk lens
The rally values execution that has not occurred. No site, power, customer or project-financing agreement is definitive. The Lyken customer memorandum is nonbinding. Equity consideration dilutes holders, while micro-cap liquidity can reverse quickly.
Illustrative milestone completion: strategy disclosed; four core contractual steps remain.
Sources: FingerMotion announcement and June 8-K; Aug. 28 filing summary; market data at 11:26:07 EDT. Implied prior market cap and value added are calculations from current market cap and the 261.7% price move. Not investment advice.
ASHBURN, Virginia, August 28, 2026, 07:51 — Shares in Quoin rose 41.8% after the company reported QRX003 achieved its primary endpoint, while a $50…
·3 min read
Quoin: endpoint signal, financing reset
QRX003 Phase 2/3 interim data · Market data at 07:34 EDT, August 28, 2026
Premarket price
$7.31
+41.8%
Premarket volume
6.87M
vs. 2.01M ADSs outstanding
Implied value added
~$4.3M
$2.15 × 2.01M ADSs
Interim responders
4 of 6
66.7%
Clinical signal: promising, not conclusive
Four patients achieved at least a one-grade IGA improvement. The study is open-label and plans about 20 evaluable participants.
Clinical timeline
Interim cutoff
6 patients
Treatment duration
12 weeks
Recruitment completion
End-2026
Full topline data
Q2 2027
Regulatory status
Investigational
QRX003 has U.S. Orphan Drug, Rare Pediatric Disease and Fast Track designations. None guarantees approval.
Financing mechanics
Security
Count
Price
ADSs / pre-funded equivalents
6.31M
$4.88
Ordinary warrants
3.15M
$6.10
Existing ADSs
2.01M
—
$30.8M upfront; another $19.2M depends on investors exercising warrants.
Ownership dilution map
Existing holders before placement
Existing holders after initial securities
Existing holders after full warrant exercise
Simplified ADS-equivalent calculation; excludes other outstanding options and warrants.
Why the stock moved
The trial crossed its adjusted statistical hurdle and reported no treatment-related serious adverse events. That improved the perceived probability of clinical success.
The financing simultaneously removed a near-term cash constraint. Yet the new ADS equivalents can make existing holders a much smaller share of the company.
Pricing tension
Premarket quote $7.31
Placement price $4.88 · 33.2% discount
Warrant exercise $6.10 · 16.6% below quote
Balance-sheet bridge
June cash + investments: $10.8MQ2 net loss: $5.37MUpfront raise: $30.8M
Management expects full financing proceeds to fund operations into the second half of 2029.
A positive interim endpoint can weaken or disappear as enrollment grows.
Sources: Quoin August 28 clinical and financing releases; June-quarter results; StockAnalysis premarket quote. Calculations use ADS equivalents and may differ due to rounding.
BioXcel Therapeutics Inc. dropped nearly 62% ahead of Friday's session following the company's decision to seek Chapter 11 bankruptcy protection. The move changes a…
·2 min read
BioXcel Therapeutics · NASDAQ: BTAI
Chapter 11 turns a pipeline valuation into a recovery waterfall.
Premarket: Aug. 28, 2026, 05:10 EDT Compiled: Aug. 28, 2026, 05:14 EDT
Premarket price$0.27−62.4%
Premarket volume~975KBefore the open
Estimated assets$10M–$50MChapter 11 petition
Estimated liabilities$100M–$500M2×–50× asset range
Claims scale versus disclosed assets
Assets: low
$10M
Assets: high
$50M
Liabilities: low
$100M
Liabilities: high
$500M
Equity bridge Even the lowest liability estimate is twice the highest disclosed asset estimate. Common shares receive value only after secured, priority and unsecured claims are satisfied.
Recovery waterfall
1Secured lenders Collateral and court-approved financing come first.
2Priority claims Administrative costs and eligible employee or tax claims.
3Unsecured creditors Recovery depends on asset-sale and plan value.
4Common equity Residual claim; cancellation or major dilution is possible.
Operating and liquidity snapshot
Commercial revenue remained small relative to losses. Before court protection, available cash represented roughly 1.5 quarters of the cited operating burn.
Next decision points
Voluntary Chapter 11 petition filed in Delaware.
Court considers cash management, employee payments and any debtor-in-possession financing.
Potential sale process, restructuring-support agreement or standalone plan.
Nasdaq and broker notices may change listing status, liquidity or trading access.
Sale proceeds and allowed claims determine whether equity receives anything.
Bear case Shares are canceled after proceeds fail to cover creditor claims.
Base case Assets are sold and recoveries accrue mainly to creditors.
Upside case A competitive bid materially exceeds disclosed asset expectations; equity still remains subordinate.
Shares of Elastic N.V. jumped 19.7% following an earnings report that surpassed expectations on Thursday. The rise boosted its market capitalization by roughly $1.7…
·2 min read
Elastic N.V. · NYSE: ESTC
Q1 FY2027 investor dashboard
After-hours snapshot · August 27, 2026, 18:30 EDT
$100.25
+$16.51 · +19.72% after hours
$478M
Q1 revenue
+15% year over year
$1.153B
Current RPO
+21% year over year
$143.3M
Adjusted free cash flow
+23.5% year over year
1,800+
Customers above $100K ACV
+16.1% versus Q1 FY2026 floor
Two-stage stock move
Estimated equity-value change: about $1.7 billion after hours, using 103.95 million shares outstanding. Extended-hours liquidity can amplify moves.
Beat and outlook
Adjusted EPS$0.70 vs $0.58 est.
Revenue$478M vs ~$470M est.
Q2 revenue midpoint$486.5M vs ~$483M est.
FY2027 revenue midpoint$2.004B
FY2027 adj. operating margin~19.4%
FY2027 adj. FCF margin~21.5%
Operating scorecard
Metric
Q1 FY2027
Change / reference
Total subscription revenue
$449M
+15%
Sales-led subscription revenue
$399M
+18%
Total RPO
$1.854B
+27%
Net expansion rate
~111%
Stable expansion signal
Non-GAAP operating margin
16.2%
$77M income
GAAP operating margin
-5.0%
$24M loss
Valuation and expectations
After-hours price$100.25
52-week regular-session high$96.07
Pre-report analyst consensusBUY
Average target$89.50
After-hours premium to target+12.0%
Consensus: 24 analysts. Targets may reset after the earnings release.
Investor read-through
Demand: cRPO growth of 21% and a record quarterly addition of large customers strengthen revenue visibility.
Quality: adjusted free cash flow rose faster than revenue, reaching a 30% quarterly margin.
Risk: the new price exceeds the pre-report target and Elastic still posted a GAAP operating loss. Thin after-hours trading can reverse.
Sources: Elastic Q1 FY2027 earnings release; Public.com after-hours and analyst data; MarketWatch quote; FactSet estimates reported by Investor’s Business Daily. Figures are as reported or calculated from cited data and are not investment advice.
Hyperliquid Strategies shares jumped on Thursday after the crypto treasury company reported $305.5 million of annual net income. Most of that profit came from…
CAMBRIDGE, Massachusetts, August 27, 2026, 10:15 Moderna stock slid 5.0% on Thursday, shaving $3.0 billion off its market value, after the company announced a…
·3 min read
Moderna, Inc. · NASDAQ: MRNA
Convertible financing resets the rally math
Intraday snapshot: August 27, 2026, 10:15:13 EDT
U.S. regular session
Share price
$142.20
−$7.46 · −4.98%
Market cap
$56.54B
Implied loss: ~$2.97B
Base notes
$2.0B
Up to $2.3B with option
Trading activity
7.34M
Shares by 10:15 EDT
Session path
The stock recovered from its session low but remained 5.0% below Wednesday’s close.
Investor bridge
Equity value lost / base notes
1.48×
Base notes / June liquidity
28.9%
The market erased about $2.97 billion while Moderna proposed $2.0 billion of base financing.
Financing terms
Term
Current disclosure
Security
Senior unsecured convertible notes
Maturity
2032
Regular interest
None
Purchaser option
$300M for 13 days
Settlement
Cash, shares or both
Capped-call threshold
At least 150% premium at pricing
Liquidity and burn
Metric
Amount
Read-through
Cash + investments
$6.9B
June 30
Q2 operating cash outflow
$526M
Base notes = 3.8×
Q2 net loss
$782M
Base notes = 2.6×
July settlement payment
$950M
Post-quarter cash use
2026 year-end cash guide
$4.7B–$5.2B
Before new deal update
Catalyst timeline
July 31 · Q2 resultsRevenue $145M; net loss $782M; year-end cash guidance improved to $4.7B–$5.2B.
August 19 · Melanoma Phase 3Positive recurrence-free and distant-metastasis-free survival results drove a sharp pipeline revaluation.
August 27 · Convertible proposal$2.0B base deal, plus $300M option; pricing and conversion terms remain pending.
Analyst expectations
Consensus
Hold
23 analysts · average target $104.53
−26.5% versus $142.20
Target dispersion is wide after the oncology-data rally. The financing terms now add a separate dilution and balance-sheet variable.
What the stock is pricing
The financing converts part of the recent oncology revaluation into liquidity. No regular coupon limits cash interest, but conversion can expand the share count. The capped call only protects up to its final cap.
Next checks
Pricing: conversion rate, premium and net proceeds. Hedging: capped-call cost and counterparties’ trading. Use of funds: oncology investment versus debt repayment. Risk trigger: weaker clinical or regulatory progress after leverage rises.
Sources: Moderna August 27 financing announcement; Moderna July 31 quarterly results; Google Finance; MarketScreener. Calculations use the $142.20 share price and $56.54 billion market capitalization observed at 10:15:13 EDT on August 27, 2026. Values are rounded.
Volato Group, Inc. jumped 55.31% on Wednesday as the firm announced a merger with Alignment Engine. The private AI-infrastructure company was valued at about…
·3 min read
Volato Group · NYSE American: SOAR
$500M deal meets a $13M equity base
Alignment Engine merger · AI infrastructure · Ohio powered campus
Market snapshot: August 27, 2026, 08:18 EDT Financials: quarter ended June 30, 2026
August 26 close
$0.2429
+55.31% at 16:00 EDT
Premarket
$0.20
−17.21% at 08:08 EDT, August 27
Volume
779.55M
19.9× the 65-day average · August 26 close
Quoted market value
$13.03M
August 26 close
Transaction scale
The $4.6M market-value gain was less than 1% of the transaction valuation. Preferred-stock terms decide how much value reaches existing common holders.
Powered-campus runway
Operating baseline
Metric
Figure
Signal
Q2 revenue
$0.965M
Small base
Q2 net loss
−$2.051M
Loss exceeds revenue
Cash
$8.440M
June 30
H1 operating cash use
−$2.855M
Funding need remains
H1 financing cash
+$6.953M
Mostly equity-linked
Analyst consensus
None
Zero current ratings
Common-share expansion
Deal path
Aug. 26Definitive merger announced; Alignment Engine valued near $500M.ClosingExpected shortly after signing, subject to customary conditions.After closingSOAR remains the public parent; preferred conversion needs shareholder action.Next filingWatch the exchange ratio, preferred rights, financing and pro forma ownership.
What can break the thesis
Ownership
Undisclosed conversion economics can dilute common holders.
Funding
Campus buildout costs and capital sources remain undisclosed.
Commercial proof
No campus customers, revenue or contracted backlog were reported.
Execution
The path from 154 MW to 480 MW needs permits, equipment and financing.
Liquidity
Extreme turnover and the premarket reversal imply high volatility.
PLEASANTON, California, August 26, 2026, 17:41 EDT — Veeva Systems advanced 8.2%, adding $3.3 billion in market capitalization, after the company raised its sales…
India's family-SUV market gets two hybrid options with MG's Hector Tomahawk. The brand's battery-rental scheme further shifts car ownership costs towards a subscription model.
·3 min read
Product / commercial catalyst · SHA:600104
MG Hector Tomahawk: price, range and SAIC exposure
Product data: Aug. 26, 2026, 23:20 IST SAIC close: Aug. 26, 2026, 15:00 CST
EV price
₹1.95m
BaaS: ₹1.40m
EV range
517km
69.2kWh · 150kW
PHEV price
₹2.57m
BaaS: ₹2.18m
SAIC close
CN¥10.39
▲ 0.78%
Two electrified offers
Metric
EV
PHEV
Battery
69.2kWh
20.5kWh
Electric range
517km
115km
Combined range
—
1,100km+
BaaS rental
₹4.90/km
₹3.20/km
Delivery start
September
November
Upfront discount versus recurring cost
EV BaaS cuts entry cost 28.2%; PHEV BaaS cuts it 15.2%. At 10,000km per year, rentals add ₹49,000 and ₹32,000.
SAIC / India financial bridge
JSW MG 2025 sales
70,500 vehicles
Growth vs. 2024
+15.6%
Current annual capacity
120,000
Planned annual capacity
300,000
Planned investment
$330m–$440m
FY2025 venture loss
$121m
One percentage point of planned capacity equals 3,000 vehicles. Tomahawk needs sustained deliveries to raise utilization and dilute fixed costs.
SAIC market snapshot
Close / daily move
CN¥10.39 / +0.78%
Volume
32.57m shares
Market value
CN¥117.79bn
Trailing revenue
CN¥655.8bn
Trailing net income
CN¥10.11bn
Trailing P/E
11.6×
Next earnings date
Aug. 29, 2026
What to watch
Checkpoint
Timing
Signal
EV registrations
September
Search interest converting into paid deliveries
PHEV handovers
November
Demand for long-range hybrid packaging
Localization
2026–2027
Lower FX and freight exposure
Capacity ramp
Multi-year
Utilization against 300,000-unit target
Bull case
BaaS lowers the upfront barrier without eliminating lifetime revenue.
ADAPT spreads engineering across EV and hybrid variants.
India vehicle sales can grow into planned capacity.
Risks
Introductory prices cover limited volumes. Rentals may deter high-mileage drivers. Domestic rivals, charging gaps, continuing venture losses and India-China investment restrictions can slow returns.
Bath & Body Works shares pointed down after the company’s quarterly outperformance was largely driven by a tariff refund. Bath & Body Works, Inc.…
·3 min read
NYSE: BBWI · Q2 2026
Bath & Body Works investor dashboard
Premarket snapshot: August 26, 2026, 07:12 EDT · Earnings data: quarter ended August 1, 2026
Premarket price
$17.27
−1.82% from Tuesday's $17.58 close; about $63 million of equity value lost
Q2 net sales
$1.514B
−2.3% YoY; roughly $11 million above the top of company guidance
Adjusted EPS
$0.62
$0.31 without the $80 million tariff refund
FY26 free cash flow
~$650M
+$50 million versus the May outlook
Where the sales moved
Stores still generated 74.7% of quarterly revenue. Direct and international growth offset about 46% of the $65 million store-sales decline.
The $80 million earnings bridge
Ex-refundReported
Guidance: higher EPS, smaller sales change
FY26 metric
May 27
Aug. 26
Change
Net-sales growth
−4.5% to −2.5%
−4.0% to −2.5%
Low end +0.5 pt
Adjusted EPS
$2.40-$2.65
$2.60-$2.80
Midpoint +6.9%
Adjusted gross margin
~42.4%
~43.3%
+90 bps
Free cash flow
~$600M
~$650M
+$50M
Capital spending
~$270M
~$240M
−$30M
Valuation at the premarket indication
Equity value
~$3.48B
FY26 adjusted P/E
~6.4× midpoint
FY26 free-cash-flow yield
~18.7%
Annual dividend yield
~4.6%
52-week range
$14.28-$32.32
Calculated with $17.27, 201.56 million shares, $2.70 adjusted EPS midpoint and $650 million free-cash-flow guidance. No repurchases are assumed in management's outlook.
Analyst map
Date
Firm
View
Target
Aug. 19
Telsey
Hold
$22
Aug. 18
JPMorgan
Neutral
$24
Aug. 18
Citi
Buy
$25
Jul. 8
Goldman Sachs
Sell
$19
Consensus: Hold from 18 analysts; average target $25.33. Targets may change after the earnings call.
What matters next
Management conference call. Watch the refund accounting, promotion cadence and digital contribution.
Sales guide: −5.0% to −2.5%. Adjusted EPS guide: $0.07-$0.12 versus $0.35 last year.
Cost-savings expectation: about $200 million, $25 million above the initial target.
Management's stated horizon for a more material transformation benefit.
Investor read-through
The report beat the company's guidance even after removing the refund. The valuation question is whether direct and international growth can offset a store channel that still supplies three-quarters of sales. The third-quarter guide keeps that test unresolved.
Sources: Bath & Body Works Q2 2026 earnings release and presentation; Yahoo Finance quotation at 07:12 EDT; StockAnalysis analyst record. Price data are indicative and may be delayed. Calculations are derived from disclosed inputs and rounded.
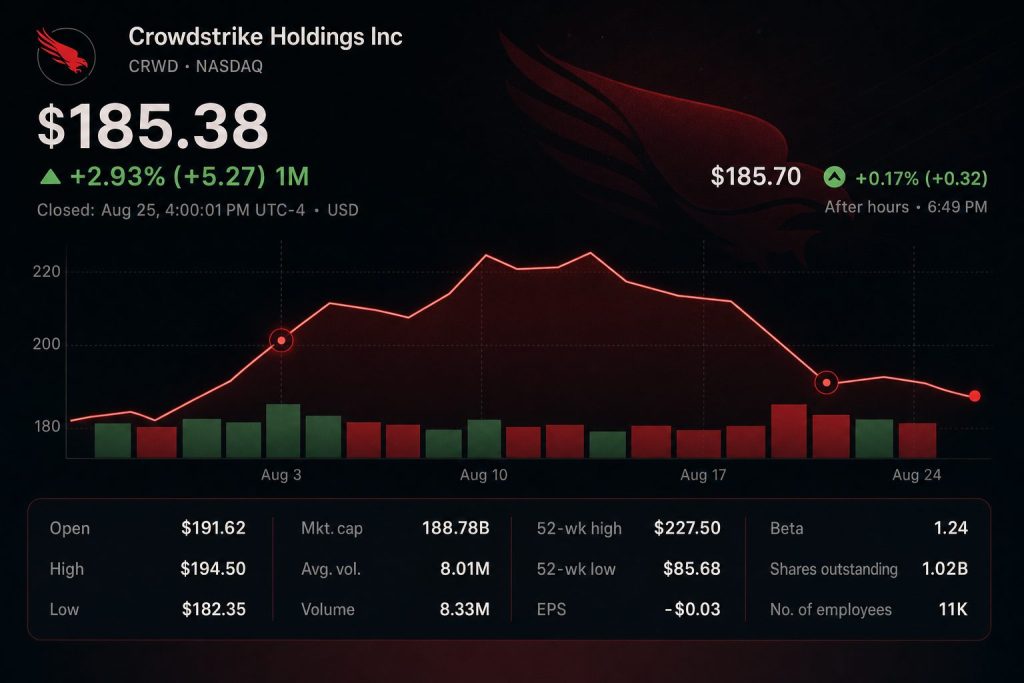
CrowdStrike Holdings, Inc. slipped 2.78% to $185.38 on Tuesday. The cybersecurity firm lagged a 0.66% gain in the Nasdaq Composite ahead of its fiscal…
·3 min read
NASDAQ: CRWD • Earnings setup
CrowdStrike’s $15.1 billion test
The options market expects a move more than ten times expected quarterly revenue.
Market data through August 25, 2026 18:40 EDT / August 26, 00:40 CEST
Regular close
$185.38
−2.78% • −$5.30
Options-implied move
±8.0%
±$14.83 per share
Implied equity swing
$15.1B
Using $188.76B market value
Expected Q2 revenue
$1.44B
About +23% year over year
What the options market prices
The range is based on Tuesday’s close and an 8% options-implied move through week-end. It describes expected volatility, not a forecast of direction.
Q2 hurdles
Metric
Reference
Investor test
Revenue
$1.436B–$1.442B
Hold or beat midpoint
Adjusted EPS
$0.29 estimate
Post-split basis
ARR
$5.793B–$5.795B
Fresh bookings matter
Non-GAAP operating income
$345.6M–$349.1M
About 24.1% margin
ARR bridge
Q1 ARR
$5.51B
Q2 midpoint
$5.794B
Implied add
~$284M
Q1 net add
$255.8M
The Q2 midpoint implies roughly 11% more net new ARR than Q1. Reported balance rounding makes this calculation approximate.
Cybersecurity peer tape
Company
Aug. 25 close
Daily move
Forward P/E
Analyst target upside
CrowdStrikeCRWD
$185.38
−2.78%
146.1×
+13.6%
Palo Alto Networks PANW
$339.90
−3.13%
89.6×
+6.7%
Zscaler ZS
$168.42
−4.34%
39.7×
+18.0%
Fortinet FTNT
$153.66
+1.10%
43.4×
+4.7%
Peer weakness makes earnings-specific attribution difficult. CrowdStrike’s premium multiple raises the bar for guidance and contracted subscription growth.
Decision map
Bull caseARR clears $5.795B, net new ARR beats the roughly $284M implied level, and the operating-margin outlook expands.
Neutral caseRevenue meets the $1.439B midpoint while bookings and guidance remain within management’s existing ranges.
Bear caseARR falls below $5.793B or forward guidance softens, putting the $170.55 options boundary in focus.
Risk lens
The options range can overstate or understate the actual reaction. A headline revenue beat may not support the shares if ARR, net new bookings or guidance disappoint. Conversely, stronger contracted revenue and margins could outweigh a modest earnings miss. The after-hours market is also thinner than the regular session.
EHang Holdings Limited dropped 9.90% to $4.68 on Tuesday. The autonomous aircraft manufacturer pulled its 2026 revenue outlook following a significant quarterly sales miss.
·3 min read
EHang Holdings · NASDAQ: EH
The guidance reset lands near a 52-week low
Market snapshot: August 25, 2026, 14:48 EDT · Regular session
$4.68−9.90% · −$0.51
$355.3M
Market capitalization
2.27M
Volume · 3.44× average
≈$39M
Quoted value erased
RMB600M
2026 revenue guidance withdrawn
Revenue bridge
Q1 plus Q2 revenue totaled RMB103.6M. Reaching the former target would have required RMB496.4M in the second half, or RMB248.2M per quarter—3.19× Q2 revenue.
Share-price position
2.4%
Above the $4.57 52-week low
52-week range: $4.57–$20.20. The stock is 76.8% below the high.
Day range $4.57–$5.25
Tuesday's low matched the 52-week floor.
Operating scorecard
Metric
Q2 2026
Comparison
Revenue
RMB77.9M
+203.5% QoQ; −31.3% YoY
eVTOL deliveries
36
4 QoQ; 52 YoY
Gross margin
61.2%
61.5% YoY
Operating loss
RMB131.7M
169% of revenue
Cash and investments
RMB929.4M
≈7 quarters of Q2 operating loss
Analyst range
View
Target
High
$11.10
Average
$7.12
BofA · Sell · Aug. 25
$5.10
Low
$4.40
Five ratings: 1 Buy, 2 Hold, 2 Sell.
Same-session eVTOL comparison
Stock
Snapshot
Move
EHang
14:48 EDT
−9.90%
Archer Aviation
13:35 EDT
−1.56%
Joby Aviation
13:13 EDT
+0.97%
The gap points to a company-specific earnings and guidance shock, not a broad eVTOL selloff.
Commercialization read-through
EHang delivered 35 EH216-series aircraft and one VT35. It also sold 520 GD4.0 formation drones. Broader products diversify revenue, but passenger approvals remain the central valuation driver.
Q2 aircraft deliveries were 69.2% of the year-earlier level.
Trial operations at Guangzhou and Hefei have run for 17 months. Management now needs regulatory visibility sufficient to restore a measurable sales forecast.
Catalyst timeline
Late JuneChina light-aircraft accident prompts greater regulatory caution.
August 7BofA double-downgrades EHang and cuts forecasts.
August 25Revenue misses; RMB600M guidance is withdrawn.
Next resetReplacement guidance or clearer passenger-service approvals.
Risk monitor
Regulatory delays can push paid passenger service further out, weaken aircraft deliveries and extend cash consumption. The 61.2% gross margin does not offset an operating loss larger than revenue. Upside requires evidence that overseas sandboxes and non-passenger products can bridge the missing China approval schedule.
Sources: EHang Q2 release dated August 25, 2026; Google Finance market and analyst data captured August 25, 2026; same-session Joby and Archer snapshots captured between 13:13 and 13:35 EDT. Calculations use displayed figures and may differ because of rounding.