NASDAQ:GPROStock Market
GoPro shares surge 46% following 8.5% acquisition by Markiplier
Shares of GoPro Inc. soared 46.1% on Monday. The stock continued to climb in after-hours trading, gaining an additional 55.4% to reach $1.3615 as…
Technology
Shares of GoPro Inc. soared 46.1% on Monday. The stock continued to climb in after-hours trading, gaining an additional 55.4% to reach $1.3615 as of 17:54 EDT.
All coverage
Shares of GoPro Inc. soared 46.1% on Monday. The stock continued to climb in after-hours trading, gaining an additional 55.4% to reach $1.3615 as…
USD per share; regular trading and aftermarket
As of . Source: Yahoo Finance; five-minute observations, not live streaming.
Different measures and dates: Markiplier's Class A stake reflects the July 13 event reported August 20; Woodman's voting power is calculated from March 31 holdings and the 10-for-1 Class B vote. Sources: Schedule 13G and GoPro proxy.
Quarter ended June 30, 2026. GAAP unless stated. Source: GoPro earnings release filed with the SEC.
SAN FRANCISCO, August 31, 2026, 16:43 EDT — Uber Technologies shares declined 4% after Delivery Hero's announced deal premium of 13% underscored concerns about…
Delivery Hero spread, funding load and earnings capacity
| Metric | Level | YoY |
|---|---|---|
| Trips | 3.9B | +18% |
| Gross bookings | $58.0B | +24% |
| Revenue | $14.2B | +12% |
| GAAP operating income | $1.9B | +30% |
| Adjusted EBITDA | $2.8B | +33% |
| Free cash flow | $2.8B | quarter |
AUSTIN, Texas, August 31, 2026, 15:12 EDT — Tesla shares advanced by nearly 5% on Monday following the release of a federal crash report…
Snapshot: August 31, 2026 · 15:12 EDT
| Item | Reading |
|---|---|
| Crash report | Fatal, May 2026 |
| ADAS status | Verified engaged |
| Pre-crash speed | 104 mph |
| Causation | Not established |
| Q2 metric | Result |
|---|---|
| Revenue | $28.24B, +26% |
| FSD subscriptions | 1.48M, +56% |
| Operating margin | 1.4% |
| Free cash flow | -$1.09B |
FSD subscription growth can improve recurring software revenue and margins. Safety investigations can delay rollout, add compliance cost and weaken adoption. With the stock valued at roughly 183 times forward earnings, regulatory and execution outcomes have an outsized effect on fair value.
Watch: NHTSA EA26002 updates · supervised FSD miles and interventions · subscription growth · operating-margin conversion.
Shares of Broadcom Inc. rose 0.8% on Monday, with investors bracing ahead of a tough earnings challenge. At 14:33 EDT, the stock changed hands…
| Revenue | $29.4B |
| Adjusted EPS consensus | $3.24 |
| AI semiconductor target | $16.0B |
| Adjusted EBITDA guide | 68% of sales |
| Non-GAAP operating income | 67% of sales |
| Metric | Value | YoY |
|---|---|---|
| Semiconductor solutions | $15.01B | +79% |
| Infrastructure software | $7.18B | +9% |
| AI semiconductors | $10.80B | +143% |
| Free cash flow | $10.26B | +60% |
| Adjusted EBITDA | $15.24B | +52% |
The earnings debate turns on whether a 54.4% AI revenue mix can preserve Broadcom's cash conversion while supporting a roughly 15× annualized-sales valuation. A clean beat must include the $13.4B non-AI remainder, not only accelerators.
Risks: advanced-node supply, hyperscaler concentration, custom-silicon and networking competition, VMware execution, and valuation sensitivity.
Take-Two Interactive Software dropped 7.5% to $217.70 in early trading Monday. The decline wiped out gains from Friday’s reveal and reduced the company’s market…
| Item | Figure | Investor signal |
|---|---|---|
| Standard edition | $79.99 | Higher base price |
| Ultimate edition | $99.99 | $20 premium |
| GTA V sell-in | >230M units | Franchise reach |
| GTA spending, Q1 | +3% | Legacy monetization |
| Metric | Figure | Reading |
|---|---|---|
| Q1 bookings | $1.39B | Above guidance |
| Rockstar FY27 mix | 37% | ≈$3.0B implied |
| Operating cash flow | >$1B | Launch-year conversion |
| Mobile bookings | -7% | Offsetting weakness |
Leaks have shifted the near-term debate from trailer demand to release control. The valuation bridge requires November delivery, premium-edition conversion and sustained GTA spending. Delay, piracy or weaker mobile results would push more value beyond fiscal 2027.
Sources: Rockstar Games; Take-Two fiscal Q1 2027 investor presentation; Google Finance; Investing.com. Time-sensitive figures carry their source timestamp. Derived figures use the $8.1B guidance midpoint.
Shares of CrowdStrike Holdings rose 4.0% on Monday. The stock was priced at $227.22 at 11:23 ET, close to its session high.
NASDAQ: CRWD · Fiscal Q2 2027 results
Net new ARR accelerated fastest, reaching a record $332.8 million.
| FY27 revenue midpoint | $6.001bn |
| Price / guided revenue | 39.6× |
| Price / guided ARR | 35.9× |
| Annualized Q2 FCF yield | 0.6% |
| Consensus target spread | +0.9% |
The operating performance is strong; the debate is how much is already priced in.
| Metric | Q2 FY27 | YoY |
|---|---|---|
| Revenue | $1.471bn | +26% |
| Subscription revenue | $1.400bn | +27% |
| Free cash flow | $377.4m | +33% |
| GAAP operating margin | -2.3% | +6.8 pts |
| Non-GAAP operating margin | 25.3% | +3.5 pts |
Sales cycles can lengthen. Competition may pressure growth or pricing. Product defects and litigation tied to the July 2024 incident remain material risks.
Valuation sensitivity: high. The stock trades near the average analyst target.
| Checkpoint | Company guide | Investor read-through |
|---|---|---|
| Q3 FY27 revenue | $1.523bn–$1.529bn | Tests whether 26% growth persists |
| Q3 ending ARR | $6.184bn–$6.188bn | Measures AI-security demand conversion |
| FY27 non-GAAP operating income | $1.497bn–$1.508bn | Tests operating leverage |
Sources: CrowdStrike investor relations; Investopedia; MarketScreener; market quotes timestamped above.
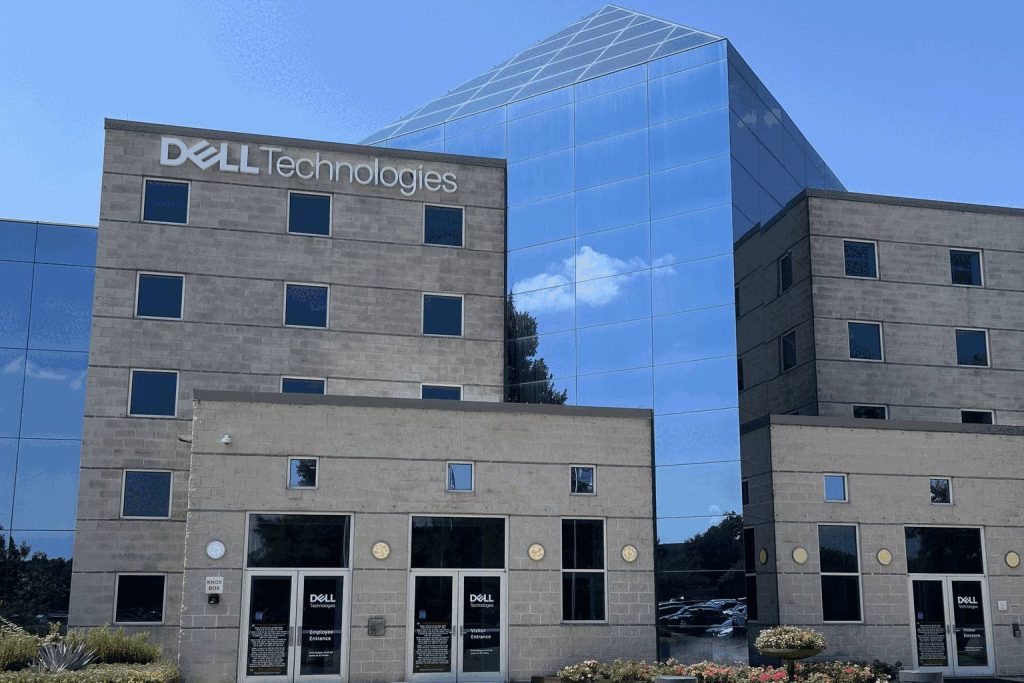
Dell Technologies gained 0.96% to $460.64 as of 10:50 EDT. Market participants are anticipating an approximately 10% swing following Tuesday’s earnings report.
| Metric | Estimate | Growth |
|---|---|---|
| Q2 revenue | $45.19B | ~+52% |
| Q2 adjusted EPS | $4.91 | ~+112% |
| Q1 revenue | $43.84B | +88% |
| Q1 adjusted EPS | $4.86 | $2.94 prior estimate |
$60B
$167B
AI servers equal about 36% of midpoint revenue, increasing exposure to accelerator costs and large orders.
| Company | Price | Session | Market value | Trailing P/E |
|---|---|---|---|---|
| Dell | $460.64 | +0.96% | $302.2B | 36.7× |
| HPE | $52.33 | +0.04% | $74.9B | 48.0× |
| HP Inc. | $30.27 | -0.84% | $28.1B | 11.6× |
Low target · options downside · current · average target · high target.
A revenue beat is largely expected. The stronger signal would be higher full-year profit guidance with stable margins. Misses on AI-server mix, customer timing or component costs could trigger the full implied downside.
Catalyst: fiscal Q2 results, September 1, 2026, after the closing bell.
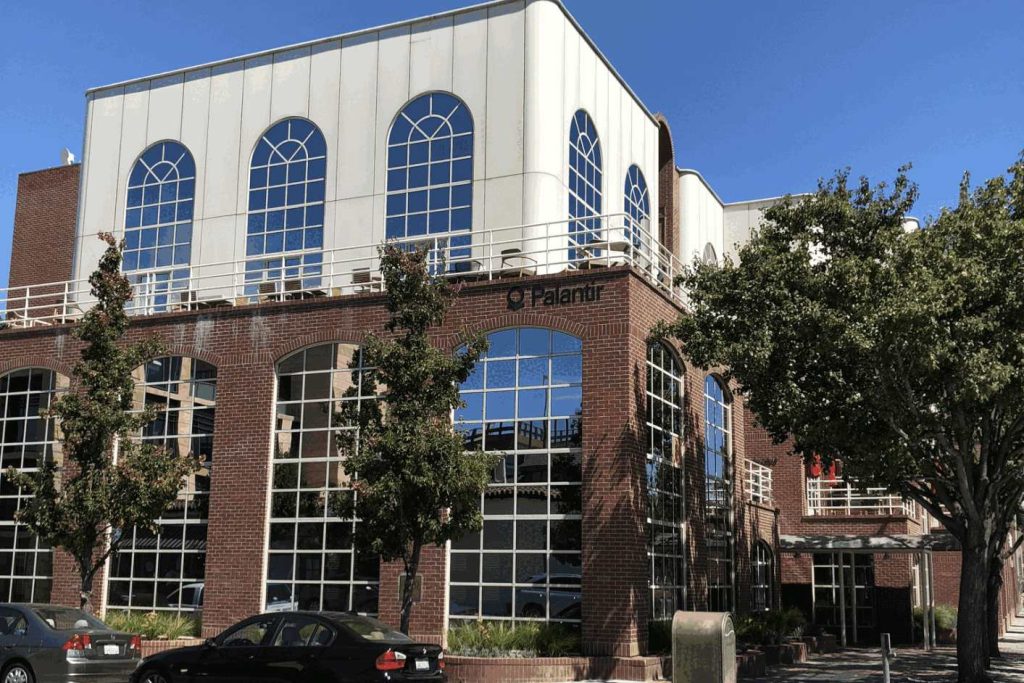
Palantir Technologies dropped 0.45% to $185.45 as of 10:36 EDT. Palantir's stock lagged behind Nvidia even though the company posted quicker revenue growth.
| Company | Price | Move | Market cap | P/E |
|---|---|---|---|---|
| Palantir | $185.45 | -0.45% | $476.4B | 158.5× |
| Nvidia | $220.38 | +1.30% | $5.35T | 27.7× |
PLTR’s multiple premium is 473%, despite Nvidia’s much larger earnings base.
Intraday range: $183.05-$186.72. Volume: 5.30M shares versus 41.88M average.
| Metric | Current | Growth / comparison | Investor read |
|---|---|---|---|
| Q2 revenue | $1.94B | +93% YoY | Scale is accelerating |
| U.S. government | $809M | +90% | Defense demand remains strong |
| FY revenue guide | $8.150-$8.158B | ~+82% | 58× guided sales at current cap |
| U.S. commercial guide | >$3.424B | ~+134% | Primary growth driver |
| Q3 revenue guide | $2.160-$2.164B | 8.1% above prior consensus | Next execution hurdle |
Google Finance: 17 Buy, 4 Hold, 2 Sell. MarketScreener: 32 analysts, Buy consensus.
Contract timing can distort quarterly growth. European resistance may limit international expansion. Palantir also needs sustained margin and cash-flow execution to support a 158.5× earnings multiple.
Near-term checkpoint: Q3 revenue versus the $2.160-$2.164B company range.
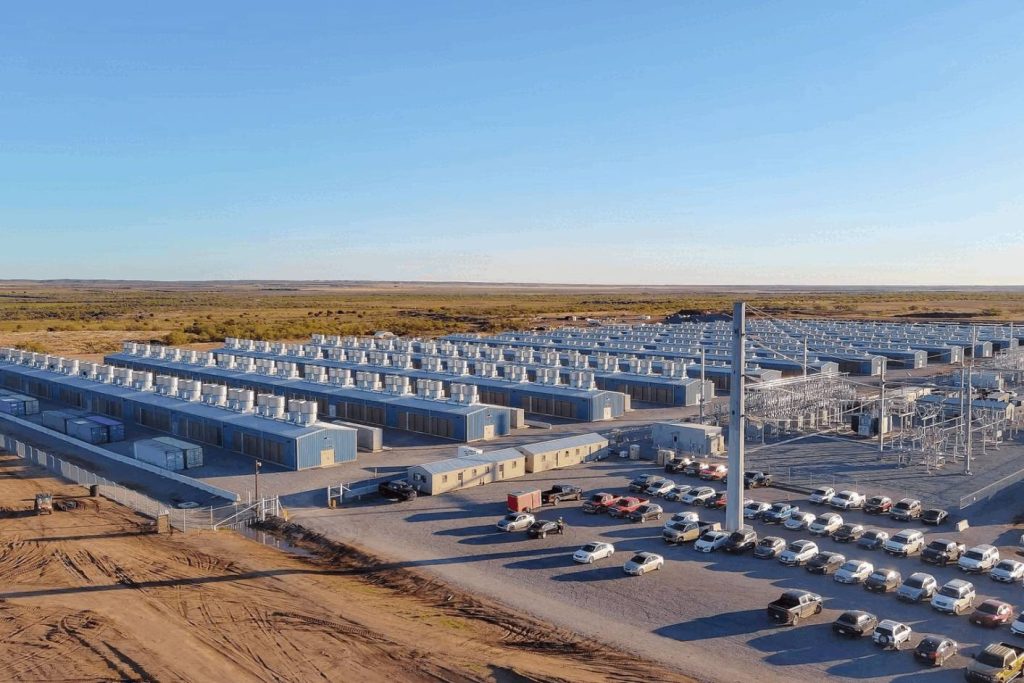
IREN Limited shares climbed 2.7% to $36.42 as of 10:00 EDT Monday. The rise comes after a 12.5% drop in response to earnings on…
Market data: August 31, 2026, 10:00 EDT · Financials: FY2026
Friday: -12.53%.
Approximation using 394.1M shares.
+685% in FY2026.
Of float, August 14.
| Metric | FY25 | FY26 | Move |
|---|---|---|---|
| AI Cloud | $16.4M | $128.8M | +685% |
| Bitcoin mining | $484.6M | $578.2M | +19% |
| Total revenue | $501.0M | $707.0M | +41% |
| Adjusted EBITDA | $269.7M | $245.7M | -9% |
| Monday 10:00 price | $36.42 |
| Friday volume | 89.9M |
| 65-day average | 45.6M |
| 52-week high | $76.87 |
| Average analyst target | $81.57 |
| Analyst target upside | 124% |
| FY2026 net loss | -$702.6M |
| Non-cash impairments/transition | $638.8M |
| Adjusted EBITDA | $245.7M |
| Adjusted EBITDA margin | 34.8% |
| Price / FY2026 revenue | 20.3× |
| Contracted share of target ARR | ~85% |
IREN’s AI Cloud revenue grew almost eightfold, and contracted awards support a year-end run-rate target above $4 billion. The stock still prices in a large delivery gap: current annual revenue is $707 million, adjusted EBITDA fell 9%, and construction plus GPU financing must precede revenue recognition.
Watch customer acceptance, construction milestones, GPU deliveries, financing costs, Bitcoin-linked cash flow and margin conversion. With 30.6% short interest, failed milestones can produce outsized downside.
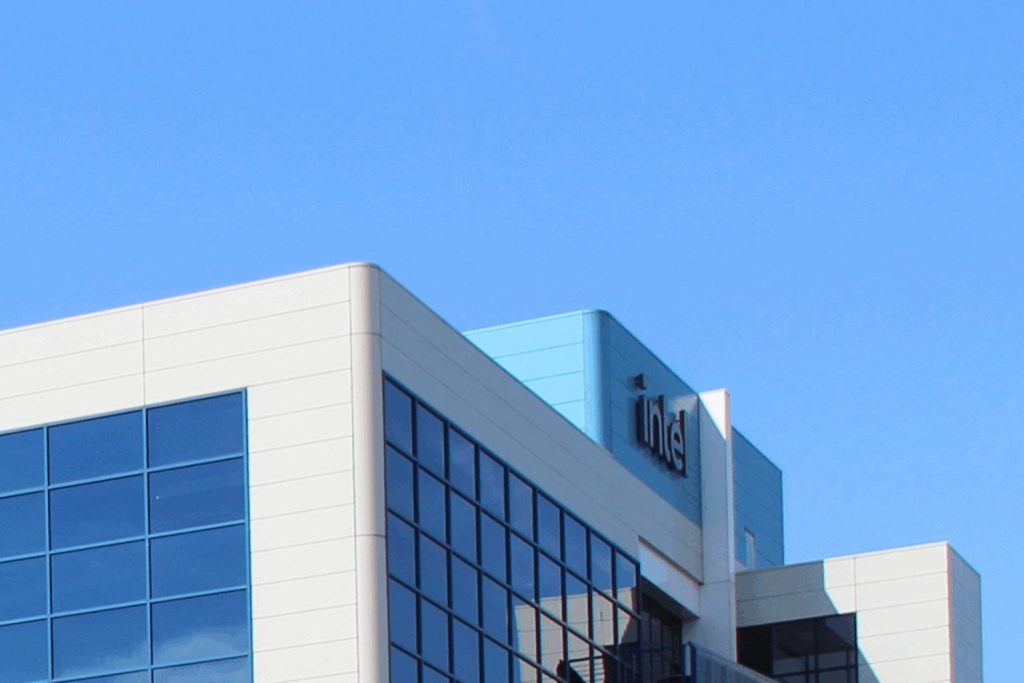
Intel Corporation climbed 0.3% to $89.74 in premarket trading on Monday. Chipmakers saw modest gains as they rebounded after losses at the end of…
| Base shares issued | 210.5M |
| Base gross proceeds | $20.0B |
| Net proceeds | $19.7B |
| Estimated base dilution | 4.1% |
| Base tranche value now | $18.9B |
| Q2 measure | 2025 | 2026 | Change |
|---|---|---|---|
| Revenue | $12.9B | $16.1B | +25% |
| GAAP gross margin | 27.5% | 40.4% | +12.9 pts |
| Non-GAAP gross margin | 29.7% | 41.8% | +12.1 pts |
| Data Center & AI revenue | ≈$4.0B | $6.3B | +59% |
| Foundry revenue | ≈$4.4B | $5.8B | +31% |
| Measure | Value |
|---|---|
| Average target | $121.24 |
| Upside to average | 35.1% |
| 2026 EPS estimate | $1.50 |
| 2026 P/E | 59.8× |
| 2027 EPS estimate | $2.07 |
| 2027 P/E | 43.4× |
Sources: Yahoo Finance premarket quote and Most Active ranking; Intel Q2 2026 results; Intel offering terms; Intel historical data; MarketWatch analyst estimates. Every market figure is timestamped above.
Amazon.com rose roughly 4% on Friday following an analyst upgrade that emphasized the possibilities for agentic AI to enhance retail operations. Shares were around…
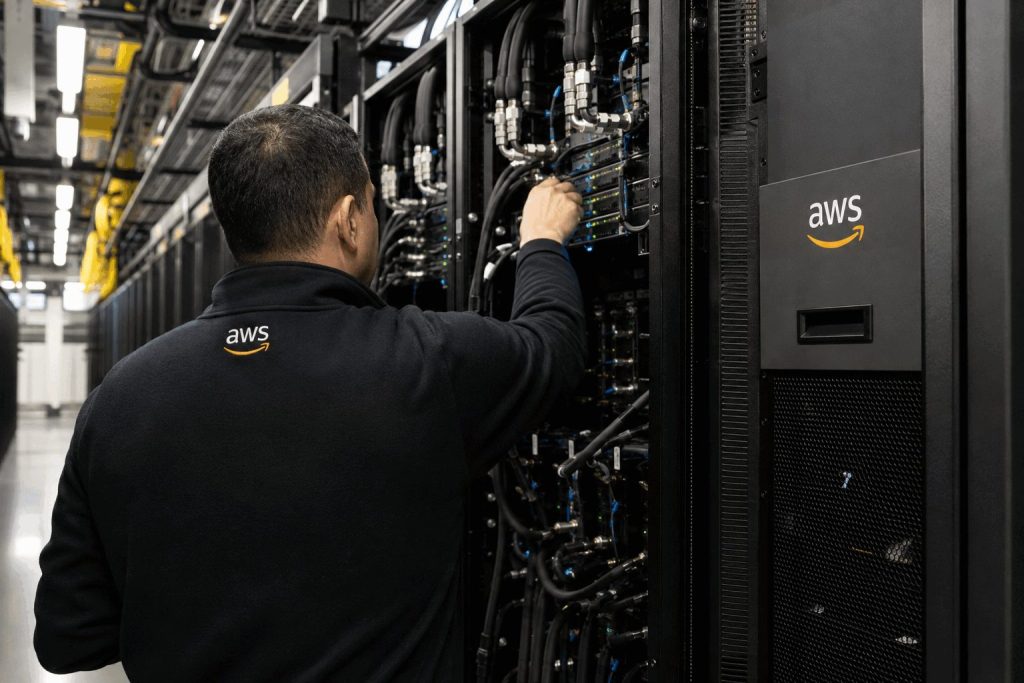
AWS generated 60% of group operating profit from 21% of sales.
| Group sales | $200.6B |
| Operating income | $27.5B |
| AWS sales | $42.2B |
| AWS operating income | $16.6B |
| AWS operating margin | 39.3% |
| Advertising growth | 26% |
| Measure | Current TTM | Prior TTM |
|---|---|---|
| Operating cash flow | $161.4B | $121.1B |
| Free cash flow | −$7.6B | $18.2B |
| P&E purchase increase | +$66.1B year over year | |
| Implied annualized Q2 operating profit | $110.0B | |
| Market value / annualized operating profit | ~26× | |
Core test: keep AWS near 37% growth without making negative free cash flow structural.
Sources: Amazon Q2 2026 results; current market quotes; public reporting on the AWS–NVIDIA expansion. Estimates may differ from reported GAAP measures.
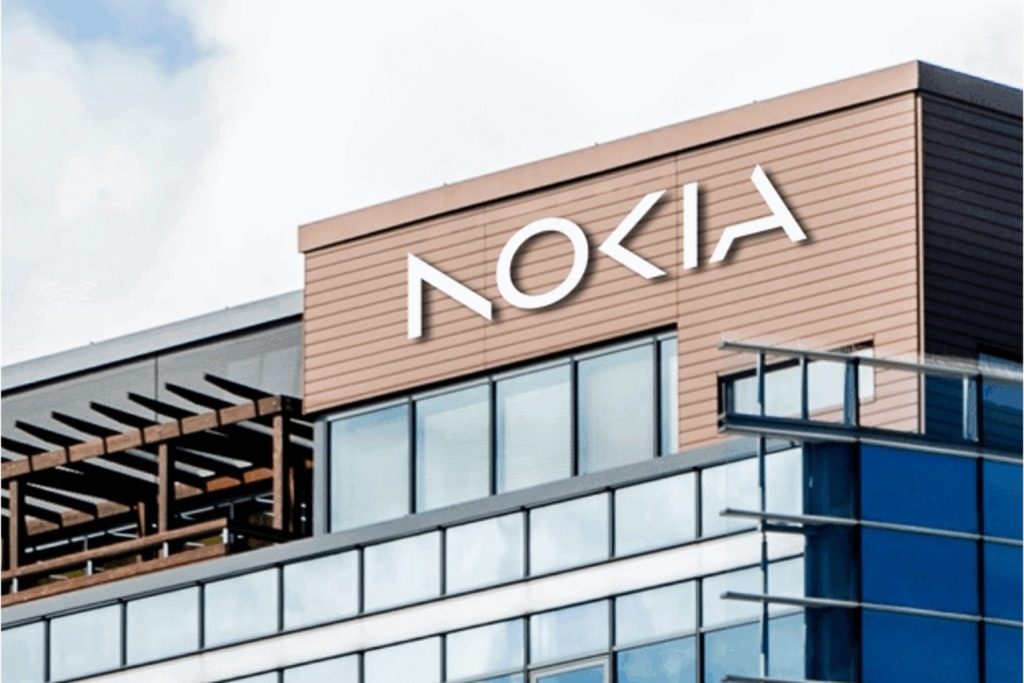
New York, August 31, 2026, 04:30 - Nokia stock dropped 3.6% as the company's €732 million cash burn put added pressure on the telecom…
The reported-margin marker sits below zero; restructuring created a 10-point gap versus the comparable measure.
| Metric | Value | Change |
|---|---|---|
| Net sales | €4.82B | +8% |
| AI & Cloud sales | €446M | +105% CC |
| AI & Cloud orders | ~€2.8B | Pipeline |
| Comparable operating profit | €434M | 9.0% margin |
| Reported operating result | −€50M | −1.0% margin |
| Restructuring charges | €390M | Cash burden |
| 2026 comparable operating profit | €2.1B–€2.6B |
| Management target | Somewhat above midpoint |
| Net cash + interest-bearing investments | €2.78B |
| Working-capital outflow | ~€1.15B |
| Trailing P/E screen | ~72× |
| Communications-industry average | ~34× |
Core test: AI revenue can support a rerating only if operating gains reach free cash flow.
Sources: Nokia Q2 and half-year 2026 report; MarketWatch price and volume; published valuation screen. Constant-currency growth is marked “CC.”
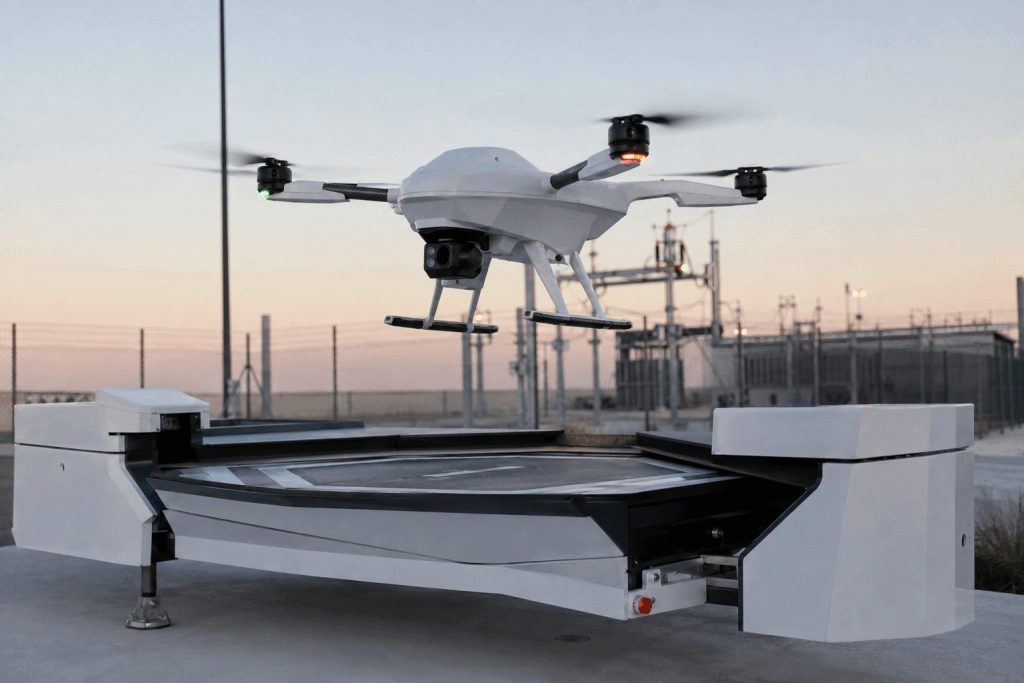
Ondas Inc. ended Friday down 9.71% at $7.90. Volume totaled 69.97 million shares, representing roughly 81% of the company's 65-day average.
| June 30 cash + restricted cash + short-term investments | $1.4B |
|---|---|
| Q3 cash used for DZYNE and Cyberhawk | ≈$325M |
| Modeled remainder before other flows | ≈$1.08B |
| Execution checkpoint | Current evidence | What changes the thesis |
|---|---|---|
| Q3 revenue | $140M–$155M guide | Delivery timing and mix |
| Margins | 50.4% adjusted gross margin in Q2 | Operating leverage must offset integration costs |
| Profitability | Platform target: Q4 2026 | Sequential EBITDA improvement |
| M&A | Aran: ≈$33M for ≈$26M expected 2026 sales | Q3 closing and integration |
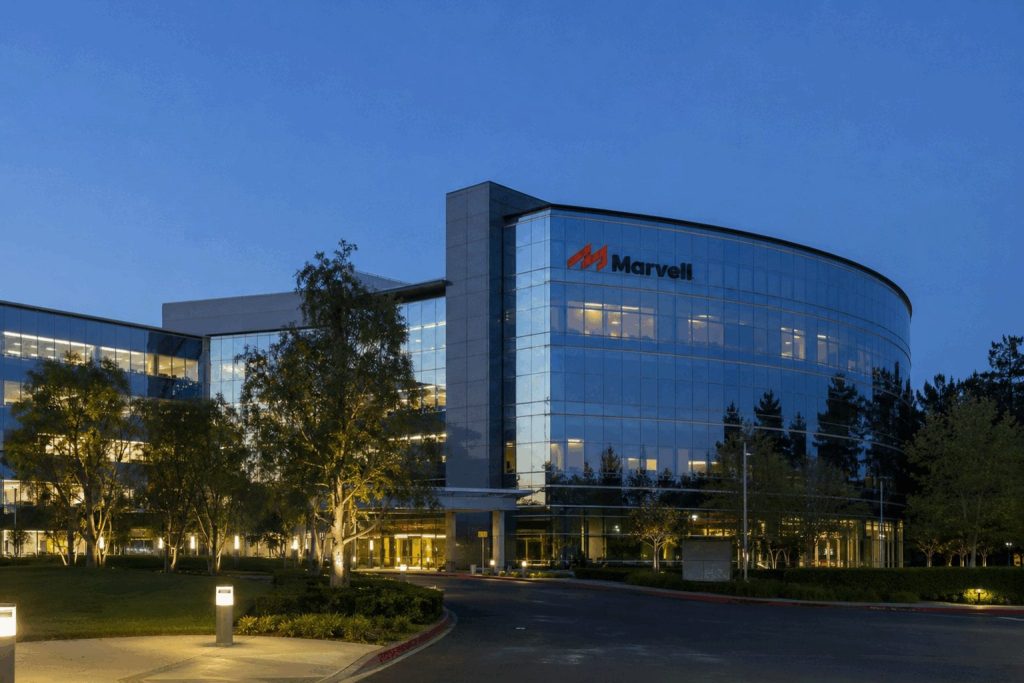
SANTA CLARA, California, August 30, 2026, 23:05 – Marvell Technology stock declined 10.3%, erasing $22 billion from its market capitalization after the company said…
| Metric | Marvell | Reference |
|---|---|---|
| Forward P/E | 58.41× | Broadcom 32.15× |
| FY2027 EPS estimate | $4.20 | $4.04 three months ago |
| FY2028 EPS estimate | $6.69 | $6.13 three months ago |
| Ratings | 30 Buy · 7 Overweight | 6 Hold · 0 Sell |
| Target range | $211.97–$400 | Median $295 |
Beat: Revenue was $39M above prior guidance midpoint. Adjusted EPS of $0.94 topped the $0.93 consensus.
Guide: Q3 revenue midpoint implies about 15% sequential growth.
Disconnect: The Google agreement can support up to $120B of cumulative custom-product revenue, but the strongest contribution is not expected until fiscal 2029.
Friday's decline removed about $22.3B of equity value even as quarterly revenue grew 37%. The central question is timing: Marvell must convert its Google and other hyperscaler programs into revenue quickly enough to justify a forward earnings multiple roughly 82% above Broadcom's.
NVIDIA Corporation fell 4.57% on Friday, wiping out roughly $252 billion. The drop came after shares jumped 6.8% post-earnings the previous day.
| Company | Forward P/E | Investor signal |
|---|---|---|
| NVIDIA | 17.9× | Fast growth, but margin and supply risks |
| Advanced Micro Devices | 37.2× | Higher multiple despite lower scale |
| Intel | 46.2× | Turnaround expectations distort earnings base |
Intel Corporation fell 2.85% on Friday, erasing about $13.9 billion in market capitalization. The stock ended the session at $89.47, with trading volume at…
| Metric | Q2 2026 | YoY |
|---|---|---|
| Revenue | $16.1B | +25% |
| Data Center & AI | $6.3B | +59% |
| Client computing | $8.9B | +13% |
| Foundry* | $5.8B | +31% |
| GAAP gross margin | 40.4% |
| GAAP operating margin | 11.1% |
| Operating cash flow | $7.0B |
| GAAP net loss | −$11.0B |
| Base shares issued | 210.5M |
| Estimated dilution | ≈4.0% |
| Underwriter option | 31.6M |
| Net proceeds | ≈$19.7B |
Friday's rate-driven technology selloff erased about $13.9 billion and left Intel below its financing price. The operating rebound is substantial: revenue grew 25%, data-center sales rose 59% and operating margin turned positive. The next rerating depends on converting roughly $19.7 billion of new capital into durable foundry utilization, margins and free cash flow without further dilution.
Sources: Intel Q2 2026 results; Intel common-stock offering release; Yahoo Finance market data; MarketBeat analyst consensus. Figures may be rounded. This dashboard is informational, not investment advice.