Artificial IntelligenceEarnings
Marvell shares fall 10.3% as Google AI-related revenue projected for fiscal 2029
Marvell Technology, Inc. dropped 10.28% on Friday. Shares finished at $216.62, with 48.7 million traded.
Technology
Marvell Technology, Inc. dropped 10.28% on Friday. Shares finished at $216.62, with 48.7 million traded.
All coverage
Marvell Technology, Inc. dropped 10.28% on Friday. Shares finished at $216.62, with 48.7 million traded.
| Measure | Latest | Change / signal |
|---|---|---|
| GAAP gross margin | 53.1% | Q3 guide: 52.9%–53.9% |
| Adjusted gross margin | 58.9% | Q3 guide: 57.5%–58.5% |
| GAAP net income | $308.0M | 11.2% margin |
| Operating cash flow | $605.5M | 22.1% of revenue |
| Q3 revenue midpoint | $3.15B | ≈15% above Q2 |
| FY2028 revenue target | ≈$18B | Custom silicon-led |
Google custom-chip revenue becomes materially larger in fiscal 2029. Investor Day: Oct. 6, 2026.
Mean target: $278.89 from 44 analysts, implying 28.8% upside. Range: $126–$400.
Risks: custom-chip delays, customer concentration, margin compression, export controls and advanced-packaging constraints.
Amazon shares jumped 3.97% on Friday, adding roughly $110 billion of market value. Investors rewarded its AI exposure even as that buildout consumed more…
After-hours: $266.15
$10.17 × 10.79B shares
Day range: $257.78–$267.56
Market cap: $2.87T
Amazon outperformed the Nasdaq Composite by 4.49 percentage points.
Fed Chair Kevin Warsh said AI growth had exceeded even proponents’ expectations. Amazon led the Magnificent Seven after the remarks.
The move also followed fresh bullish analyst commentary and renewed attention to AWS infrastructure demand.
There was no new Amazon earnings release Friday.
| Measure | Q2 2026 |
|---|---|
| Total sales | $200.6B · +20% |
| Operating income | $27.5B · +43% |
| AWS sales | $42.2B · +37% |
| AWS operating income | $16.6B |
| AWS operating margin | 39.3% |
| AWS share of operating profit | 60.4% |
$161.4B · up 33%
−$7.6B · versus +$18.2B one year earlier
Property and equipment purchases increased by $66.1B, primarily for AI.
| Reported net income | $62.6B |
| Non-operating other income | $53.4B |
| Main driver | Anthropic investment |
| Q3 operating-income guide | $22.5B–$26.5B |
The guide midpoint is about 11% below Q2 operating income. Reported EPS should not be read as recurring operating profit.
Consensus: Strong Buy · 60 analysts · $230 low · $405 high.
Targets were checked Aug. 29, 2026. They can lag capex revisions and market-rate changes.
| Signal | Constructive | Warning |
|---|---|---|
| AWS growth | Stays near 37% | Capacity arrives before demand |
| Free cash flow | Returns positive | Outflow deepens beyond −$7.6B |
| AWS margin | Holds near 39% | Power and depreciation compress it |
| Q3 operating income | Above $26.5B | Below $22.5B |
Amazon’s AI businesses are scaling fast enough to command a premium. The stock’s next leg depends on converting infrastructure spending back into free cash flow.
Risks: slower AI utilization, higher rates, energy constraints, depreciation and retail-cost inflation. Faster Trainium adoption or stronger AWS margins would improve the upside case.
Sources: Amazon Q2 results · MarketWatch quote · analyst consensus.
WEST PALM BEACH, Florida, August 29, 2026, 11:43. Ondas shares fell 9.7% after the company disclosed revenue surged thirteen times, but posted an EBITDA…
Range: $7.87–$8.71
Approx. $549M turnover
2026 revenue-guide midpoint
Cash, restricted cash and investments
No fresh company release accompanied Friday’s decline. Heavy turnover points to valuation and position resetting after a rapid growth-and-acquisition cycle.
The stock traded 48.3% below its 52-week high of $15.28.
Q2 results beat the revenue estimate cited by Barron’s, but the adjusted EBITDA loss exceeded expectations.
| Measure | Current figure |
|---|---|
| Q3 revenue guide | $140M–$155M |
| 2026 revenue target | $525M–$550M |
| Reported backlog, June 30 | $613M |
| Pro forma backlog | $757M |
| Q2 + early-Q3 orders | $280M |
| Post-quarter acquisition uses | ~$325M |
43.1% Q2 2026 · 49.2% Q1 2026 · 53.1% Q2 2025
$93.3M in Q2; reported operating expense was $199.1M, including $105.8M of non-cash charges.
The core test is whether revenue approaches guidance while cash operating expense grows more slowly.
| Market capitalization | ~$4.5B |
| 2026 guide midpoint | $537.5M |
| Market cap / guided revenue | ~8.4× |
| Q2 cash pool | $1.4B |
The cash figure predates roughly $325 million of announced Q3 acquisition spending. It should not be treated as current net cash.
Range: $13–$25. Consensus: Strong Buy, according to Investing.com on Aug. 29, 2026.
Targets can lag acquisition costs, dilution and rapid changes in the share count.
| Milestone | What would help | What would hurt |
|---|---|---|
| Q3 revenue | At or above $147.5M midpoint | Backlog converts more slowly |
| Platform profitability | Adjusted EBITDA breakeven by Q4 2026 | Integration costs extend losses |
| Company-wide profitability | Target holds for Q4 2027 | More equity-funded acquisitions |
| Gross margin | Rebounds toward 50% | Mix remains near 43% |
The order book can support another sharp revenue step-up. Friday’s 9.7% decline says the market now wants proof that each new dollar of sales brings Ondas closer to profitability.
Main risks: backlog timing, acquisition integration, margin dilution and further share issuance. Faster defense procurement or a quicker margin recovery would improve the upside case.
Sources: Ondas Q2 results · Yahoo Finance · Investing.com consensus · Ondas IR. Figures are company-reported unless noted.
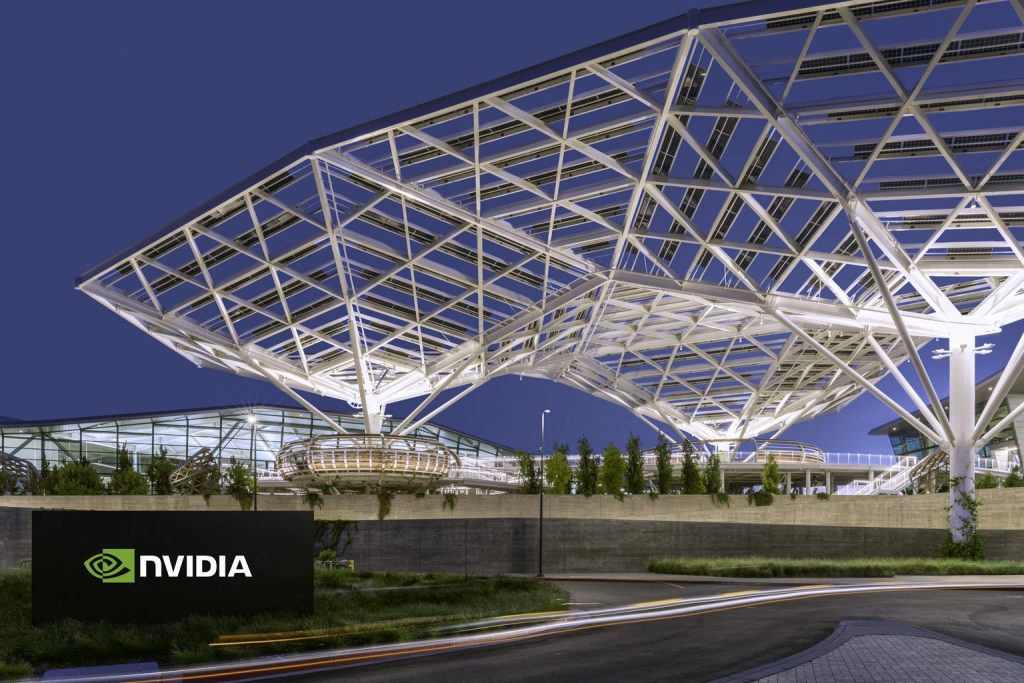
SANTA CLARA, California, August 29, 2026, 10:01. Nvidia stock declined 4.6%, cutting $251 billion from its market capitalization as a revised margin forecast reined…
Market data: August 28, 2026, 16:00 EDT · Updated August 29, 2026, 10:01 EDT
Two-session return: +3.76%, equal to roughly $190B of net market-value gain.
| Metric | Q2 FY26 | Q2 FY27 | Q3 FY27 guide |
|---|---|---|---|
| Revenue | $46.74B | $96.22B | $108B ±2% |
| GAAP gross margin | 72.4% | 75.0% | 74.0% ±0.5pt |
| GAAP opex | $5.43B | $8.41B | $9.2B |
Revenue doubled year over year, while the guided margin midpoint falls 100 basis points sequentially.
| Market capitalization | $5.24T |
| Trailing P/E | 27.5× |
| Annualized Q2 sales multiple | 13.6× |
| 52-week range | $164.07–$236.54 |
Friday's close sat 74% through the 52-week range.
Consensus from 36 analysts: 56% Strong Buy, 42% Buy and 3% Hold.
Major technology companies are expected to spend more than $730B on AI infrastructure this year, versus $400B last year.
| Signal | Current reading | Investor sensitivity |
|---|---|---|
| China data-center compute | No Q3 revenue assumed | Policy relief could add upside; restrictions remain a risk |
| Gross margin | 74% Q3 midpoint | Another decline would challenge premium expectations |
| Operating expense | $9.2B guide | Growth must keep outrunning cost expansion |
| Guarantee exposure | $3.5B maximum | Land, power and shell commitments raise execution exposure |
Nvidia lost about $251B on Friday and surrendered roughly half of Thursday's earnings rally. The business still offers 106% revenue growth, but a 74% margin guide and a 13.6× annualized sales run-rate leave little room for ordinary execution.
Sources: Nvidia, Reuters, WSJ market data and Public analyst survey. Calculations use reported figures and may differ from vendor forward estimates.
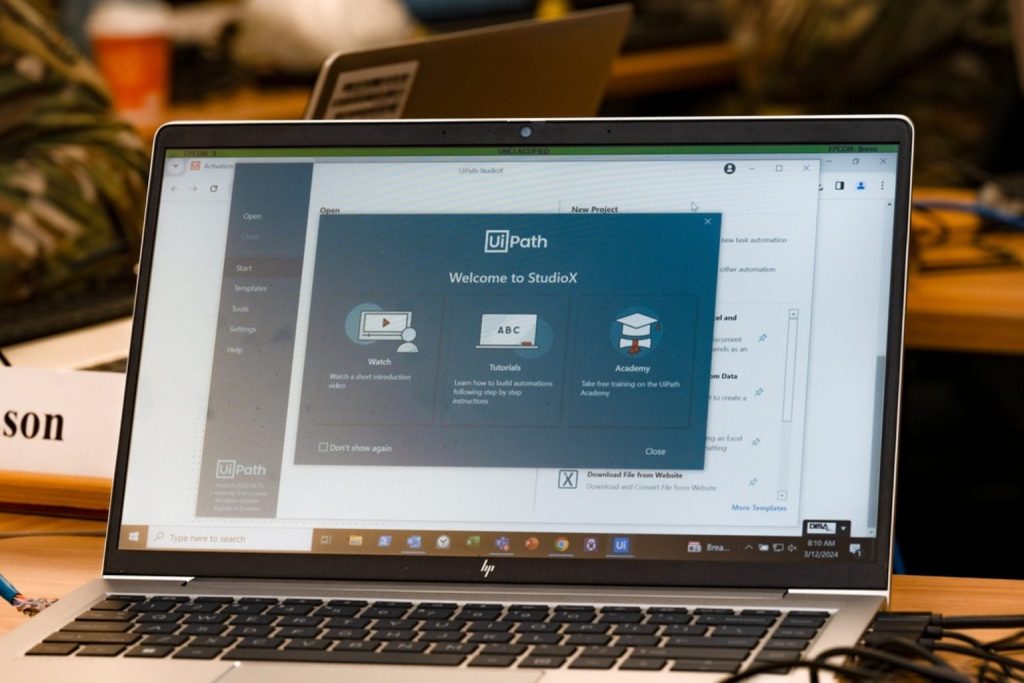
UiPath Inc. fell 0.98% on Friday, halting momentum after a 9.37% rally. Shares closed at $18.15 with volume at 53.1 million.
| Metric | Latest | YoY / signal |
|---|---|---|
| Q1 FY27 revenue | $418M | +17% |
| ARR | $1.901B | +12% |
| Dollar retention | 109% | expansion intact |
| GAAP gross margin | 82% | high software margin |
| Operating cash flow | $132M | 32% of revenue |
| Q2 revenue guide | $395M–$400M | earnings benchmark |
Sources: UiPath investor relations, Google Finance, Yahoo Finance and MarketScreener. Market figures are as of Aug. 28, 2026 unless stated.
Nokia Oyj slipped 3.59% on Friday, wiping out roughly $2.1 billion in market capitalization. The stock ended the session at $10.21, breaking a three-day…
| Comparable operating profit | €434M | +18% YoY |
| Comparable operating margin | 9.0% | +70 bps |
| Reported operating result | −€50M | €390M restructuring charge |
| Free cash flow | −€732M | Q2 2026 |
| Net cash | €2.78B | −€1.01B QoQ |
| Metric | Latest | Comparison | Investor read-through |
|---|---|---|---|
| Group sales | €4.82B | +9% constant currency | Broad growth returned |
| Network Infrastructure sales | €2.04B | +12% constant currency | Optical and IP led |
| AI & Cloud sales | €446M | +105% constant currency | 9.3% of group sales |
| 2026 comparable operating profit | €2.1B–€2.6B | Midpoint €2.35B | Orders equal 1.19× midpoint |
| Analyst mix | 8 Buy / 2 Hold / 1 Sell | Targets $8.50–$21 | Wide execution range |
| Company | Ticker | Move |
|---|---|---|
| Nokia | NOK | −3.59% |
| BlackBerry | BB | −5.66% |
| Motorola Solutions | MSI | −0.11% |
| Apple | AAPL | +1.63% |
Oct. 22, 2026 Confirmed Q3 reporting date.
Upside: Faster order conversion, sustained Optical/IP growth and positive free cash flow.
Downside: Supply delays, continued restructuring outflows, customer concentration or currency pressure.
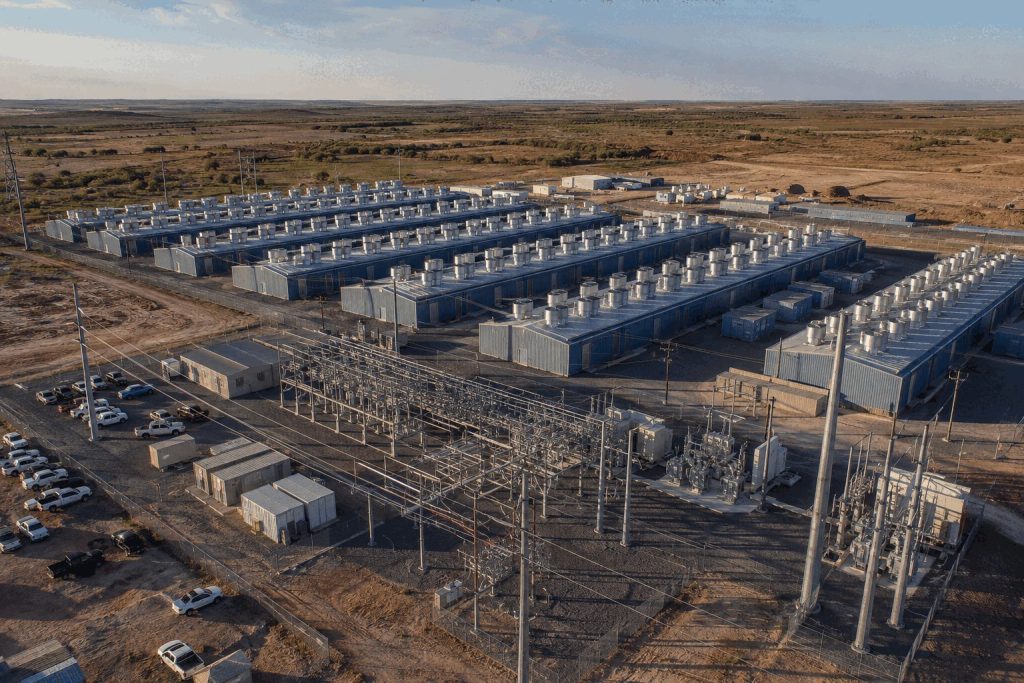
NEW YORK, August 28, 2026, 23:10. IREN shares dropped 12.5% after reporting $4 billion in annual recurring revenue from AI, which was accompanied by…
AI Cloud became 51.4% of quarterly revenue. Source: IREN FY26 results, Aug. 27.
Adjusted EBITDA fell 68%; margin contracted to 14.0% from 41.1%.
| Metric | Value | Multiple |
|---|---|---|
| Closing market value | $12.67B | — |
| FY26 GAAP revenue | $707M | 17.9× |
| Operating ARR, Aug. 26 | $1.0B | 12.7× |
| Contracted 2026 ARR | $4.0B | 3.2× |
ARR is non-GAAP and assumes contracted GPUs operate 8,760 hours; recognized revenue may be lower.
| Company | Price | Day |
|---|---|---|
| IREN | $35.45 | −12.6% |
| CoreWeave | $84.23 | −2.9% |
| Nebius | $209.18 | −4.3% |
IREN underperformed both neocloud peers by more than eight percentage points.
| FY26 | Value | YoY |
|---|---|---|
| Total revenue | $707.0M | +41% |
| AI Cloud revenue | $128.8M | +685% |
| Adjusted EBITDA | $245.7M | −9% |
| Net result | −$702.6M | vs +$86.9M |
Net loss included $638.8M of non-cash impairments.
H.C. Wainwright: Buy, $90 target, reiterated Aug. 28.
B. Riley: commercial and financing path validated; execution now moves to commissioning.
Visible Alpha quarterly adjusted-EBITDA consensus was $57.1M versus $19.2M reported.
Horizon 2 commissioning; Horizon 3–4 target Q4 2026.
$1B operating ARR must approach $4B contracted ARR.
$14B of cash, committed financing and prepayments supports rollout.
Delays, customer concentration, GPU pricing, debt and obsolescence.
Shares of FuboTV Inc. climbed 2.0% on Friday as an announced upgrade shifted ESPN and Fox Sports channels to 1080p resolution. This adjustment increases…
Sharper sports streams meet flat comparable revenue.
| Metric | Latest | Comparison |
|---|---|---|
| NA subscribers | 5.75M | +2% YoY |
| NA revenue | $1.474B | ~flat pro forma |
| Adjusted EBITDA | $19.1M | 1.3% margin |
| Net loss | $(25.7)M | Improved from $(72.0)M pro forma |
| Measure | Reading |
|---|---|
| Cash + restricted cash | $236.4M |
| FY2026 ending cash guide | ≥$200M |
| Positive free cash flow | Expected FY2027 |
| FY2028 adjusted EBITDA target | ≥$300M |
Sources: Fubo Q3 FY2026 release and SEC exhibit; Fubo pricing and 4K support; Google Finance; Cord Cutters News. The 0.5% retention case is an illustrative estimate, not company guidance. Monthly revenue run-rate uses quarter-end subscribers and includes advertising.
U.S. interest in “apple watch ultra 4” increased following Apple’s announcement of a product event set for September 9, drawing renewed focus to a…
| Item | Status | Investor use |
|---|---|---|
| Apple event | Confirmed | Launch catalyst |
| “Apple Watch Ultra 4” | Not announced | Search term only |
| Current Ultra 3 | $799; 42 hours | Price and battery benchmark |
| Ultra revenue | Not disclosed | Tracked inside $7.88B category |
| Upside | Premium price holds and new health or connectivity features widen upgrade demand. |
| Middle | Incremental update sustains category growth near the latest 6.5% rate. |
| Downside | Limited differentiation shifts buyers to cheaper Watch models or delays upgrades. |
SAN JOSE, California, August 28, 2026, 19:32. Supermicro shares slid 3.6% after the company set a $69 billion sales target, putting further pressure on…
| Metric | FY2026 | Reference |
|---|---|---|
| Revenue | $39.1B | +78% YoY |
| Gross margin | 10.8% | 11.1% prior year |
| Net income | $2.2B | $1.0B prior year |
| Diluted EPS | $3.26 | $1.68 prior year |
| Positive | Quarterly revenue approaches $15B while gross margin holds above the 10.8% full-year level. |
| Neutral | Revenue scales, but mix pulls margin back toward the fiscal-year average. |
| Negative | Customer timing or power and cooling constraints delay rack acceptance. |
Weekly Recap + Week Ahead: Tech Rebounds Before GDP29/08/2026 · 08:36 AEST WEEKLY RECAP + WEEK AHEAD Tech rescued Friday; rates still set the…
U.S. equity benchmarks held near their closing levels through 18:00 EDT. Thin after-hours trading did not extend Friday’s technology-led selloff.
| Communication services | +1.41% |
| Energy | +0.60% |
| Utilities | −1.08% |
| Technology | −1.55% |
| Gap | ≈+13% |
| Workday | +5.8% |
| Nvidia | −4.6% |
| Marvell | −10.3% |
| PayPal | −12.7% |
Sources: AP, Reuters, WSJ market data and StockAnalysis after-hours snapshot. Figures timestamped Aug. 28, 2026, 18:00 EDT unless noted.
SANTA CLARA, August 28, 2026, 17:50. Nvidia shares closed down 4.6%, losing $253 billion in market value, as investors focused on margin risks despite…
| Metric | Q1 FY27 | Q2 FY27 | Q3 guide |
|---|---|---|---|
| Revenue | $81.6B | $96.2B | $108.0B ±2% |
| Seq. growth | 20.0% | 17.9% | 12.2% |
| Gross margin | 74.9% | 75.0% | 74.0% ±0.5 pt |
| Data center | $75.2B | $89.0B | Not guided |
| Consensus | Buy |
| Ratings mix | 57 Buy · 7 Overweight · 2 Hold · 1 Sell |
| Median target | $316.60 · 45.5% above close |
| Q2 capital returned | $26.0B |
| Remaining repurchase authority | $99.0B |
Sources: NVIDIA Q2 FY2027 release; Reuters, Aug. 27–28, 2026; FactSet via WSJ/MarketWatch. Market figures are time-sensitive and stated as of the timestamps above.
Amazon.com Inc. gained 3.97% on Friday. The move added roughly $109.8 billion to its equity value.
NEW YORK, August 28, 2026, 13:37 EDT – Exascale Labs opened on the Nasdaq with its shares rising 12%, as the company debuted with…
Exascale Labs drew heavy trading on its first Nasdaq session. The valuation case now rests on converting a large reported pipeline while funding an asset-heavy GPU capacity strategy.
| Quarter | Revenue |
|---|---|
| Q4 2023 | $0.068m |
| Q1 2024 | $0.479m |
| Q2 2024 | $0.770m |
| Q3 2024 | $1.171m |
| Q4 2024 | $1.442m |
| Q1 2025 | $2.160m |
| Q2 2025 | $2.242m |
| Q3 2025 | $3.262m |
| Q4 2025 | $3.545m |
The company reported 64% average quarterly growth across this sequence. FY2025 revenue totaled $7.0 million.
A three-year agreement committed about $71.4 million to dedicated GPU capacity. It is a procurement obligation, not customer revenue.
Shareholders approved the combination. Roughly $12 million remained in trust after redemptions, before transaction expenses.
The business combination closed. Management cited a qualified pipeline exceeding $300 million.
XLAB shares and XLABW warrants began Nasdaq trading.
Sources: MarketWatch market data; closing announcement; SEC filing on trust cash; SEC investor presentation; GPU capacity agreement. Financial figures reflect company disclosures and are not forecasts.
Core AI Holdings shares jumped about 56% on Friday after quarterly revenue reached $22.35 million. Trading volume exceeded 205 million shares, roughly 388 times…
NASDAQ: CHAI · Mobile games and advertising analytics
| Metric | Q2 2026 | Q2 2025 | YoY |
|---|---|---|---|
| Revenue | $22.35m | $14.34m | +55.8% |
| Gross profit/(loss) | ($0.01m) | ($0.40m) | 97.2% narrower |
| Net loss | ($1.62m) | ($0.76m) | +114% |
| H1 revenue | $26.12m | $28.85m | -9.5% |
| H1 operating cash flow | $5.45m | ($2.42m) | Turned positive |


![Australia Stock Market Today 29/08/2026 [UPDATE: 08:36 AEST] [Weekly Recap + Week Ahead: Tech Rebounds Before GDP]](https://ts2.tech/wp-content/uploads/2026/08/AU-market-dashboard-2026-08-29-0830-1024x683.jpg "Australia Stock Market Today 29/08/2026 [UPDATE: 08:36 AEST] [Weekly Recap + Week Ahead: Tech Rebounds Before GDP]")