Shares of IREN Limited dropped 5.97% in after-hours trading on Thursday. Despite strong expansion in AI Cloud, the costs from infrastructure transition and associated accounting impacts weighed on the company.
Shares of IREN Limited dropped 5.97% in after-hours trading on Thursday. Despite strong expansion in AI Cloud, the costs from infrastructure transition and associated…
·3 min read
IREN investor dashboard
FY26 transition to AI Cloud • Market data at August 27, 2026, 18:00 EDT
After-hours price
$38.11
-$2.42 • -5.97%
FY26 revenue
$707.0M
+41.1% YoY
AI Cloud revenue
$128.8M
~7.9× YoY
FY26 net loss
-$702.6M
$638.8M impairment
Revenue mix shift
AI Cloud rose from 3.3% to 18.2% of annual revenue.
Contracts and capacity
Operating ARR
$1.0B
Contracted 2026 ARR
$4.0B
2026 IT capacity
~0.3GW
2027 IT capacity target
~0.8GW
Recent revenue / MW
>$20M
Customer prepayments
45–55% GPU capex
ARR is a non-GAAP operating metric. Recognized revenue may be materially lower.
Financial bridge
Metric
FY25
FY26
Change
Total revenue
$501.0M
$707.0M
+41.1%
AI Cloud revenue
$16.4M
$128.8M
+685%
Adjusted EBITDA
$269.7M
$245.7M
-8.9%
Net income/(loss)
$86.9M
-$702.6M
NM
Market and analyst view
Regular close
$40.53
After-hours
$38.11
Implied value change
~-$865M
52-week range
$22.63–$76.87
Ratings
7 Buy / 2 Hold / 1 Sell
Average target
$77.44
Investor read-through
AI demand validatedLegacy mining impairmentHeavy external financingExecution risk
Watch: quarterly adjusted EBITDA fell 67.7% sequentially as staffing and platform costs arrived before the revenue ramp. Deferred revenue drove $1.722 billion of quarterly operating cash flow.
Sources: IREN FY26 results; Public after-hours data; Google Finance. Extended-hours prices may change before the next regular session.
PLEASANTON, California, August 27, 2026, 17:30 – Workday shares fell 7.0% in after-hours trading after the company issued a subscription revenue outlook of $2.52…
·3 min read
NASDAQ: WDAY · Fiscal Q2 2027 earnings reaction
Workday: AI traction meets a growth ceiling
Market snapshot: August 27, 2026, 17:30 EDT · Quarter ended July 31
After-hours price
$179.99
−$13.58 · −7.02%
Regular close
$193.57
Volume: 7.36M
Q2 revenue
$2.649B
+12.8% YoY
Adjusted EPS
$2.75
+$0.14 vs consensus
What cleared the bar—and what did not
Q2 revenue+$13M
Q2 adj. EPS+$0.14
FY sub midpoint+$7.5M
Q3 subscriptionsIn line
Bar lengths are normalized within each comparison, not a common scale.
AI adoption
Guidance and capital return
Metric
Current
Investor signal
Q3 subscription revenue
~$2.515B
Broadly in line
FY subscription revenue
$9.94–$9.95B
Tiny midpoint raise
New buyback authorization
$4.0B
~9% of AH value
After-hours value loss
~$3.3B
7.02% move
Street view
Consensus
Outperform
Analysts
41
Average target
$188.21
Median target
$202.00
Target range
$92–$275
Upside to average
4.6%
Watch enterprise IT budgets, large-deal timing, AI pricing, Financials adoption and acquisition speculation. Extended-hours liquidity can amplify the move.
Sources: Workday, Reuters, WSJ, Public and MarketScreener.Prices: 17:30 EDT. Financials: reported August 27, 2026.
Rubrik shares fell significantly after the bell, even though the company reported much stronger earnings than expected. The reaction suggested investors had already anticipated…
·2 min read
Rubrik Q2 FY2027 investor dashboard
Market data: August 27, 2026, 5:00 p.m. EDT · Financial data: quarter ended July 31, 2026
After-hours
$97.12
−9.25% from $107.02 close
Regular session
+11.33%
6.36M shares vs 3.60M 65-day average
Q2 revenue
$427.3M
+38% YoY · about $31M above consensus
Subscription ARR
$1.66B
+33% YoY · Cloud ARR +39%
Beat versus pre-report consensus
Operating quality
Metric
Q2 FY27
Q2 FY26
Change
Revenue
$427.3M
$309.9M
+38%
Subscription ARR margin
14.0%
9.4%
+4.6 pp
Non-GAAP gross margin
81.0%
81.6%
−0.6 pp
Free cash flow
$65.7M
$57.5M
+14%
FCF margin
15%
19%
−4 pp
Raised fiscal 2027 outlook
Metric
Prior range
New range
Midpoint lift
Revenue
$1.638B–$1.648B
$1.685B–$1.693B
+$46M
Subscription ARR
$1.854B–$1.862B
$1.880B–$1.885B
+$24.5M
Free cash flow
$293M–$303M
$323M–$333M
+$30M
Adjusted EPS
$0.25–$0.35
$0.47–$0.53
+$0.20
Investor bridge
The $30 million free-cash-flow midpoint increase is a 10.1% lift, while the $46 million revenue midpoint increase is 2.8%. The after-hours reversal says expectations rose faster than the outlook.
3,084 large customers+23% YoY$1.75B liquidity
Valuation and expectations
$105.63
Average analyst target before the report; about 8.8% above the 5:00 p.m. after-hours price. The stock touched a record $107.91 intraday and had gained roughly 85% over six months.
Risks to monitor
Extended-hours liquidity can distort price discovery. Rubrik remains GAAP-loss-making. Non-GAAP gross margin slipped 0.6 point, free-cash-flow margin fell four points, and a record-high setup leaves little room for execution misses.
Sources: Rubrik/Business Wire results, Rubrik prior guidance, Public after-hours data, WSJ market data and Yahoo Finance analyst data. Figures are company-reported unless otherwise stated.
SentinelOne, Inc. dropped roughly 3.1% in after-market trade on Thursday, coming after the stock surged 10.5% during the regular session to close at $22.71.
·2 min read
NYSE: S · Fiscal Q2 2027
SentinelOne: growth rose, per-share outlook fell
Market: Aug. 27, 2026, 4:34 pm ET Financials: quarter ended July 31, 2026
After hours
$22.00
−3.1% from $22.71 close
Regular session
+10.5%
17.9M shares traded
Q2 revenue
$292M
+21% year over year
ARR
$1.218B
+22% year over year
The two-stage price move
+10.5% regular−3.1% after hoursNet: +7.1% vs. prior close
Autodesk Inc. shares dropped 5.0% in extended trading as investors focused more on the expense of growth rather than a robust quarter.
·2 min read
NASDAQ: ADSK · Fiscal Q2 2027
Revenue lift meets a cash-conversion test
Market: Aug. 27, 2026, 4:30 p.m. ET Financials: quarter ended July 31, 2026
After-hours
$257.00
−5.02% from $270.58 close
Q2 revenue
$2.046B
+16% year over year
Adjusted margin
41%
+2 percentage points
Free cash flow
$561M
+24% year over year
Why shares reversed
MaintainX raises reported sales guidance, while financing and transaction costs reduce near-term cash conversion.
Guidance bridge
Metric
May
August
Change
FY revenue midpoint
$8.185B
$8.320B
+$135M
FY FCF midpoint
$2.763B
$2.738B
−$25M
Non-GAAP margin
~39%
~39%
Flat
FY adjusted EPS
$12.53
$12.56
+$0.03
Operating signals
AECO revenue
$1.029B
+17%
AutoCAD family
$500M
+14%
Manufacturing
$385M
+15%
Current RPO
$5.245B
+12%
Total RPO
$7.433B
+2%
Unbilled deferred revenue
$3.175B
−8%
Valuation and expectations
Average analyst target vs after-hours price
$314.57
22.4% above $257.00
Buy ratings
30
Sell ratings
0
Regular-session volume
3.71M
Market value at close
about $57.1B
Sources: Autodesk fiscal Q2 release; Yahoo Finance; Public after-hours data; Investing.com analyst compilation. Extended-hours prices can be volatile and less liquid.
Take-Two Interactive Software stock declined 2.12% while Rockstar Games initiated its last marketing campaign for Grand Theft Auto VI.
·2 min read
Product / commercial catalyst
Grand Theft Auto VI: the launch funnel
Take-Two Interactive Software · NASDAQ: TTWO
Market data: Aug. 27, 2026, 13:04 EDT Product and company data: Aug. 27, 2026
TTWO price
$228.50
−2.12% · −$4.95
Market value
$42.73B
~$920M erased today
GTA VI base price
$79.99
PS5 · Xbox Series X|S
FY2027 bookings
$8.0–8.2B
Midpoint +20.5% vs FY2026
Company bookings step-up
The FY2027 range is company-wide. It includes GTA VI, NBA 2K, mobile titles and other releases; it is not a GTA VI sales forecast.
Market snapshot
Day range$226.55–237.77
Volume1.52M
Analyst target$296.9522 analysts
Implied upside29.9%MarketBeat consensus
Moderate Buy Analyst targets remain sensitive to launch timing and online monetization.
Four gates between attention and recognized revenue
Netflix premierePaid-platform first window
Public video releaseYouTube and Rockstar site
Game launch$79.99 base edition
Online economicsKey long-tail valuation test
Operating bridge
Metric
Latest
Signal
Q1 FY2027 bookings
$1.39B
−3% year on year; slightly above guidance
Recurrent consumer spending
84% of bookings
−1% year on year
FY2026 bookings
$6.72B
Baseline before GTA VI launch year
GTA V installed base
>230M units
Proof of franchise durability
GTA VI pre-orders
“Unprecedented”
Management description; not yet recognized sales
What today's move says
Search attention and the showcase are strong. The stock still fell 2.12%, suggesting investors want execution evidence, not another anticipation cycle.
At $228.50, the market discounts roughly 30% upside to the analyst target. That spread also embeds delay, launch-quality and mobile-performance risk.
Risk board
TimingAnother delay would push bookings and marketing costs across fiscal periods.
ConversionPre-orders measure intent. Cancellations and edition mix determine realized revenue.
Online modelLong-term value depends on engagement and spending after launch.
PortfolioMobile weakness can offset strength from GTA and NBA 2K.
Sources: Rockstar Games; Take-Two fiscal Q1 2027 results and pre-order release; Reuters; MarketBeat; intraday U.S. market data. Figures are as timestamped and may change.
Microsoft Corp. began taking general preorders Thursday for its $899.99 Xbox Series X25 lineup. The high-end release gauges demand following a sharp drop in…
·3 min read
Microsoft · NASDAQ: MSFT · Product catalyst
Xbox Series X25 tests premium pricing against a shrinking hardware base
Market data: August 27, 2026, 12:38 EDT · Financials: Microsoft FY2026 Q4 / Form 10-K
Google trend: xbox series x 25th anniversary
X25 MSRP
$899.99
U.S. launch price · Nov. 13
Premium vs Series X
+$100
12.5% over the 1TB disc model
MSFT intraday
+1.52%
$503.92 · 12:38 EDT
FY26 hardware revenue
−29%
Lower console unit volume
Premium-price ladder
Series X Digital
$749.99
Series X 1TB
$799.99
Series X25
$899.99
PS5 Pro
$899.99
U.S. recommended retail prices. The PS5 Pro carries 2TB; X25 carries 1TB and includes the X25 controller plus Halo: Campaign Evolved.
What the buyer receives
Console1TB Series X25, numbered
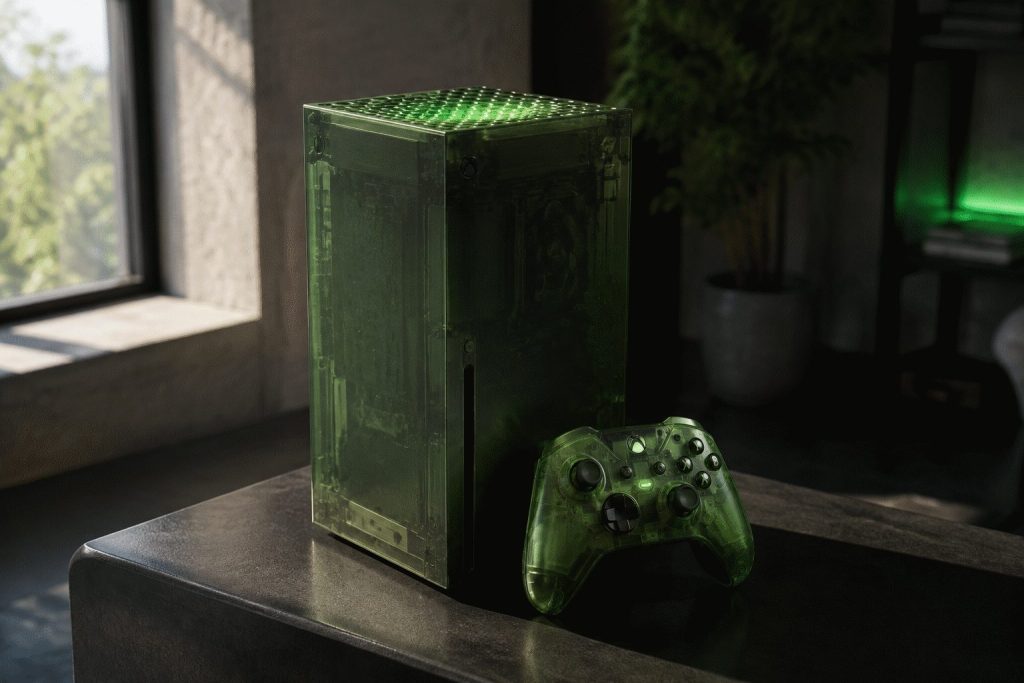
DesignTranslucent OG Green
ControllerX25 Special Edition
GameHalo: Campaign Evolved
Standalone game price$49.99
Standalone controller$79.99
Revenue sensitivity: undisclosed limited run
Gross sales at $899.99 before returns, channel fees and revenue recognition. Microsoft has not disclosed production volume.
Scale check
FY26 Xbox revenue−$1.7B / −7%
FY26 Xbox hardware−29%
FY26 Q4 Xbox revenue−10%
FY26 Q4 More Personal Computing$12.9B / −4%
Segment operating margin21%
250K-unit X25 scenario1.74% of one MPC quarter
The launch is more useful as an average-selling-price signal than as a Microsoft-wide earnings driver.
Stock and expectations
MSFTS&P 500Technology
Illustrative indexed path using reported open, range and latest performance; it is not tick-by-tick market data. Volume was 11.86M versus a 38.95M 65-day average.
Analyst snapshot
ConsensusBUY
Analysts55
Average target$569.45
Upside vs Aug. 26 close14.72%
Target range$400–$870
MarketScreener consensus; the wide range reflects Microsoft’s cloud and AI businesses, not Xbox alone.
Catalyst timeline
Aug. 26
Microsoft announces $899.99 price and limited preorder access.
Aug. 27
Broad preorders open in select markets at 10:00 EDT.
Oct. 20
X25 Special Edition controller launches separately.
Nov. 13
Xbox Series X25 collection launches.
Investor bridge and risks
The collection directly enters Xbox hardware revenue at a 12.5% premium to the standard 1TB Series X. A sellout would support pricing power and average selling price, but even an aggressive 250,000-unit scenario produces about $225 million of gross sales—only 1.7% of one recent More Personal Computing quarter.
Watch: production volume, sell-through speed, channel inventory, discounting before November 13 and any hardware-margin disclosure. Scarcity can create a sellout without proving mass-market demand. The 1.5% MSFT gain occurred during a broad technology rally and should not be attributed to Xbox alone.
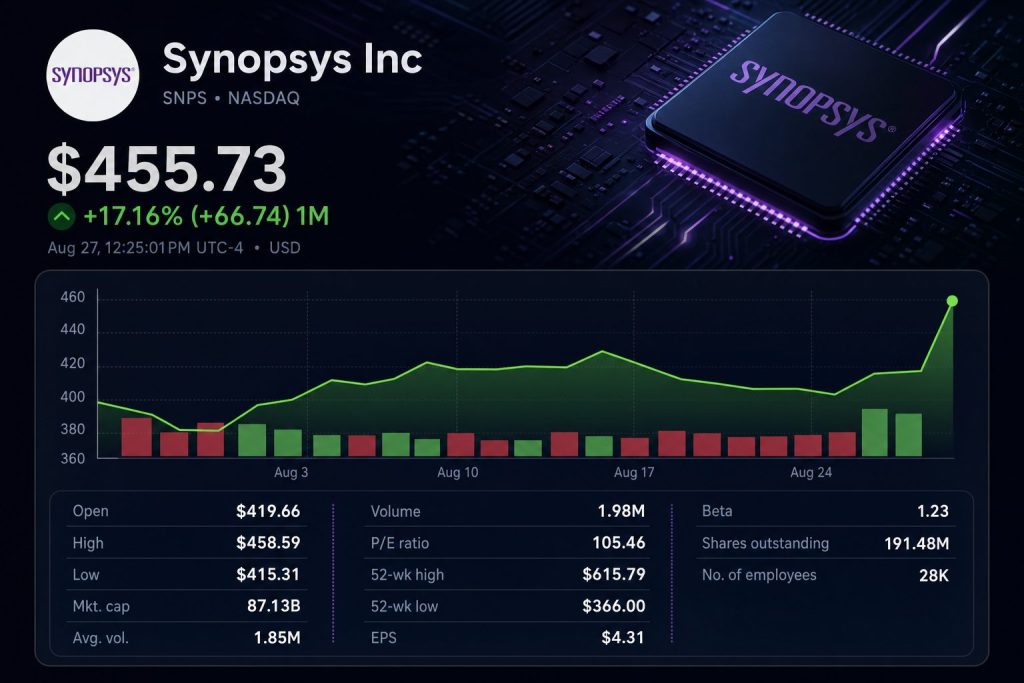
Shares of Synopsys climbed 10.7% as increased demand for chip design enabled the software firm to boost its yearly guidance. The stock was last…
·3 min read
Synopsys (NASDAQ: SNPS)
Q3 FY2026 earnings and Ansys integration
Market snapshot: Aug. 27, 2026, 12:08 ET
Share price$454.06+10.7%
Q3 revenue$2.477B+42.4% YoY
Adjusted margin41.6%14.4% GAAP
FY revenue midpoint$9.715BRaised outlook
Quarterly revenue mix
Electronic Design Automation — $1.283B / 51.8%
Ansys — $711.1M / 28.7%
Design IP — $473.8M / 19.1%
Margin bridge
$402.4M of acquired-intangible amortization and $231.6M of stock compensation widened the gap.
Guidance and cash generation
Measure
FY2026 / Q4 range
FY revenue
$9.69B-$9.74B
FY adjusted EPS
$15.04-$15.10
Q4 revenue
$2.53B-$2.58B
Q4 adjusted EPS
$4.10-$4.16
FY operating cash flow
About $2.8B
FY free cash flow
About $2.6B
Valuation signal
The one-day equity-value gain was about 2.9 times expected full-year Ansys revenue.
Balance sheet and investor watchlist
Signal
Current reading
What to watch
Cash + short-term investments
$3.608B
Integration flexibility
Outstanding debt
$10.037B
Debt paydown pace
Recurring revenue
82%
Renewal quality and pricing
Q3 operating cash flow
$813M
Conversion into free cash flow
Risks
Ansys integration expense, acquisition-related debt, export controls and the large GAAP-to-adjusted margin gap can challenge the premium valuation. After a 10.7% rally, guidance execution matters more.
Sources: Synopsys Q3 FY2026 financial supplement and quarterly results; market data at Aug. 27, 2026, 12:08 ET. Figures may be rounded.
BOISE, Idaho, August 27, 2026, 09:39 EDT — Micron Technology's stock has erased 82% of its Nvidia-driven opening gap, with attention staying on its…
·3 min read
Google Trend: MU · NASDAQ:MU
Micron’s Nvidia gap faded fast
The AI-memory read-through remains strong. Price action says investors still want Micron-specific proof on HBM volume, pricing and margins.
Market open · 09:39 EDT
Micron price
$943.46
+$5.06 · +0.54%
Opening gap
+3.05%
82% erased by 09:39
$1,300 target
+37.8%
8.4× FY2027 EPS estimate
Analyst consensus
$1,515
Strong Buy · 47 analysts
Ten-session price path
August 27 value is intraday at 09:39 EDT; earlier values are official closes. The stock opened at $967.01 before fading.
Fundamentals and valuation
Metric
Current / latest
Comparison
Investor reading
Fiscal Q3 revenue
$41.46B
$23.86B prior quarter
+73.8% sequential
Operating cash flow
$25.39B
$11.90B prior quarter
Cash conversion strengthened
Adjusted free cash flow
$18.3B
$7.1B capex
Funds expansion internally
Adjusted gross margin
84.9%
74.9% prior quarter
Exceptional, hard to sustain
Forward P/E
6.5×
21.2× trailing
Large earnings-cycle assumption
Net cash
$23.75B
$21.03 per share
Balance-sheet cushion
AI-memory transmission chain
Nvidia Q2 revenue
$96.2B
+106% year over year
Data-center revenue
$89.0B
+117% year over year
Nvidia Q3 outlook
$108B
±2%; excludes China compute
Micron HBM4
>2.8 TB/s
36GB 12-high; Rubin design
HBM is stacked memory placed beside AI accelerators. Higher accelerator shipments increase the addressable memory content, but Micron’s realized revenue still depends on qualification, allocation, pricing and yield.
Targets and next check
Reference
Target / value
Upside from $943.46
Implied FY2027 P/E
Current price
$943.46
—
6.1×
BMO / Mizuho
$1,300
37.8%
8.4×
Analyst average
$1,515
60.6%
9.8×
Analyst low
$361
−61.7%
2.3×
Analyst high
$2,200
+133.2%
14.2×
Next dated catalyst: Micron reports fiscal fourth-quarter results on September 30 at 2:30 p.m. Mountain time. Watch HBM shipments, memory pricing, gross margin and fiscal 2027 capex.
Main risk: A slower AI-server buildout, weaker HBM pricing or faster rival capacity additions could compress the earnings estimate that makes Micron appear inexpensive.
Okta Inc. shares surged 20.89% to $162.50 in premarket deals as of 04:08:52 EDT. The gain came after Okta beat quarterly backlog estimates, providing…
·3 min read
NASDAQ: OKTA · Q2 FY2027
The rally prices in a backlog inflection
Current subscription backlog accelerated faster than revenue. Cash conversion improved too. The remaining question is whether the 21% premarket reset outran a modest full-year guidance increase.
Market data: Aug. 27, 2026, 04:08:52 EDT Financials: quarter ended July 31, 2026
Premarket price
$162.50
+20.89%
vs. $134.42 Aug. 26 close
Value added
≈$4.9B
Estimate from $23.57B Aug. 26 market cap
Current RPO
$2.585B
+14% YoY
$75M above consensus
Free cash flow
$227M
+40% YoY
28.1% margin, +5.8 pts
Current backlog regained momentum
Quarterly cRPO rose from $2.499B in Q1 to $2.585B in Q2. Management guides Q3 cRPO to $2.590B–$2.600B, implying 11%–12% year-over-year growth.
Beat, raise and valuation
Q2 revenue$805M · +11%
Revenue beat$12M vs. consensus
Adjusted EPS$1.05 vs. $0.97
FY27 revenue midpoint$3.221B
Midpoint increase+$21M · +0.7%
Analyst mean target$146.34
At $162.50, the premarket price stood 11.0% above Yahoo’s mean analyst target at 04:08:52 EDT.
Operating signals
Subscription mix
$793M of $805M revenue
Non-GAAP subscription gross margin
83.9%, up 0.2 percentage point
Free-cash-flow margin
28.1%, up 5.8 percentage points
Customers above $100K ACV
5,255, up 6% year over year
What must happen next
Test
Latest
Next threshold
Investor read
cRPO growth
14%
11%–12% Q3 guide
Deceleration is already guided
Revenue growth
11%
10% Q3 guide
Backlog must convert cleanly
FCF margin
28.1%
21%–23% Q3 guide
Quarterly seasonality rises
Net retention
107%
Hold or improve
Confirms expansion quality
Risk map
Price riskPremarket gain may reverse when regular liquidity returns.
Growth riskFY2027 revenue still grows only 10%–11%.
Mix riskPartnering out professional services cuts reported growth by about one point.
Execution riskAI-agent products need bookings without weakening renewal economics.
Waymo is set to start mapping Munich in the coming weeks as it prepares for a commercial rollout by late 2027. This marks Alphabet's…
·3 min read
Google Trend: goog · NASDAQ: GOOG
Waymo adds Munich while Alphabet's loss burden grows
The city count is rising faster than disclosed economics. Investors now need evidence that paid rides can narrow Other Bets' widening loss.
Market data: Aug. 27, 2026 05:30 EDT · premarket
GOOG premarket
$337.49
−$1.61 · −0.47%
After Wednesday's $339.10 close
Wednesday move
−1.23%
About $51.7B of market value erased
Paid rides
500K+
Weekly Waymo commercial rides
Other Bets Q2 loss
$1.80B
4.71 times segment revenue
Why the stock is down despite expansion
Munich is strategically useful, but Waymo gave no fleet size, price, capital budget or expected revenue. The planned public opening is still more than a year away.
Other Bets revenue grew only 2.4% year over year. Its operating loss widened 44.4%. The market move cannot be assigned solely to Waymo, but the disclosure adds no near-term earnings support.
Munich launch card
Item
Current fact
Stage
Mapping begins within weeks
Testing
Manual mapping, then trained safety specialists
Commercial target
Public robotaxi service by late 2027
Regulation
Local, Bavarian and federal approvals required
Operating footprint
11 U.S. cities today; Munich would be first German market
Economics disclosed
No fleet, price, capex or revenue forecast
Investor bridge: rides, revenue and loss
Measure
Current figure
Investor read
Cumulative Waymo trips
20M+
Commercial scale is proven
Weekly commercial rides
500K+
26M+ annualized ride volume
Illustrative revenue run rate
$468M
500K rides × $18 assumed fare × 52 weeks
Other Bets Q2 revenue
$382M
Up $9M, or 2.4%, year over year
Other Bets Q2 operating loss
$1.799B
Up $553M, or 44.4%
Waymo does not report standalone revenue or margin. The $18 fare is an explicit scenario, not company guidance.
Stock and valuation
Market value$4.15TAug. 27, 05:30 EDT
P/E17.0×Trailing earnings
Avg. volume19.31MGoogle Finance
Waymo remains too small to explain Alphabet's valuation alone. Its importance lies in optionality and future capital intensity.
Analyst expectations
Ratings11 Buy1 Hold · 0 Sell
Average target$430.70+27.0%
Target range$379–$475Last three months
Consensus from 12 analysts shown by Google Finance on Aug. 27, 2026.
Scale versus profitability
Scenario
Annual ride revenue
Versus annualized Other Bets loss
$15 average fare
$390M
5.4%
$18 average fare
$468M
6.5%
$20 average fare
$520M
7.2%
Annualized Q2 Other Bets loss
$7.20B
100%
Scenarios use 500,000 weekly rides. They exclude discounts, partner shares and costs.
Catalyst timeline
Q2 2026
Other Bets posts $382M revenue and a $1.799B operating loss.
Aug. 25
Waymo announces Munich as its first German market.
Weeks
Manual mapping starts across Munich streets.
Next
Supervised autonomous testing and regulatory review.
Late 2027
Target for public commercial ride-hailing service.
Menlo Park, August 27, 2026, 04:32 - Meta Platforms saw its share price advance by 1.1% and its valuation climb by $13.5 billion after…
·3 min read
Meta: $18B child-safety settlement
NASDAQ:META • company stock move • legal and product catalyst
Close: Aug. 26, 2026, 16:00 EDT Premarket: Aug. 27, 2026, 04:32 EDT Prepared: Aug. 27, 2026, 10:53 CEST
Aug. 26 close
$576.14
+1.07% • +$6.09
Premarket
$574.79
−0.23% • −$1.35
Value added
$13.5B
Estimated on 2.21B shares
Expected Q3 charge
$10.0B
53.3% of Q2 operating income
Market reaction
The closing gain added about 75% of the maximum settlement cost to Meta’s quoted value.
Trading activity
Volume
31.42M
169% of 65-day average (18.55M)
Valuation
$1.48T
21.7× trailing earnings
Settlement economics
Maximum agreements
$18.0B
Proposed state payment
Up to $17.0B
Payment period
10 years
Expected Q3 charge
$10.0B
Q2 operating income
$18.78B
Cash + securities
$90.26B
The maximum total equals 29.6% of Q2 revenue and 19.9% of cash and securities.
Required product changes
Two-hour defaultDaily limit for users under 18
Midnight–6 a.m.Night block; parent can approve changes
Age assuranceStronger systems for minors
Independent auditCompliance monitoring
School hoursNotification restrictions
Filter limitsRestrictions on harmful appearance effects
The proposed consent judgment remains subject to court approval.
Operating scale — Q2 2026
Revenue
$60.80B • +28%
Operating income
$18.78B • −8%
Net income
$15.85B • −14%
Capital expenditures
$31.08B
Daily active people
3.60B • +3%
Ad impressions / price
+14% / +12%
Social-platform peers — Aug. 26 close
Company
Move
Market cap
Meta
+1.07%
$1.48T
Snap
−8.53%
$9.02B
Alphabet
−1.40%
$4.18T
Pinterest
−1.46%
$13.12B
Meta was the only gainer in this comparison.
Analyst expectations
Buy
Mean recommendation • 62 analysts
Low $580Average $754.72High $1,000
The average target implies 31% upside. The low target is only 0.7% above Wednesday’s close.
Next checks
Court approvalConsent judgment is not yet final
Q3 filingCompare final charge with $10B estimate
EngagementWatch effects of limits on younger users
Remaining casesSome states and private plaintiffs continue
Risk channel
The balance sheet can fund the settlement, but cash cost is only one variable. Judicial changes, continuing litigation and implementation spending could lift the final burden. Product restrictions may reduce time spent by younger users, affecting ad inventory. The observable test is whether engagement and ad-impression growth weaken after safeguards take effect.
D-Wave Quantum Inc. shares dropped 9.51% on Wednesday following news of the chief financial officer's retirement. The stock ended the session at $17.51, before…
·3 min read
D-Wave Quantum: CFO-transition selloff
NASDAQ:QBTS • company stock move
Market data: Aug. 26, 2026, 19:59 EDT Prepared: Aug. 27, 2026, 10:38 CEST
Regular close
$17.51
−9.51% • −$1.84
After hours
$17.88
+2.11% • +$0.37
Value erased
$679M
Estimated on 369.26M shares
Net unrecovered
$543M
After $137M late rebound
Price path
The after-hours recovery replaced about 20% of the regular-session equity-value loss.
Trading pressure
Volume
26.53M
109% of 65-day average (24.33M)
Distance from 52-week high
−62.5%
Range: $12.75–$46.75
Governance timeline
Aug. 19Markovich gives notice
Aug. 25Retirement announced
Aug. 26Shares fall 9.51%
Sep. 2Golkov becomes acting CFO
The SEC filing says the resignation was not caused by a disagreement over operations, accounting, disclosures or controls.
Financial execution test
Q2 revenue
$3.1M
Q2 GAAP operating expenses
$55.0M
Q2 adjusted EBITDA loss
$37.1M
First-half bookings
$35.5M
Remaining obligations
$40.7M
Cash + securities
$546.2M
The $543M unrecovered value equals 15.3× first-half bookings and roughly 175× quarterly revenue.
Quantum peer snapshot — Aug. 26 close
Company
Close
Move
Market cap
D-Wave
$17.51
−9.51%
$6.52B
IonQ
$40.03
−4.83%
$14.72B
Rigetti
$15.94
−5.87%
$5.31B
Quantum Computing
$8.35
−1.24%
$1.88B
Analyst expectations
Buy
Mean recommendation • 17 analysts
Low $22Average $35.24High $43
The average target is 101% above the $17.51 close. Targets are estimates, not guarantees.
What can break the case
Large system contracts make revenue recognition uneven. First-half bookings included one $20 million sale. A slower conversion of the $40.7 million obligation balance, continued operating-cost growth, or another finance-management change would increase valuation pressure. Continuity on September 2 is the next confirmed governance checkpoint.