WARSAW, August 26, 2026, 21:10 CEST — Shares in Snap Inc. dropped 7.94% to $5.45 on Wednesday afternoon as a youth-safety lawsuit in Pennsylvania and Meta Platforms' up-to-$18 billion settlement weighed on investor sentiment.
WARSAW, August 26, 2026, 21:10 CEST — Shares in Snap Inc. dropped 7.94% to $5.45 on Wednesday afternoon as a youth-safety lawsuit in Pennsylvania…
·4 min read
S
Snap Inc. NYSE: SNAPEvent-driven investor dashboard
Regular session · delayed feed
Pennsylvania teen-safety lawsuit
Snap slides 7.9% as a new state case sharpens the legal overhang
Pennsylvania sued Snap under its consumer-protection law, alleging deceptive safety and age-rating claims and an addictive, high-risk design for minors. These are allegations, not findings; the complaint specifies no dollar liability.
$5.45−$0.47 / −7.94%
Prior close $5.92Open $5.97Day $5.33–$6.0152-week $3.81–$9.28
Market snapshot: Aug. 26, 2026, 2:47:31 p.m. EDT · latest trade in delayed consolidated feed · retrieval 3:02:58 p.m. EDT
Volume52.0M
1.24× 3-month average of ~41.93M · Aug. 26, 2:47 p.m. EDT
From 52-week high−41%
Derived from $5.45 and $9.28 · Aug. 26 snapshot
From 52-week low+43%
Derived from $5.45 and $3.81 · Aug. 26 snapshot
Tape check
All values: Aug. 26, 2026, about 2:47 p.m. EDT · delayed
Where the latest trade sits
Day $5.33 52W $3.81Latest $5.45Day $6.01 52W $9.28
Peer tape
SnapNYSE: SNAP · P/E N/M
$5.45
−7.94%
Meta PlatformsNASDAQ: META · TTM P/E ~21.9×
$580.65
+1.86%
PinterestNYSE: PINS · TTM P/E ~68.9×
$23.41
−1.06%
SNAP underperformed META by 9.80 percentage points and PINS by 6.88 points at the same snapshot. That comparison supports a stock-specific repricing; it does not prove the lawsuit caused every part of the move.
Reuters reported that Meta separately agreed to pay up to $18 billion and make youth-safety product changes. Snap is not a party to that settlement, but its scale supplies a same-day industry benchmark for legal and product-remedy risk.
Catalyst: what Pennsylvania filed
Public redacted complaint dated Aug. 25, 2026
!
Commonwealth v. Snap Inc.
Philadelphia Court of Common Pleas · Pennsylvania Unfair Trade Practices and Consumer Protection Law (UTPCPL)
The state alleges Snap understated mature content to secure age ratings suitable for users 13 and older.
It challenges features including infinite scroll, autoplay, notifications, Snapstreaks, friend discovery, location sharing and ephemeral messages as deceptive or unfair for minors.
The requested relief includes declarations, temporary and permanent injunctions, civil penalties, costs, fees and other equitable relief.
No dollar damages amount is stated in the complaint’s prayer for relief.
Snap said the allegations “fundamentally misrepresent our platform and our approach to teen safety,” and said it remains focused on strengthening safeguards. The case is at the allegation stage.
Why the market can care before damages are known
The near-term issue is remedy uncertainty. An injunction could matter through product design, marketing, compliance cost or engagement—not only through a cash penalty.
ComplaintUTPCPL claims filed Aug. 25
Possible remedyOnly if the state prevails or parties settle
Product effectDesign, ratings, marketing or youth safeguards
Financial channelEngagement, ad inventory, cost or cash outflow
Risk transmission, not a forecast. Snap’s Aug. 4 10-Q—filed before this Pennsylvania case—already said youth-harm litigation outcomes were uncertain and that it could not estimate a reasonably possible loss range for those matters.
Fundamental counterweight
Q2 2026 · three months ended June 30, 2026 · company-reported
Q2 scorecard
Metric
Q2 2026
Q2 2025
YoY
Revenue
$1.599B
$1.345B
+19%
Advertising revenue
$1.283B
$1.174B
+9%
Other revenue
$316M
$171M
+85%
Adjusted EBITDA
$250M
$41M
+505%
Net loss
$(164)M
$(263)M
38% narrower
Free cash flow
$121M
$24M
+407%
Average DAU
493M
469M
+5%
Global ARPU
$3.25
$2.87
+13%
Exact reported figures were $1,598.993M revenue, $249.615M adjusted EBITDA, $(163.960)M net loss and $120.538M FCF. Adjusted EBITDA and FCF are non-GAAP measures.
Revenue is diversifying; core-market users are the watchpoint
Advertising$1.283B
Other / direct$316M
Ad mix fell from 87.3% a year earlier; subscription-led other revenue rose to 19.8%.
North America DAU−7%Q2 2026 YoY
Europe DAU−2%Q2 2026 YoY
Rest-of-world DAU+12%Q2 2026 YoY
Paying penetration<3%of 971M Q2 MAU; no exact subscriber count disclosed
Outlook, estimates and valuation
Company outlook Aug. 3 · consensus estimate update Aug. 18 · market inputs Aug. 26
Company outlook
Q3 revenue$1.70–1.74BCompany guide · Aug. 3, 2026
Q3 adj. EBITDA$300–350MCompany guide · Aug. 3, 2026
FY infrastructure$1.65–1.70BRaised from $1.60–1.65B
FY stock comp.~$1.05BCompany outlook · Aug. 3
The Q3 revenue range implies roughly 12.8%–15.5% growth versus Q3 2025, derived from $1.5068B.
Street estimates
FY2026 revenue$6.69BVendor consensus · updated Aug. 18, 2026
FY2026 GAAP EPS−$0.10Vendor consensus · updated Aug. 18, 2026
Implied revenue growth~13%Derived vs. FY2025 revenue $5.931B
Company 2027 viewGAAP profitManagement expects sustained positive net income
Consensus is an aggregate, not company guidance, and can change after legal or operating developments.
Snapshot valuation
Market cap / TTM sales~1.4×$9.1B / $6.351B
EV / TTM adj. EBITDA~9.7×Approx. EV $9.9B / $1.023B
Market cap / TTM FCF~12.9×$9.1B / $706M
GAAP P/EN/MTTM GAAP net loss
Derived using the Aug. 26 intraday market value and June 30 balance sheet: $2.660B cash/securities and $3.535B debt. Snap reported 1.691B shares outstanding across all three classes as of July 30; vendors can use different share-count conventions. These are mixed-date approximations.
The $11 spread between low and high targets signals unusually broad model uncertainty. Targets are opinions, not promised outcomes.
What changes the setup
Observable checkpoints, not predictions
Legal
Relief becomes concrete
A quantified penalty, injunction request, adverse preliminary ruling or settlement term would replace today’s open-ended exposure with a more modelable cost or product constraint.
October 2026
Bellwether cases
Snap’s June 30 filing said the next two California JCCP youth-harm bellwether trials involving Snap were scheduled for October. Trial timing or resolution can reset risk expectations.
Operating proof
Q3 delivery
Revenue inside the $1.70B–$1.74B guide and adjusted EBITDA inside $300M–$350M would test whether Q2’s ad recovery and direct-revenue growth persist through the legal noise.
Mitsubishi Motors is set to debut the 2027 Pajero on September 2. The flagship SUV makes a comeback to international markets after a five-year…
·3 min read
Product catalyst · TYO:7211
2027 Mitsubishi Pajero
Flagship SUV return meets a low-margin growth plan.
Market data: August 26, 2026, 15:30 JST · Dashboard: August 27, 2026, 03:42 JST
Close
¥374.70
▲ 2.52%
Tokyo close, Aug. 26
Session volume
8.57M
shares traded
Market value
¥501.6B
approximate; 1.34B shares
Analyst target
¥372.83
0.5% below the close
Wednesday's price action
Open¥364.20
Low¥362.00
High / close¥374.70
Equity-value gain≈¥12.3B
Equity-value change uses the ¥9.20 share gain and 1.34 billion shares outstanding.
Fiscal 2026 operating frame
Retail volume857,000 · +8%
Net sales¥3.26T · +13%
Operating profit¥90B · +19%
Operating margin2.8% vs. 2.6%
Sensitivity: 10 basis points of margin on ¥3.26 trillion equals ¥3.26 billion, or 3.6% of guided operating profit.
Pajero commercial signal
Signal
Verified measure
Global return
After 5 years
Lifetime sales
>3.25M units
Historical markets
>170
Dakar record
12 wins
Platform
Triton ladder frame
Drive control
S-AWC
Lifetime Pajero sales equal 3.8 times Mitsubishi's current full-year volume target.
What the market still needs
AUG 24
Teaser update
Reveal date and triple multi meter confirmed.
SEP 2
World premiere
Pricing, powertrain and initial markets are key.
H2 FY26
Launch phase
Management links Pajero to sales growth.
FY26
Plan test
857,000 retail units and 2.8% margin.
Risk watch: procurement and shipping are a ¥28.7 billion headwind. Delays, discounting or costly launch inventory would press a narrow margin target.
Analyst expectations
2 Buy7 Hold3 Sell12-analyst poll, accessed August 26
Target range¥330–¥500
Average target¥372.83
52-week trading range¥300.70–¥458.00
Sources: Mitsubishi Motors official Pajero site and releases; Mitsubishi Motors Q1 presentation summary; StockAnalysis and Investing.com market and consensus data. Currency is Japanese yen. Estimates are explicitly marked.
India's family-SUV market gets two hybrid options with MG's Hector Tomahawk. The brand's battery-rental scheme further shifts car ownership costs towards a subscription model.
·3 min read
Product / commercial catalyst · SHA:600104
MG Hector Tomahawk: price, range and SAIC exposure
Product data: Aug. 26, 2026, 23:20 IST SAIC close: Aug. 26, 2026, 15:00 CST
EV price
₹1.95m
BaaS: ₹1.40m
EV range
517km
69.2kWh · 150kW
PHEV price
₹2.57m
BaaS: ₹2.18m
SAIC close
CN¥10.39
▲ 0.78%
Two electrified offers
Metric
EV
PHEV
Battery
69.2kWh
20.5kWh
Electric range
517km
115km
Combined range
—
1,100km+
BaaS rental
₹4.90/km
₹3.20/km
Delivery start
September
November
Upfront discount versus recurring cost
EV BaaS cuts entry cost 28.2%; PHEV BaaS cuts it 15.2%. At 10,000km per year, rentals add ₹49,000 and ₹32,000.
SAIC / India financial bridge
JSW MG 2025 sales
70,500 vehicles
Growth vs. 2024
+15.6%
Current annual capacity
120,000
Planned annual capacity
300,000
Planned investment
$330m–$440m
FY2025 venture loss
$121m
One percentage point of planned capacity equals 3,000 vehicles. Tomahawk needs sustained deliveries to raise utilization and dilute fixed costs.
SAIC market snapshot
Close / daily move
CN¥10.39 / +0.78%
Volume
32.57m shares
Market value
CN¥117.79bn
Trailing revenue
CN¥655.8bn
Trailing net income
CN¥10.11bn
Trailing P/E
11.6×
Next earnings date
Aug. 29, 2026
What to watch
Checkpoint
Timing
Signal
EV registrations
September
Search interest converting into paid deliveries
PHEV handovers
November
Demand for long-range hybrid packaging
Localization
2026–2027
Lower FX and freight exposure
Capacity ramp
Multi-year
Utilization against 300,000-unit target
Bull case
BaaS lowers the upfront barrier without eliminating lifetime revenue.
ADAPT spreads engineering across EV and hybrid variants.
India vehicle sales can grow into planned capacity.
Risks
Introductory prices cover limited volumes. Rentals may deter high-mileage drivers. Domestic rivals, charging gaps, continuing venture losses and India-China investment restrictions can slow returns.
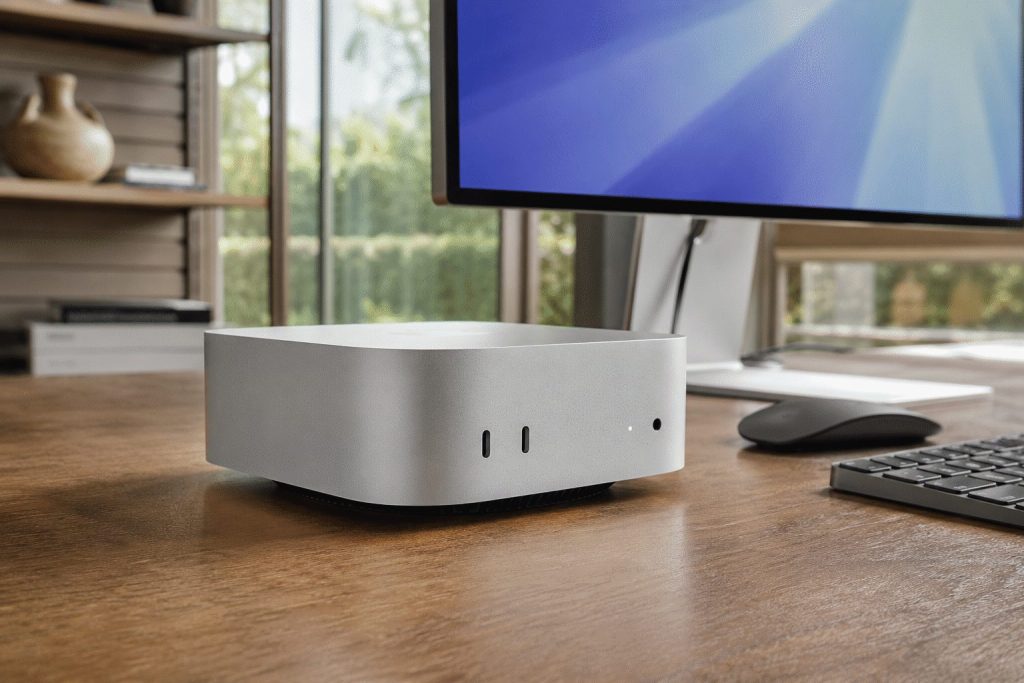
Apple's Mac mini featuring the new M6 comes at a steeper price for its compact desktop line. Apple Inc. stock gained 1.1% to $313.37…
·3 min read
Mac mini with M6 · Apple NASDAQ:AAPL
A 12.5% price test for a record Mac business
Company · Product/commercial catalyst
Market data: August 26, 2026, 11:11:19 EDT Financials: fiscal Q3 ended June 27, 2026
AAPL price
$313.37
+$3.47 · +1.12%
Nasdaq real-time, market open
Mac mini M6
$899
+$100 · +12.5%
U.S. starting price versus predecessor
Mac revenue
$10.4B
+28.7% year over year
Record June quarter
Market value
$4.573T
About $50.6B added at 11:11 EDT
The launch connects pricing to local-AI demand
Consumer entryProfessional AI mix
Mac's financial weight
Mac share of Q3 revenue9.5%
Mac year-over-year growth28.7%
$100 price rise / old $799 base12.5%
One point of quarterly Mac growth≈$104M
Latest company signals
Fiscal Q3 2026
Value
YoY
Revenue
$109.4B
+16%
Net income
$29.8B
+27%
Diluted EPS
$2.02
+29%
Gross margin
50.1%
+3.6 pts
Mac revenue
$10.4B
+28.7%
Gross margin included an approximately two-point tariff-refund benefit.
Investor transmission map
Higher priceA $100 increase supports revenue per unit.
AI performanceM6 targets local models and always-on agents.
Memory costsComponent inflation can absorb pricing gains.
Unit demandA 12.5% entry-price rise can slow volumes.
Stock and valuation
Session range$308.80–$313.45
Volume at 11:06 EDT7.20M
Average volume55.95M
Trailing P/E35.94×
52-week range$225.95–$344.57
Analyst expectations and next checks
S&P Global consensusBuy
Average target$326.34
Target upside at timestamp4.1%
Estimated earningsOctober 29, 2026
Risks
Apple gives no Mac mini unit or revenue forecast. Higher prices may weaken demand. Memory constraints can delay shipments or pressure margins. Product claims are based on Apple's controlled tests.
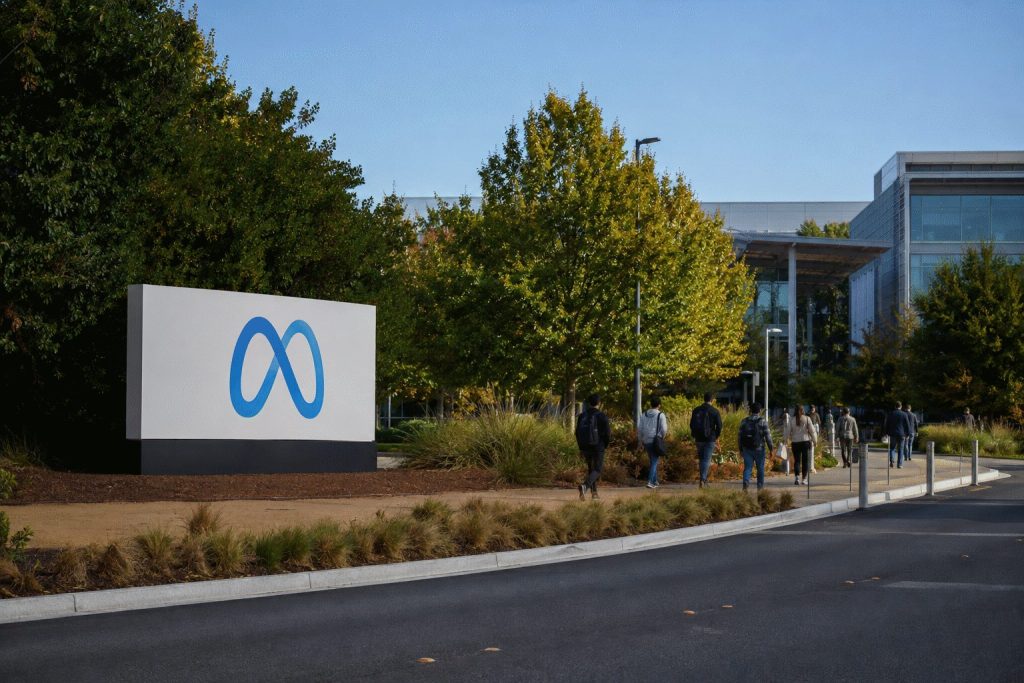
Meta Platforms, Inc. shares gave back most of an early 4.1% jump on Wednesday. The stock traded at $573.05, up 0.5%, at 10:09 a.m.…
·2 min read
Meta Platforms · NASDAQ:META
Settlement relief meets a $10 billion charge
Company · Stock move
Market data: August 26, 2026, 10:09:24 EDT Financials: quarter ended June 30, 2026
Share price
$573.05
+$2.99 · +0.53%
Nasdaq real-time, market open
Intraday path
$561.95–$593.27
Opened $590.44; high was +4.07% versus prior close
Volume
12.33M
66.8% of 18.45M average by 10:09 EDT
Market value
$1.46T
Quoted gain near $7.6B at the timestamp
The market repriced the headline twice
Relief at avoided trial exposureCharge and operating terms absorbed
Charge versus Meta's balance sheet
$10B Q3 charge / Q2 net income63.1%
$10B Q3 charge / cash & securities11.1%
$16.68B maximum / Q2 net income105.3%
$16.68B maximum / cash & securities18.5%
Latest operating signals
Q2 2026
Value
YoY
Revenue
$60.80B
+28%
Net income
$15.85B
-14%
Operating margin
31%
-12 pts
Ad impressions
—
+14%
Average ad price
—
+12%
Daily active people
3.60B
+3%
Investor transmission map
SettlementTrial uncertainty falls; maximum payment becomes measurable.
AccountingAbout $10B hits Q3 legal expense and GAAP earnings.
Product controlsTeen time limits and overnight blocks can reduce engagement.
AdvertisingLower engagement can reach impressions, price and Family of Apps revenue.
Valuation and expectations
TTM P/E21.54×
Forward P/E at $573.0518.4×
2026 consensus EPS$31.16
Average analyst target$754.84
Implied target upside31.7%
Ratings47 strong buy · 8 buy · 7 hold
What to watch next
Q3 revenue guidance$61B–$64B
2026 capex guidance$130B–$145B
Estimated Q3 reportOctober 28, 2026
Risks
Court approval, payment timing and the conditional $5.3B remain unresolved. Meta faces thousands of related cases. Teen protections could affect engagement and advertising economics. The charge may force a revised expense outlook.
The Witcher 3: Wild Hunt — Remastered gives CD Projekt S.A. a low-price acquisition tool for its 2027 paid expansion. The upgrade is free…
·3 min read
WSE: CDR · Product catalyst
The Witcher 3: Wild Hunt — Remastered
A free September upgrade expands the funnel for a paid 2027 expansion.
Market snapshot Aug. 26, 2026 · 15:23:28 CEST
Share price
240.90 zł
−0.82% · −2.00 zł
Range 240.00–246.70 zł
Trading activity
395.85K
1.39× average daily volume
Average: 285.26K shares
Installed base
65M+
Lifetime Witcher 3 copies sold
Analyst case
70–75M
Potential base before 2027 expansion
From free upgrade to paid-content revenue
Sept. 29 Free remaster
→
New reach Switch 2 + Battle.net
→
2027 Paid Songs of the Past
Launch facts
Gamescom reveal and trailer.
Original expansions become free for existing owners.
Remaster launches; new native Switch 2 and Battle.net editions.
Paid Songs of the Past expansion.
Q1 2026 economics
Metric
Value
YoY
Group revenue
191.1M zł
+6%
Witcher IP revenue
44.7M zł
+36%
Witcher share of sales
23.4%
+5.2 pts
Net profit
106.2M zł
−5%
Cash/deposits/bonds
1.41B zł
+6% q/q
Stock and valuation
Signal
Reading
Market cap
24.01B zł
Quoted value lost today
≈199.8M zł
Trailing P/E
39.41×
52-week range
211.30–297.00 zł
Shares outstanding
99.91M
Erste view
Meaningful positive Q4 impact
Investor interpretation
Driver
Upside
Constraint
Free remaster
Reactivates a 65M-player catalogue
No upgrade revenue from existing owners
New platforms
Incremental unit sales and distribution
Platform royalties and launch costs
Paid 2027 expansion
Monetizes a larger installed base
Pricing and release date undisclosed
2028 Witcher 4 target
Extends franchise roadmap
Long flagship-release gap
Risk check
The 70–75 million-copy figure is an analyst estimate. A free update can lift engagement without converting into enough new purchases or expansion sales.
Attention signal
Google Trend: “the witcher 3 wild hunt remastered” · Canada, active at selection; trading volume already above average.
Sources: CD Projekt announcement and Q1 2026 presentation; Reuters, Aug. 26, 2026; Google Finance at 15:23:28 CEST. Time-sensitive figures are timestamped above.
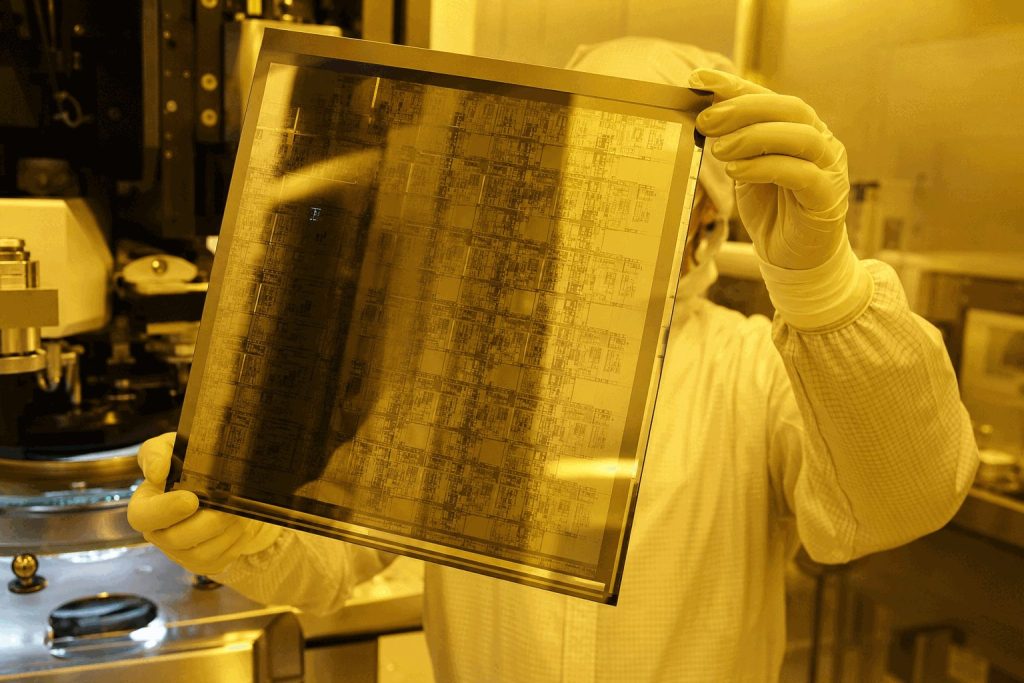
BROOKFIELD, Connecticut, August 26, 2026, 09:20 - Photronics stock rose 23% in premarket trading after the company reported that high-end IC mask mix soared…
·3 min read
Photronics investor dashboard
NASDAQ:PLAB · Premarket snapshot: August 26, 2026, 09:18 EDT
Q3 FY2026 · earnings released
Premarket price
$36.12
+$6.80 · +23.19%
Implied value added
$400.9m
58.96m shares outstanding
Revenue / estimate
$216.0m
+3.5% beat
Adjusted EPS / estimate
$0.50
+24.0% beat
Quarterly revenue mix
IC photomasksFPD photomasksUSD millions
Why the market is paying attention
High-end IC mix reached a record 44% of IC revenue. That implies about $68.1m of quarterly high-end IC sales, or 31.5% of company revenue.
The $400.9m premarket value gain equals 5.9 times this estimated quarterly revenue stream. It prices a richer mix, not just a modest top-line beat.
Margin confirmation matters: Q3 gross margin recovered to 33.2%, but remained below the 33.7% level one year earlier.
Operating scorecard
Metric
Q3 FY26
Q2 FY26
Q3 FY25
Signal
Revenue
$216.0m
$209.9m
$210.4m
Improving
IC revenue
$154.7m
$147.5m
$147.8m
+5% both ways
FPD revenue
$61.4m
$62.4m
$62.6m
-2% both ways
Adjusted EPS
$0.50
$0.42
$0.51
Sequential rebound
Gross margin
33.2%
31.3%
33.7%
+190 bp q/q
Operating margin
21.1%
20.1%
22.9%
Below year ago
Q4 FY2026 guide versus consensus
Revenue
$207m–$227m
Midpoint $217m vs. $215.7m consensus
Adjusted EPS
$0.40–$0.56
Midpoint $0.48 vs. $0.42 consensus
Operating-margin guidance: 19%–24%; midpoint 21.5% versus Q3’s 21.1%.
Liquidity and valuation
Implied premarket market cap
$2.13bn
Cash + short-term investments
$672.8m
JV-associated portion
$503.5m
Q3 operating cash flow
$76.3m
Q3 capex
$37.0m
Analyst average target
$46.00
The $46 target implies about 27% upside from $36.12. Three tracked analysts rate the shares Buy; coverage is limited.
Catalysts and risks
What can extend the move
Volume confirms the premarket revaluation.
High-end IC mix stays near the 44% record.
Q4 revenue and margin land above their midpoints.
U.S. and Korea capacity investments remain on schedule.
What can break the thesis
Premarket liquidity exaggerates the opening move.
FPD weakness spreads into another quarter.
Customer design releases slip again.
Joint-venture cash is less accessible than headline liquidity suggests.
ASUS launched U.S. preorders for the ROG Xbox Ally X20 at $1,299. Shares of ASUSTeK Computer Inc., the parent company, gained 4.97% to NT$971…
·3 min read
Product / Commercial Catalyst
ROG Xbox Ally X20 investor dashboard
Market data: Aug. 26, 2026, 13:30 CST Product data: Aug. 25, 2026
ASUSTeK close
NT$971
▲ 4.97% · +NT$46
Value added
NT$34.2B
Estimated from 742.76M shares outstanding.
X20 price
$1,299
30% above Ally X
Analyst view
Buy
13 analysts · NT$1,018 average target · 4.85% upside.
Premium ladder — U.S. list price
ROG Xbox Ally
$600
ROG Xbox Ally X
$1,000
ROG Xbox Ally X20
$1,299
X20 bundle
$2,499
The standalone X20 is 116.7% above ASUS's entry handheld. The bundle is 92.4% above the standalone X20.
Share move versus operating scale
The market-value gain was 1.74× quarterly operating profit. This is scale context, not proof that the launch caused the stock move.
Hardware and financial signals
Signal
Latest
Change / context
Investor read-through
Q2 brand revenue
NT$241.1B
+39% YoY
Premium products support growth
Q2 operating profit
NT$19.6B
+230% YoY
Strong operating leverage
Gross margin
16.5%
+4.1 pts YoY
Mix is financially material
High-value mix
>65%
Q2 revenue share
X20 fits stated strategy
X20 display
7.4-inch OLED
1080p · 120Hz
Supports 30% price premium
Processor
Ryzen AI Z2 Extreme
8 cores · 50 TOPS NPU
Matches prior Ally X silicon class
Catalyst path
Aug. 25 · Preorders opened$1,299 standalone; $2,499 bundle
Aug. 26 · Taiwan close2357 gained 4.97% to NT$971
Oct. 15 · On-shelf dateFirst delivery and channel checks
What could break the thesis
ASUS disclosed no preorder count, production target or product margin. A limited edition can lift average selling price without moving total revenue. Component inflation, premium-handheld competition and weak conversion after October 15 are the key measurable risks.
Shares in WiseTech Global Limited dropped 9.6% on Wednesday. The company finished at A$41.10, after reaching as low as A$40.80 during the session, market…
·3 min read
ASX:WTC · Company · Stock move
Growth slowed. The valuation reset.
Market data: 26 Aug 2026, 16:12 AEST Financials: FY ended 30 Jun 2026
CloseA$41.10−9.6% · A$4.37
Quoted value erasedA$1.46bn333.43m shares × A$4.37
FY26 revenueUS$1.396bn+79% year on year
FY27 revenue guideUS$1.48–1.54bn+6% to +10%
The earnings bridge
Revenue+79%
Underlying EBITDA+56%
Free cash flow+43%
Statutory NPAT−11%
US$ million
FY25
FY26
FY27 guide
Revenue
778.7
1,395.9
1,480–1,540
Underlying EBITDA
413.9
644.5
725–780
Underlying margin
53%
46%
49%–51%
Statutory NPAT
200.7
178.7
—
What drove attention
e2open: US$541.2m of revenue from 11 months of consolidation.
CargoWise: US$756.9m revenue, up 11%.
Cash: US$489.6m underlying free cash flow, up 67%.
Leverage: 2.7× net debt/EBITDA at 30 Jun 2026.
Efficiency: US$115m annualised run-rate savings.
Price reaction versus Tuesday's close
Analyst expectations
A$65.16
Average target from 16 analysts, published before the FY26 result. Consensus: Buy. Implied upside from A$41.10: 58.5%.
11 Strong Buy2 Buy3 HoldJul 2026 snapshot
What can break the thesis
Revenue growth must reaccelerate after e2open's first-year step-up. Freight weakness can slow transaction revenue. Integration costs, regulatory scrutiny and restructuring may delay the 49%–51% FY27 margin target.
ACCC inquiryIntegrationFreight cycleExecution
Sources: WiseTech FY26 results and investor centre; ASX-market reporting; StockAnalysis S&P Global consensus. All company financials are in U.S. dollars unless stated. Market-value change is an estimate using reported shares outstanding.
Intuit shares dropped 11.66% ahead of Wednesday’s market open after the company’s full-year forecast came in below analyst projections. Intuit Inc. was trading at…
·3 min read
INTU investor dashboard
Outlook reset overwhelms a Q4 beat
Premarket data: Aug. 26, 2026, 05:09 EDT Guidance: Aug. 25, 2026
Premarket price
$315.77
−11.66% from $357.46 close
Value erased
≈$11.4B
$41.69 × 273.54M shares
FY27 revenue midpoint
$23.396B
$324.5M below LSEG consensus
Valuation
21.6×
Trailing P/E at Aug. 25 close; YTD −46.04%
One-day repricing
*Estimate uses $315.77 premarket price and 273.54 million shares outstanding.
Why investors reacted
Measure
Guide
Street
Gap
FY27 revenue
$23.279B–$23.512B
$23.72B
−$324.5M*
Q1 revenue
$4.294B–$4.313B
$4.36B
−$56.5M*
FY27 adj. EPS
$22.88–$23.12
$27.32
basis shift
*Midpoint gap. LSEG consensus cited by Reuters. EPS guidance now includes share-based compensation.
Growth moves down the stack
FY26 actual → FY27 guide
Business
FY26
FY27
Signal
Company
+14%
+9%–10%
slower
TurboTax
+7%
+2%–3%
pricing reset
Consumer Group
+11%
+4%–6%
volume focus
Credit Karma
+20%
+11%–13%
normalizing
Mailchimp
not disclosed
−1% to 0%
drag
Global Business Solutions
+16%
+13%–14%
resilient
Operating base
FY26 revenue
$21.448B
+14%
Q4 revenue
$4.354B
beat $4.27B estimate
Cash and investments
$7.2B
Aug. 25 release
FY26 repurchases
$5.5B
share count −2%
Remaining authorization
$7.9B
Aug. 25 release
TurboTax economics
FY26 revenue
$5.3B
Federal units
39.0M
−2%; desktop −7%, online −2%
TurboTax Live
53%
share of franchise revenue; Live revenue +37%
Analyst expectations
Consensus
Buy
35 analysts; average target $446.02
Recent target range
$250–$500
Piper Sandler to Jefferies
19 strong buy
5 buy
9 hold
2 sell
Consensus snapshot and published actions checked Aug. 26, 2026.
What changes the thesis
Bull case: lower entry pricing restores filer growth, while TurboTax Live keeps mix and service revenue rising.
Bear case: discounts reduce revenue per customer before volumes respond. Flat Mailchimp sales deepen the drag.
Accounting watch: fiscal 2027 adjusted EPS includes a $5.81 share-based-compensation impact. Prior periods excluded it.
Next checkpoint
Event
Investor Day
Date
Sept. 17, 2026
Time
11:00 EDT
Watch for TurboTax customer-acquisition targets, pricing detail, Mailchimp stabilization and fiscal 2027 margin assumptions.
Sources: Intuit fiscal 2026 results and fiscal 2027 guidance; Reuters/LSEG; MarketWatch; StockAnalysis; Benzinga. Calculations are estimates and may differ from reported market capitalization because of share-count timing. This dashboard is informational, not investment advice.
Marvell Technology, Inc. rose 4.84% to $240.38 on Tuesday. Price targets were increased by Susquehanna and Rosenblatt ahead of the company’s earnings scheduled for…
·3 min read
Marvell: the $120 billion revenue test
A 4.84% rally prices faster AI growth before Thursday's earnings.
Priority 1 U.S. trend
Aug. 25 close
$240.38
+$11.09 · +4.84%
NASDAQ close, Aug. 25, 2026, 16:00 EDT
Premarket
$240.85
+0.20%
Delayed quote, Aug. 26, 2026, 05:01 EDT
Market value
$210.52B
Tuesday added about $9.7B
MarketWatch, Aug. 25 close
Volume
21.35M
53% of 65-day average
Aug. 25 regular session
What Google must buy for full performance vesting
240purchase-based tranches
$500Mrevenue per tranche
$120Btotal qualifying revenue
14.6×Marvell FY2026 revenue
The purchases are discretionary. The $120 billion figure is a warrant-vesting ceiling, not booked revenue or guidance.
Fresh analyst targets
Susquehanna+10.2%
Consensus+11.4%
Rosenblatt+24.8%
Targets: $265, $267.82 and $300. The consensus covers 44 analysts and carries a Strong Buy rating.
Earnings move priced by options
A 10% move equals roughly $21 billion of market value, or 7.8 times the Q2 revenue guide.
Operating baseline
Measure
Latest
Q1 FY2027 revenue
$2.418B · +28%
Data Center revenue
$1.83B · +27%
Data Center share
76%
Non-GAAP gross margin
58.9%
Operating cash flow
$638.8M
Q2 revenue guide
$2.70B ±5%
Q2 adjusted EPS guide
$0.93 ±$0.05
Warrant economics
Term
Figure
Maximum warrant shares
58.97M
Exercise price
$206.58
Discount to Aug. 25 close
14.1%
Potential gross proceeds
$12.18B
Current-share equivalent
6.7%
Purchase vesting window
FYQ3 2027–FY2033
Average annual threshold
About $18.5B
Risks and dated checkpoints
Revenue is conditional Slower Google purchases reduce vesting and delay the expected sales ramp.
Dilution matters Full exercise equals about 6.7% of current shares, offset partly by $12.18 billion of proceeds.
Valuation is stretched MRVL is up 182.9% this year and trades near 82 times trailing earnings.
Next checkpoint Results follow Thursday's close; management's call begins Aug. 27 at 16:45 EDT.
SAN JOSE, California, August 26, 2026, 05:32 EDT — Zoom Video Communications dropped 5.8% in premarket trade after it projected quarterly earnings per share…
The market is discounting stronger enterprise and AI adoption because third-quarter adjusted EPS guidance missed consensus and cash generation softened.
NASDAQ: ZMUpdated August 26, 2026, 05:32 EDT
Premarket price
$95.06
August 26, 2026, 05:30 EDT
Move vs close
−5.81%
−$5.86 from $100.92; 05:30 EDT
Implied equity value
$28.54B
Calculated at $95.06; August 26, 05:30 EDT
Value erased
≈$1.76B
Premarket calculation vs August 25 close
Two-session repricing
$106$100$94$104.83$100.92$95.06
Aug. 24 closeAug. 25 closeAug. 26, 05:30 EDT
The two-session decline was 9.32%. August 25 regular-session volume was about 7.06 million shares, roughly 2.1 times the recent average. Premarket volume was 29,530 shares at 05:30 EDT on August 26.
Revenue mix and momentum
Enterprise
$787.5M
Online
$489.7M
Q2 FY2027 metric
Value
YoY
Total revenue
$1.277B
+4.9%
Enterprise revenue
$787.5M
+7.8%
Online revenue
$489.7M
+0.6%
Enterprise mix
61.7%
Calculated
Quarter ended July 31, 2026; results published August 25.
Operating signals
Metric
Latest
Investor read
Non-GAAP operating margin
40.0%
High profitability
Free cash flow
$472.4M
−7.0% YoY
Operating cash flow
$494.8M
−4.1% YoY
Enterprise expansion
99%
One-point improvement; slight contraction remains
>$100K customers
4,625
+8.2% YoY
Virtual Agent customers
+256% YoY
Adoption disclosed; revenue not disclosed
Quarter ended July 31, 2026; results published August 25.
Guidance and valuation frame
Measure
Company range
Midpoint / calculation
Q3 FY2027 revenue
$1.275B–$1.280B
$1.2775B
Q3 adjusted EPS
$1.46–$1.48
$1.47; 2.0% below consensus
FY2027 revenue
$5.085B–$5.095B
$5.090B
FY2027 adjusted EPS
$6.08–$6.12
$6.10
FY2027 free cash flow
$1.780B–$1.820B
$1.800B
Forward FCF yield
—
≈6.3% at $28.54B equity value
Guidance issued August 25, 2026; valuation calculations use $95.06 at August 26, 05:30 EDT.
Analyst expectations
ConsensusModerate Buy
Buy / Hold / Sell16 / 12 / 0
Average target$111.64
Premarket-implied upside17.4%
28 ratings and targets available August 26, 2026; upside calculated from $95.06 at 05:30 EDT.
What changes the view
Upside triggerEnterprise growth holds above 7%
Upside triggerAI adoption converts to disclosed revenue
Downside triggerExpansion stays below 100%
Downside triggerCash flow declines again
Scenario markers, not company forecasts.
Risk lens
Extended-hours liquidity can exaggerate price moves. Microsoft Teams and Google Meet remain bundled competitors. Zoom's AI customer growth is encouraging, but product revenue was not disclosed. Strategic-investment gains also make GAAP earnings less comparable with operating performance.
Advanced Micro Devices stock rose 4.91% on Tuesday as Raymond James raised its rating on the chipmaker to Strong Buy. Advanced Micro Devices, Inc.…
·3 min read
AMD: a $36.6 billion upgrade day
Server-CPU optimism met a valuation already priced for rapid data-center growth.
Strong Buy upgrade
Aug. 25 close
$479.18
+$22.44 · +4.91%
NASDAQ close, Aug. 25, 2026, 16:00 EDT
Premarket
$480.48
+0.27%
Delayed quote, Aug. 26, 2026, 04:35 EDT
Market value
$782.25B
Estimated daily gain: $36.6B
Based on Aug. 25 close and reported shares
Trading activity
19.0M
67% of 65-day average
Aug. 25 session
Analyst targets
Raymond James+33.8%
Consensus+15.6%
Raymond James: Strong Buy, $641 target, raised from $565. Consensus: Moderate Buy, $553.72 average across 46 analysts.
Aug. 25 chip-stock moves
What the valuation move means
$36.6Bequity value added Tuesday
5.5×latest quarterly Data Center revenue
$264Bvalue implied from close to $641
39×Q2 Data Center revenue at target
Calculations use a $782.25 billion market value at $479.18. Rounded figures may not sum precisely.
Financial engine
Q2 2026 measure
Result
Total revenue
$11.54B · +50%
Data Center revenue
$6.72B · +107%
Data Center operating income
$2.10B
Calculated segment margin
31.3%
Non-GAAP gross margin
56%
Q3 revenue guide
$13.0B ± $0.3B
Why investors care
Raymond James estimates server-processor revenue can grow 44% annually to $201 billion in 2030. It attributes $168 billion of that market to AI demand.
The thesis is narrower than AMD's reported Data Center segment. That segment combines server CPUs and AI accelerators, so disclosed revenue does not isolate the upgraded product line.
Market context
AMD has gained 123.8% in 2026. It remains about 18% below its 52-week high of $584.73 and trades near 123 times trailing earnings.
Risks and checkpoints
Forecast risk A $201 billion 2030 server-CPU market is an analyst estimate, not company guidance.
Competition Intel, Arm designs and custom cloud chips may limit share and pricing.
Execution The next test is AMD's $13.0 billion third-quarter revenue outlook and data-center margin delivery.
External constraints Foundry capacity, export controls and supply concentration can affect revenue timing.
SANTA CLARA, California, August 26, 2026, 04:53 EDT – Shares of AMD climbed 4.9% after the company's server-CPU market forecast increased by $37 billion,…
Raymond James' $201 billion market forecast pushed AMD 4.9% higher. The operating test is whether EPYC share gains sustain Data Center growth and a 56% gross margin.
Market data through August 25, 2026 Close 16:00 EDT · after hours 18:08 EDT Prepared August 26, 2026, 04:57 EDT
Regular close
$479.18
+$22.38 · +4.90%
Market value
$795.0B
≈+$37.1B in one session
Volume
19.0M
August 25 regular session
After hours
$481.66
+0.52% at 18:08 EDT
What moved the stock
$400$460$520$580$640
$456.81Prior close
$479.18Aug. 25 close
$553.72Consensus target
$641Raymond James
Price moveConsensus targetFresh bull target
Q2 revenue mix
Data Center
$6.7B
Client
$3.1B
Embedded
$977M
Gaming
$779M
Data Center generated 58% of AMD's $11.5 billion quarterly revenue. It more than doubled year over year, while Gaming fell 31%.
CPU share: volume versus value
0%10%20%30%40%
33.2%Unit share
46.2%Revenue share
Mercury Research, Q1 2026 x86 server market. Higher revenue share indicates a premium product mix.
Financial signals and expectations
Metric
Latest
Change / benchmark
Reading
Q2 revenue
$11.5B
+50% YoY
Record
Data Center revenue
$6.7B
More than doubled
Core bull case
Q3 revenue guide
$13.0B ± $0.3B
Consensus was $12.52B
Above Street
Q3 adjusted gross margin
56%
Flat with Q2
Scale must offset mix
Trailing P/E
≈123×
Premium valuation
Execution-sensitive
Consensus target
$553.72
+15.6%
Below Raymond James
Why it rose
The upgrade changed the revenue lens. Raymond James expects CPUs, not only AI accelerators, to capture a large share of agentic-AI infrastructure spending. AMD's 46.2% server revenue share gives the forecast an operating bridge.
What confirms it
Sustained EPYC share gains, Data Center growth above company growth, the $13 billion Q3 guide, and a gross margin holding near 56% would support the repricing.
Risks
$201 billion is an analyst estimate, not backlog. Intel, Nvidia and Arm compete for server workloads. Foundry dependence, customer concentration and weak Gaming revenue can pressure margins.
Super Micro Computer, Inc. gained 9.35% after Cisco launched an enterprise channel for its AI servers. Shares ended Tuesday at $38.46. Trading volume was…
·3 min read
Super Micro Computer · NASDAQ: SMCI
Cisco channel turns rack-scale AI demand into a margin test
Cisco begins offering Supermicro compute inside Secure AI Factory with NVIDIA in October 2026.
Market data: Aug. 25, 2026, 16:00 EDT After-hours: 19:59 EDT
Close
$38.46
+$3.29 · +9.35%
Quoted value added
$2.13B
646.87M shares × $3.29
Trading activity
47.6M
Aug. 25 volume; 48.2M from consolidated snapshot
After-hours
$38.58
+0.30%
Seven-session price path
CloseObserved session
Quarterly operating pulse
FY26
Revenue
Gross margin
Net income
Q1
$5.0B
9.3%
$168M
Q2
$12.7B
6.3%
$401M
Q3
$10.2B
9.9%
$483M
Q4
$11.1B
17.5%
$1.18B
Company-reported GAAP data; fiscal year ended June 30, 2026.
Guidance and balance-sheet signals
FY27 revenue guide$65B–$72B
Midpoint growth vs. FY26+75%
Q1 FY27 revenue guide$14.5B–$15.5B
FY26 cash$7.5B
Bank debt + convertibles$8.7B
Q4 operating cash flow$747M
AI infrastructure read-through · Aug. 25 close, 16:00 EDT
Rack-scale liquid- and air-cooled compute enters Secure AI Factory.
OCTOBER
Commercial availability
First announced month for Cisco to offer Supermicro systems.
Investor takeaway
The Cisco channel validates Supermicro’s rack-scale position, but Tuesday’s $2.13B value gain arrived before any disclosed orders. The clean confirmation would be sustained enterprise revenue plus gross margin near Q4’s 17.5%, rather than a return toward the 6%–10% range seen earlier in fiscal 2026.
Alibaba Group Holding Limited rose 0.82% on Tuesday. The rebound followed a discounted HK$80 billion share placement for AI investment. The stock closed at…
·2 min read
Alibaba AI Placement Dashboard
NYSE:BABA · Market data through August 25, 2026, 20:00 EDT
Close
$119.44
Daily move
+0.82%
After-hours
$119.25
Volume
15.8M
Market value
$272.4B
New dilution
3.57%
What HK$80 billion must earn
Investor bridge
The issue raises about $10.21 billion for chips, infrastructure and models. That equals 6.6% of trailing revenue and 18.1% of Alibaba's three-year AI plan.
Placement as a share of the $56.54B three-year AI commitment
Placement terms
Measure
Value
New shares
710M
Offer price
HK$112.70
Discount
8.4%
Net cash
HK$79.7B
Expected close
Aug. 26
Cloud return channel
June quarter
Value
Group revenue
$39.6B
Revenue growth
+9%
AI cloud revenue
$7.1B
Cloud growth
+45%
Cloud adj. EBITA
$830M
EBITA growth
+133%
Market expectations
Analysts
Value
Consensus
Strong Buy
Coverage
40
Average target
$186.68
Implied upside
+56.3%
Low / high
$92.74 / $237.81
Price path
Date
Close
Move
Volume
Aug. 20
$130.53
+1.26%
28.1M
Aug. 21
$119.34
−8.57%
32.4M
Aug. 24
$118.47
−0.73%
23.9M
Aug. 25
$119.44
+0.82%
15.8M
The ADR remains 8.5% below its Aug. 20 close.
What can break the thesis
AI infrastructure reaches full utilization too slowly.
Model and cloud pricing fall faster than unit costs.
Depreciation absorbs cloud margin gains.
Export controls restrict access to advanced chips.