MARLBOROUGH, Massachusetts, August 27, 2026, 04:10 – Shares in Boston Scientific slid 3.4%, wiping out $2.5 billion in market value, after the company was affected by a worldwide cyberattack.
MARLBOROUGH, Massachusetts, August 27, 2026, 04:10 – Shares in Boston Scientific slid 3.4%, wiping out $2.5 billion in market value, after the company was…
·3 min read
Boston Scientific · NYSE:BSX
Cyberattack investor dashboard
Order processing and customer shipments disrupted worldwide
Market data: August 26, 2026 close, EDT Premarket: August 27, 2026, 04:01 EDT
Official close
$48.17
−$1.69 · −3.39%
Premarket
$48.40
+$0.23 · +0.48%
04:01 EDT, Aug. 27
Volume
36.56M
1.73× three-month average
Value erased
≈$2.49B
$1.69 × 1.4748B diluted shares
The market repriced restoration risk
The close recovered 2.71% from the intraday low but remained 3.39% below the prior close.
Evercore’s estimate is a 600–700 basis-point hit to third-quarter revenue growth. Boston Scientific has not quantified an impact.
Why the $2.49B selloff is notable
6.8×–7.9×
The estimated equity-value loss divided by the $316M–$369M sales scenario.
Scenario midpoint: $342MValue loss: $2.49B
The gap prices more than deferred sales. It also reflects uncertainty around margins, remediation, customers, regulation and data exposure.
Operating baseline before the attack
Metric
Latest figure
Growth / margin
Investor signal
Q2 2026 net sales
$5.442B
+7.5% reported
Growth exceeded Q3’s 3%–5% guide
Cardiovascular sales
$3.624B
+8.3%
66.6% of Q2 revenue
MedSurg sales
$1.818B
+5.9%
33.4% of Q2 revenue
Gross profit
$3.848B
70.7% margin
Expedited freight or remediation could pressure margin
Adjusted EPS
$0.86
FY guide $3.28–$3.32
Guidance risk depends on restoration time
Valuation and expectations
Market capitalization
$69.81B
Trailing P/E
20.2×
Forward P/E
15.2×
Enterprise value / revenue
4.02×
Average analyst target
$62.69
Implied upside to close
30.1%
Valuation metrics were reported as of August 25; market capitalization uses the August 26 close. Consensus target: 31 analysts.
Peer-session context
Boston Scientific−3.39%
Stryker−0.28%
Medtronic+0.97%
Abbott−1.75%
August 26 official closes. The wider BSX decline points to company-specific incident risk.
Risks still unpriced precisely
RestorationDeferred salesData exposureRegulation
The company has not identified the attacker, disclosed whether protected information was accessed, or estimated the financial impact. Longer disruption could add freight, remediation and support costs.
Comparable event
≈1 month
Stryker’s March 2026 attack disrupted order processing, manufacturing and shipping. Most manufacturing returned in about two weeks; full restoration followed roughly one month after detection. Stryker later expected no material 2026 guidance impact.
MILPITAS, California, August 27, 2026, 00:05 — SolarEdge Technologies stock jumped 10.7%, boosting its market capitalization by $197 million, following the company's wager on…
·3 min read
SolarEdge Technologies · NASDAQ:SEDG
FCC inverter restrictions meet a still-uneven recovery
Market snapshot: August 26, 2026, 20:15 EDT (August 27, 00:15 UTC). Fundamentals: quarter ended June 30, 2026.
August 26 close
$33.08 +10.71%
SolarEdge added about $197 million in quoted value. Volume reached 6.53 million shares, or 2.1× the three-month average.
Why investors moved
UBS upgraded SEDG to Buy and lifted its target to $42. The broker says FCC restrictions touch more than half the U.S. inverter market, creating a share, pricing and margin opening for U.S.-made products.
$2.02BMarket cap · Aug. 26, 20:15 EDT
$42UBS target · Aug. 26
27.0%Upside to UBS target
Hold25-analyst consensus · Aug. 26
Quarterly recovery
RevenueGross margin: 11.1% → 27.5%
Q3 midpoint is 6.1% below Q2. Guided gross margin is 22%–26%.
UBS forecast reset
Measure
Old
New
Change
Price target
$36
$42
+16.7%
2027 adj. EBITDA
$101M
$110M
+8.9%
2028 adj. EBITDA
$173M
$190M
+9.8%
The $197 million one-day value gain equals 1.79× UBS's 2027 estimate and 1.04× its 2028 estimate.
Operating signals
Q2 revenue
$346.2M
+19.6% YoY
Q2 gross margin
27.5%
+16.4 pts YoY
Battery shipments
426 MWh
+104% YoY
Inverter shipments
62,600
-27.4% YoY
Free cash flow
$3.1M
Q2 2026
Cash / inventory
$527M / $600M
June 30
U.S. solar peer tape
Company
Price
Day
Market cap
SolarEdge
$33.08
+10.74%
$2.02B
Shoals
$7.31
+6.10%
$1.24B
Enphase
$38.42
+2.78%
$5.19B
First Solar
$205.93
-0.48%
$22.19B
Latest available quotes: August 26, 2026, 20:15 EDT.
Analyst range
$39.15 average target implies 18.4% upside. The range spans $24 to $100. UBS's $42 target sits 7.3% above the mean.
Consensus snapshot: August 26, 2026.
What breaks the thesis
FCC implementation may be delayed, narrowed or exempt products. Financing costs can restrain residential installations. SolarEdge also must reduce inventory while defending price and converting U.S. capacity into profitable volume.
Apple Inc. stock climbed 1.15% on Wednesday, with the company announcing September 9 as the date for its upcoming Apple Event. The increase of…
·3 min read
AAPL · Event catalyst
Apple’s September 9 event puts a $54 billion quarterly franchise on stage
Market data: Aug. 26, 2026, 4:00 p.m. EDT After hours: 7:59 p.m. EDT
Regular close
$313.45
+$3.55 · +1.15%
Quoted value added
$51.8B
14.59B shares × $3.55
After hours
$311.78
-$1.67 · -0.53%
Forward P/E
33.8×
High launch-execution hurdle
Latest quarterly revenue mix
iPhone
$54.25B
Services
$30.74B
Mac
$10.35B
Wearables
$7.88B
iPad
$6.19B
Fiscal Q3 ended June 27, 2026Total revenue $109.42B
Catalyst clock
John Ternus becomes CEO; Tim Cook moves to executive chairman.
“Surprise and shine” Apple Event, 10:00 a.m. PDT / 1:00 p.m. EDT.
Watch pricing, order timing and confirmation—or absence—of a foldable iPhone.
Event time confirmed by Apple. Product expectations are reported, not company-confirmed.
What the market is pricing
Market capitalization$4.57T
Analyst consensusBuy
Average target$326.34
Upside to average target4.1%
Target range$215–$400
Wednesday’s $51.8 billion gain equals 95.5% of one quarter’s iPhone revenue. The launch must improve mix or extend the upgrade cycle to justify that scale.
Margin and activity checks
Company gross margin50.1%
Products gross margin40.1%
Services gross margin75.6%
Regular volume34.02M
Volume vs. 65-day average61%
52-week price change+38.0%
Quarterly margins calculated from Apple’s filing. Stock statistics checked Aug. 26, 2026.
Investor scorecard
Question
Evidence now
What changes the thesis
Can the event expand premium mix?
iPhone revenue rose 21.7% year on year.
Higher opening price with credible shipment scale.
Can hardware protect margins?
Products carried a 40.1% gross margin; tariff refunds lifted total margin.
Supply, yield and component-cost disclosures.
Is a foldable material?
IDC estimate cited by Reuters: over 17M units by 2027.
Apple confirmation, price and availability.
Does valuation allow disappointment?
33.8× forward earnings; average target offers 4.1% upside.
Stronger upgrade evidence or higher estimates.
Risk map
Execution: A rumored foldable could be delayed, expensive or supply-constrained. Demand: Premium pricing may meet weaker global smartphone demand. Margin: High component costs could absorb the benefit of a richer mix. Expectation: The shares already gained $51.8 billion before Apple disclosed any product details.
Sources: Apple event page and fiscal Q3 filing; Reuters reporting dated Aug. 26, 2026; S&P Global estimates via StockAnalysis. Dollar figures are U.S. dollars. Calculations may differ from rounded reported values.
Shares of NuScale Power Corporation dropped 5.50% on Wednesday. The decline pulled back nearly all of the previous session’s AI-driven increase. The move also…
·3 min read
NuScale Power Corporation · NYSE:SMR
Nuclear AI meets the commercialization gap
Market data: August 26, 2026, 16:00 EDT After hours: 19:59 EDT
Regular close
$9.27
−5.50% · range $9.06–$10.26
After hours
$9.36
+1.02% at 19:59 EDT
Trading activity
51.88M
1.35× recent average volume
Quoted value
$3.98B
429.72M shares outstanding
Two-session market-value bridge
Calculation: daily price change × 429.72 million shares. Tuesday added $0.76 per share; Wednesday removed $0.54.
AI claim versus reported economics
Technical retrieval timeUp to −80%
Quantified cost savingsNot disclosed
Q2 revenue$75K
Q2 R&D expense$18.43M
Q2 operating loss$64.00M
Financial signals
Revenue, year over year−99.1%
R&D, year over year+56.2%
Operating loss, year over year+48.6%
June liquidity$1.9B
First-half operating cash use$372.9M
First-half stock issuance$984.5M
Advanced-nuclear tape
Company
Close
Aug. 26
Revenue signal
Risk profile
NuScale Power
$9.27
−5.50%
$75K Q2
Pre-commercial
Oklo
$41.60
−6.03%
$1.21M TTM
Early revenue
NANO Nuclear
$18.50
−3.85%
$214K TTM
Development
BWX Technologies
$153.16
+2.29%
$3.51B TTM
Profitable supplier
Prices as of 16:00 EDT. BWXT rose after a fresh U.S. Army reactor selection; the early-stage developers fell.
Wall Street and valuation
Hold
6 Buy · 9 Hold · 2 Sell
$12.59
Average target · +35.8% vs close
$6–$20
Low-to-high target range
FactSet consensus as displayed August 26, 2026. Targets are estimates, not guarantees.
Catalyst timeline
Aug. 25Nuclear-specific AI deployment announced; proof of concept reports up to 80% faster retrieval.
Aug. 26SMR closes down 5.50% on 51.88 million shares.
Commercial gateBinding TVA power-purchase agreement remains under discussion with ENTRA1.
Next estimateThird-quarter results expected around Nov. 5; company has not confirmed the date.
Investor read-through
The 80% retrieval-time claim targets engineering productivity and schedule risk. It does not yet quantify lower R&D spending, faster licensing or contract revenue. The balance sheet extends the runway, but binding customer commitments remain the decisive valuation bridge.
Risks: Proof-of-concept results may not scale. Nuclear licensing, customer financing, manufacturing capacity, partner execution and dilution can overwhelm workflow savings.
Shares in SpaceX advanced on Wednesday following the announcement of a $100 billion Louisiana spaceport. Space Exploration Technologies Corp. finished the session at $139.63,…
·3 min read
NASDAQ: SPCX · product/commercial catalyst
$100B Starbase meets a $100B cash pool
The Louisiana plan can expand Starship capacity across launch, Starlink and orbital AI. The valuation question is how SpaceX phases a project equal to all second-quarter liquidity.
Regular close: Aug. 26, 2026, 16:00 EDT After-hours quote: Aug. 26, 16:36 EDT Dashboard: Aug. 26, 19:58 EDT
Regular close · Aug. 26
$139.63
+$1.68 · +1.22%
After hours · 16:36 EDT
$139.05
−0.42% from close
Regular volume · Aug. 26
56.1M
Yahoo Most Active
Closing market value
≈$1.84T
Project equals 5.4%
Capital scale
Project spending is a total plan, not a disclosed one-year budget. Liquidity and backlog are as of June 30, 2026.
Louisiana buildout
Investment$100B
Site125,000 acres
Launch complexes5
Planned pads10
Construction target2027
First-launch target2029
Q2 2026 financial base
Total revenue$7.81B
Year-over-year growth+92%
Adjusted EBITDA$3.54B
Net result−$541M
Total capex$18.37B
Cash + securities$100B
Space segment
Q2 revenue$962M
Revenue growth+29%
Operating result−$542M
Adjusted EBITDA−$205M
Q2 capex$1.17B
H1 launches78
Commercial channels
Connectivity revenue$4.29B
Starlink subscribers12.0M
AI revenue$2.56B
Government awards>$6B
Total backlog$47.5B
Next resultsNov. 5, 2026
Analyst expectations · Aug. 26 close
ConsensusModerate Buy
Tracked ratings41
Buy / Hold / Sell27 / 8 / 6
Average target$220.20
Close is 63.4% of the average target; implied upside is 57.7%.
Target range$75–$800
Stock map · Aug. 26 close
Reference
Price
Distance
52-week high · June 16
$225.64
−38.1%
Average analyst target
$220.20
+57.7%
Aug. 26 close
$139.63
Base
IPO price · June
$135.00
+3.4%
52-week low · Aug. 3
$104.83
+33.2%
Investor bridge
Louisiana expands Starship launch capacity for three revenue engines: external launch services, Starlink deployment and orbital AI infrastructure. The $100 billion headline equals all June liquidity and 3.5 times first-half capex.
Starship cadenceStarlink capacityAI satellites
Execution risks
No annual spending schedule, financing plan or return target was disclosed. Starship reusability, permits, wetland mitigation and launch demand must advance before the campus can earn a return.
engineeringregulationcash burnenvironment
Project checkpoints
Checkpoint
Timing
What investors need
Phased budget
Not disclosed
Annual cash use, debt and partner funding
Permits and wetlands plan
Pre-construction
Schedule certainty and mitigation cost
Construction start
Expected 2027
Evidence the plan is funded and active
Starship scale-up
Ongoing
Reliability, reusability and lower launch cost
First Louisiana launch
Targeted 2029
Capacity begins supporting revenue channels
Sources: Louisiana Economic Development’s Aug. 25 announcement; SpaceX Q2 2026 results; Reuters; WSJ delayed quote; Yahoo Finance Most Active; MarketBeat analyst record. Calculations use the Aug. 26 regular close and approximately $1.84 trillion quoted market value.
New York, August 26, 2026, 19:49 – Oracle shares climbed 2.8%, increasing the company’s market capitalisation by $12 billion after Citi pointed to catalysts…
Forced selling may be fading.Credit spreads need to stabilize.At-the-market issuance remains a dilution test.Cloud delivery must turn backlog into billed revenue.
Fiscal 2026 growth engine
Metric
Value
Growth
Total revenue
$67.4bn
+17%
Total cloud
$34.0bn
+39%
Cloud infrastructure
$18.1bn
+77%
Cloud applications
$15.9bn
+11%
RPO
$638bn
+363%
RPO equals about 9.5 times annual revenue, but converts over several years.
Cash-flow bridge
Operating cash flow
$32.0bn
Capital expenditure
−$55.7bn
Free cash flow
−$23.7bn
FY26 debt raised
$43bn
FY26 equity raised
$5bn
Planned FY27 financing
≈$40bn
Planned FY27 financing includes a previously announced $20bn at-the-market equity program.
Large-cap software and cloud tape
Company
Close
Daily move
Market value
P/E
Oracle
$148.87
+2.84%
$433.5bn
26.7×
Microsoft
$496.37
+0.91%
$3.70tn
29.5×
Alphabet
$342.00
−1.40%
$4.18tn
17.2×
SAP ADR
$211.68
−2.45%
$247.1bn
—
August 26 U.S. close; latest trade timestamps ranged from 19:15 to 19:38 EDT.
Analyst range
$263.97
Average target across 39 analysts tracked by MarketBeat.
Low
$145
Average
$263.97
High
$400
Average implied upside
77.3%
What moved attention
August 26
Citi opened a positive 90-day catalyst watch. Oracle also held a financial analyst meeting at 10:45 CT.
Next 90 days
Investors will test cloud-capacity delivery, financing costs and signs that the historic selloff is losing force.
Investor scorecard
Backlog conversion: growth in cloud revenue versus the $638bn RPO balance.Capacity: new data-center and GPU deployment milestones.Cash: capital spending against operating cash generation.Funding: debt spreads, equity issuance and credit-rating pressure.
Risk register
Risk
Investor transmission
Watch point
Build delays
Defers contracted revenue
Capacity delivery
Negative cash flow
Raises external-funding needs
Capex and OCF
Equity issuance
Dilutes existing holders
$20bn ATM program
Credit pressure
Increases financing costs
Spreads and ratings
Customer concentration
Raises contract and renewal sensitivity
RPO mix
Sources: Oracle investor relations, Citi commentary reported August 26, Yahoo Finance, MarketBeat and consolidated U.S. market data. Market-value changes and peak-value gaps are estimates using the current implied share count; rounding may create small differences.
IRVINE, August 26, 2026, 18:49 – Lantronix shares climbed 12.5% in after-hours trade as the company reported its unmanned systems segment is on track…
·3 min read
NASDAQ: LTRX · Post-earnings monitor
Lantronix investor dashboard
Market data: August 26, 2026, 18:49 EDT (00:49 CEST). Financials: quarter and year ended June 30, 2026.
After-hours price
$6.37
+$0.71 · +12.5% from close
Net daily move
+8.7%
Versus August 25 close of $5.86
Value added
≈$23.8M
$0.51 × 46.59M shares
Regular volume
2.14M
August 26 regular session
What changed after the close
The 12.5% after-hours jump more than offset the regular-session decline. The combined gain was $0.51, or 8.7%, from Tuesday's close.
Quarter and near-term guide
Q4 revenue$31.2M · +8% YoY
Q4 adjusted gross margin44.1% · +350 bps
Q4 GAAP / adjusted EPS−$0.01 / $0.04
Q1 FY27 revenue guide$31M–$33M
Q1 FY27 adjusted EPS$0.04–$0.06
Fiscal 2026 revenue mix
IoT Systems
$58.3M
Embedded IoT
$53.6M
Software & Services
$9.0M
+15.6%Embedded YoY
−15.2%Systems YoY
+15.6%Software YoY
Unmanned systems: the rerating case
Signal
FY26 actual
FY27 target / context
Revenue
$12.6M
15%–20% of total revenue
Share of company sales
10.4%
+4.6 to +9.6 points
Active engagements
>30
About 10 at FY26 start
Equity value added
≈$23.8M
1.9× FY26 unmanned revenue
The valuation calculation uses the $0.51 gain from the August 25 close and 46.59 million year-end shares.
Balance sheet and dilution
Metric
June 2026
June 2025
Change
Cash
$60.5M
$20.1M
+$40.4M
Debt
$0
$11.8M
Eliminated
Shares outstanding
46.59M
39.10M
+19.2%
GAAP net loss
$4.2M
$11.4M
63.2% narrower
Acquisition signal
Vecima Industrial IoT / Nero
Expected annual revenue$5.3M
Expected recurring revenue$4.5M
Managed tracking tags≈125,000
Pro forma software mix>10%
Analyst expectations
ConsensusModerate Buy
Analysts7
Average target$10.40
Range$8–$12
Upside from $6.3763.3%
Published consensus before post-results revisions; checked August 26, 2026.
What investors should test next
Growth proofQ1 revenue at or above $32M midpoint
Mix proofUnmanned systems approaching 15%–20%
Quality proofGross margin holds near recent gains
Legacy dragIoT Systems decline stabilizes
Risk monitor
Long drone qualification cycles can delay revenue, while project timing makes quarterly orders uneven. Rising memory costs could compress margins. Acquisition integration and further share issuance would weaken per-share gains. The central invalidation signal is failure to convert more than 30 engagements into volume shipments while legacy systems revenue continues to fall.
Sources: Lantronix fiscal Q4/FY2026 release and earnings call; Yahoo Finance market data; MarketBeat analyst consensus. Non-GAAP measures exclude items defined by Lantronix and are not substitutes for GAAP results.
SANTA CLARA, California, August 26, 2026, 18:04 – Marvell Technology stock gained 3.6% in after-hours trading, with options traders positioning for an anticipated $22…
·3 min read
NASDAQ:MRVL · Company · Stock move
Marvell: a $22 billion earnings hinge
Market snapshot: August 26, 2026, 18:03:50 EDT
After hours +3.62%
After-hours price
$253.97
+$8.86 from the close
Value added after close
≈$8.0B
Implied market cap ≈$228.2B
Options move
±10%
≈$22.0B from closing value
Q2 revenue consensus
$2.71B
About +35% year over year
Price path
Regular close: August 26 at 16:00:01 EDT. After-hours quote: 18:03:50 EDT. Total gain from the prior close: 5.65%.
What options are pricing
From the after-hours price, the options upper bound offered 6.2% upside. The lower bound represented 13.1% downside. The skew shows how Wednesday’s late rally consumed much of the bullish move.
Recent options signal published August 24, 2026; range recalculated from the August 26 closing price.
Fiscal Q2 setup
Metric
Expectation / guide
Change
Revenue consensus
$2.71B
≈+35% YoY
Adjusted EPS consensus
$0.93
+38.8% YoY
Company revenue guide
$2.70B ±5%
+11.7% QoQ midpoint
Adjusted EPS guide
$0.93 ±$0.05
$0.88–$0.98
Non-GAAP gross margin
58.25%–59.25%
58.9% in Q1
Diluted share count
915M expected
Company guide
Prior-quarter base
Q1 revenue growth
+28%
Q2 expected growth
+35%
Q1 non-GAAP GM
58.9%
Fiscal Q1 revenue was a record $2.418 billion. Non-GAAP net income reached $718 million, while operating cash flow hit a record $638.8 million.
The key test is conversion: exceptional AI bookings must become revenue without pushing gross margin below the guided range.
Valuation and analyst bar
Measure
Value
Read-through
Trailing P/E
84.2×
Premium leaves little room for a weak guide
Closing market cap / Q2 revenue
81.3×
One quarter, not an annual multiple
Annualized Q2 price/sales
≈20.3×
Assumes the quarter repeats
Yahoo one-year target
$266.36
+4.9% from after-hours price
Susquehanna target
$265
Positive; +4.3% from after hours
Rosenblatt target
$300
Buy; +18.1% from after hours
Price, P/E and consensus-target snapshot: August 26, 2026, 18:03:50 EDT. Fresh brokerage targets were reported August 25.
Google agreement: revenue versus dilution
Potential sales
Up to $120B
Warrant shares
58.97M
Q2 share dilution
6.4%
Google can buy the warrant shares at $206.58. Most vest only when product-purchase thresholds are met through fiscal 2033. Dilution is therefore tied to sales conversion.
Peer valuation at the August 26 close
Company
Session move
Trailing P/E
Marvell
+1.97%
84.2×
Nvidia
−1.52%
31.9×
Broadcom
−0.33%
97.6×
AMD
+0.36%
123.6×
Marvell sits between Nvidia and higher-multiple custom-compute peers. Its earnings must validate optical-networking growth and the custom-silicon pipeline.
Peer close data retrieved August 26, 2026, 17:52 EDT.
Thursday checklist
Fiscal-year revenue guidance and any raise.
Optical-interconnect sequential growth.
Custom XPU and Google-linked revenue timing.
Gross margin versus the 58.25%–59.25% range.
Operating cash conversion after the Q1 record.
Celestial AI and XConn acquisition contribution.
Risk map
Expectations: An in-line quarter may not support the multiple.
Margin: Memory and optical-component costs can compress profitability.
Execution: Custom silicon ramps require long design and qualification cycles.
Dilution: Google warrants equal 6.4% of guided diluted shares.
Tape: Regular volume was only 39% of the three-month average.
Next confirmed catalyst
Fiscal Q2 2027 results and conference call — August 27, 2026, 16:45 EDT. The market will compare any guidance raise with a $228 billion implied after-hours valuation and the 10% options move.
Nutanix Inc. shares rose 7.2% in after-hours trading on Wednesday. The hybrid-cloud firm surpassed analyst forecasts for both revenue and profit in the quarter.
·2 min read
NASDAQ: NTNX · Earnings reaction
Nutanix investor dashboard
Market data: Aug. 26, 2026, 17:22 EDT Financials: quarter ended July 31, 2026
After-hours price
$70.10
+$4.71 · +7.20%
Equity value added
$1.27B
Estimated from 270.32M shares
Trading activity
4.66M
1.88× 2.48M average volume
52-week position
74%
$34.01 low · $82.42 high
Quarterly surprise
Metric
Actual
Consensus
Beat
Revenue
$757.1M
$738.3M
+$18.8M
Adjusted EPS
$0.60
$0.49
+$0.11
Growth and margin
Q4 FY2025Q4 FY2026
Operating scoreboard
Metric
Q4 FY26
Q4 FY25
Change
Revenue
$757.1M
$653.3M
+16%
ARR
$2.55B
$2.20B
+16%
Adj. gross margin
87.7%
88.3%
−60 bps
Adj. operating margin
26.2%
18.3%
+790 bps
Free cash flow
$277.6M
$207.8M
+34%
Fiscal 2027 guide
Revenue$3.18B–$3.23B
Midpoint growth12.5%
Adj. operating margin24%–25%
Free cash flow$850M–$950M
Q1 revenue$755M–$765M
Q1 adj. operating margin26%–28%
Implied market cap
$18.95B
At $70.10 after hours
FY27 sales multiple
5.9×
Using $3.205B midpoint
FY27 FCF multiple
21.1×
Using $900M midpoint
Analyst setup
Moderate Buy
18 ratings · $64.21 mean target before results
What moved the stock
Revenue exceeded consensus by 2.5%. Adjusted operating margin expanded 790 basis points. ARR kept pace with quarterly revenue at 16% growth. Fiscal-2027 guidance preserved double-digit sales growth while keeping adjusted operating margin near one quarter of revenue.
Risk monitor
Adjusted gross margin fell 60 basis points. Server supply constraints can delay deployments and cash collection. The after-hours price already exceeds the pre-report average analyst target. Extended-hours liquidity can exaggerate moves.
Sources: Nutanix fiscal Q4/FY2026 release; MarketBeat earnings estimates and analyst consensus; StockAnalysis after-hours quote and share data. Valuation figures are calculated estimates. Prices and volume are time-sensitive.
PLEASANTON, California, August 26, 2026, 17:41 EDT — Veeva Systems advanced 8.2%, adding $3.3 billion in market capitalization, after the company raised its sales…
SUNNYVALE, California, August 26, 2026, 17:27 — Synopsys slipped 2.8%, losing $2.2 billion in market value, after the company raised its forecast bolstered by…
·3 min read
NASDAQ: SNPS · Company · Stock move · Earnings
Synopsys: a beat, a raise, and a $2.2B valuation warning
AI demand strengthened the numbers. The after-hours tape said the size of the raise still mattered.
August 26, 2026 17:31 EDT · After hours
After-hours price
$398.65
−2.77% · −$11.35
Regular close: $410.00
Equity value erased
$2.17B
After-hours
191.48M shares × $11.35
Q3 revenue
$2.477B
+42.4% YoY
1.6% above consensus
Adjusted EPS
$3.91
+6.5% vs estimate
$3.67 consensus · $3.39 YoY
The market's message
The quarter beat. The forecast raise was modest.The annual revenue midpoint increased by roughly $45M, or 0.47%. At about 95× trailing earnings, a small upgrade left little room for upside surprise.
Regular closePost-earnings move
Trading snapshot
Regular range$403.54–$419.60
Volume2.51M
Average volume1.81M
Volume vs average+38.7%
Market cap at close$78.51B
Trailing P/E95.0×
Where growth came from
Design Automation revenue$2.003B · +52.7%
80.9% of Q3 revenue · includes Ansys
Design IP revenue$473.8M · +10.8%
19.1% of Q3 revenue · returned to YoY growth
Margin signal
Non-GAAP operating margin41.6%
Design Automation margin45.2% · +70 bp
Design IP margin26.5% · +640 bp
GAAP operating margin14.4%
Large acquired-intangible amortization keeps the GAAP and adjusted views far apart.
Pre-earnings snapshot. New notes can change the distribution.
Peer valuation
Synopsys P/E95.0×
Cadence P/E66.6×
SNPS premium42.7%
SNPS AH move−2.77%
CDNS AH move+0.55%
What investors should watch next
1 · Design IP
Sequential growth in Q4
Confirms that the recovery extends beyond one quarter.
2 · Ansys integration
$2.98B expected FY revenue
Synergies must offset amortization, restructuring and leverage.
3 · Multiple support
95× trailing earnings
High expectations make the stock sensitive to modest raises.
Sources: Synopsys fiscal Q3 2026 results; Reuters; Google Finance. Market figures timestamped August 26, 2026, 17:31 EDT. Price data may be delayed. Calculations use disclosed figures and may differ slightly because of rounding.
PALO ALTO, California, August 26, 2026, 17:03 — HP Inc's stock dropped 9.0%, erasing $2.5 billion in market value, after the company reported a…
·3 min read
HP Inc. · NYSE:HPQ
Price/mix beat, unit-demand warning
Market snapshot: August 26, 2026, 17:02 EDT
After hours · −9.03%
After-hours price
$27.77
−$2.75 from the $30.52 close
Value erased
≈$2.5B
Implied from the closing market cap
Revenue surprise
+8.6%
$15.68B vs $14.44B consensus
Adjusted EPS surprise
+25.8%
$0.83 vs $0.66 consensus
Why the stock reversed
PC units
−16%
PC revenue
+18%
Print revenue
−2%
The divergence matters. A simple revenue-to-units calculation implies roughly 40% higher Personal Systems revenue per unit. Pricing and premium mix did the heavy lifting while underlying unit demand contracted.
Printing’s 2% decline is important because the segment has carried far higher margins. In fiscal Q2, Personal Systems margin was 5.2%; Printing margin was 18.3%.
Tariff refunds added $0.11 to Q3 EPS and are expected to add $0.19 for the year. The annual benefit equals 5.9% of the new guidance midpoint.
Valuation and peer context
Company
Aug. 26 close
Session move
Market cap
P/E
HP (HPQ)
$30.52
+3.39%
$28.23B
11.3×
Dell (DELL)
$463.82
+2.77%
$304.27B
37.0×
Apple (AAPL)
$313.45
+1.16%
$4.61T
36.0×
Logitech (LOGI)
$100.19
+1.56%
$14.53B
18.4×
HP’s lower multiple prices in a structurally weaker mix and limited unit growth. At the $27.77 after-hours price, the $23.41 one-year analyst target implied 15.7% downside. The $3.1 billion free-cash-flow midpoint equaled roughly 12% of implied after-hours equity value.
Peer prices and valuation snapshot: August 26, 2026, approximately 16:45–16:50 EDT. HP after-hours valuation is an estimate using the closing share count.
Signals to watch
PC unit guidance and price elasticity after the 16% shipment decline.
Memory-cost timing versus price increases.
Premium and AI-PC mix after the revenue-per-unit jump.
Printing revenue and supplies trajectory.
Cash conversion behind the $3.0–$3.2 billion FCF guide.
Risk map
Demand: Higher prices may suppress replacement units.
Margins: Memory inflation may arrive before pricing catches up.
Mix: PC growth has lower margins than Printing.
Quality: Tariff refunds are nonrecurring.
Sentiment: The analyst target remains below the traded price.
Immediate catalyst
HP fiscal Q3 earnings call — August 26, 2026, 17:30 EDT. The market needs a bridge from strong revenue to sustainable unit growth and margins. Guidance on memory supply, pricing, Printing and refund-adjusted earnings will set the next move.
Salesforce, Inc. stock surged 12.73% in postmarket trading on Wednesday. The gain came after fiscal second-quarter results reinforced the company's AI-driven growth outlook.
·3 min read
NYSE: CRM · Company stock move
AI contract momentum, not the headline EPS, drove the re-rating
Salesforce added an implied $22.8 billion of equity value after hours. The cleaner operating signal was $3.37 adjusted EPS excluding investment gains, while Agentforce and Data 360 ARR approached $3.9 billion.
After-hours price
$231.80
+$26.18 · +12.73%
August 26, 2026 · 16:37:36 EDT Regular close: $205.62
Implied market value
$201.9B
+$22.8B after hours
Calculated from the $179.1B closing value.
AI + data ARR
$3.9B
+210%+ YoY
Agentforce and Data 360 recurring revenue.
Q2 revenue
$11.35B
+11% YoY
$11.33B consensus; 0.2% beat.
Current RPO
$33.5B
≈+14% YoY
Slightly above the $33.4B expectation.
What changed in guidance
PriorNew revenueNew EPS
Market-value bridge
The equity-value gain was about 114 times the $200 million increase in the fiscal-year revenue-guidance midpoint.
Quarter and outlook
Metric
Reported / guided
Benchmark
Signal
Q2 revenue
$11.35B
$11.33B consensus
Small beat
Adjusted EPS
$5.90
$3.27 consensus
Investment gains amplified it
EPS ex investment gains
$3.37
$3.27 consensus
3.1% beat
Q3 revenue
$11.42B–$11.50B
New guidance
Steady double-digit scale
Q3 adjusted EPS
$3.42–$3.44
New guidance
Operating leverage
FY27 revenue
$46.1B–$46.4B
Prior $45.9B–$46.2B
Midpoint +$200M
FY27 adjusted EPS
$16.67–$16.71
Prior $14.06–$14.12
Midpoint +18.5%
Valuation after the jump
Implied market cap / trailing revenue
4.7×
Implied market cap / FY27 revenue midpoint
4.4×
Implied P/E using trailing EPS
26.8×
Levered free-cash-flow yield
8.2%
Average analyst target
$243.98 · 5.3% upside
Citizens target
$315 · 35.9% upside
52-week range
$146.32–$269.11
Estimated YTD after the move
about −12%
Valuation ratios use the $231.80 after-hours price and latest trailing figures available at 16:37 EDT.
Peer tape at the regular close
Company
Ticker
Close
Move
Salesforce
CRM
$205.62
−0.03% regular / +12.73% AH
ServiceNow
NOW
$125.80
−0.94%
Adobe
ADBE
$273.47
−0.16%
Snowflake
SNOW
$315.37
−0.52%
Peer prices are the August 26 regular-session closes; Salesforce’s earnings move occurred afterward.
Investor interpretation
The positive read: AI and data ARR nearing $4 billion gives investors a measurable commercial bridge. The strongest net-new annual order growth in four years suggests the signal reaches beyond pilot activity.
The test: The $22.8 billion revaluation needs organic cRPO growth and repeatable Agentforce bookings. A $200 million revenue-guide lift alone does not explain it.
Risks: Strategic-investment gains may reverse. Informatica and pending acquisitions blur organic growth. Customer deployments can remain slow where data is fragmented.
Next catalyst: the 17:00 EDT earnings call. Watch Agentforce bookings, organic growth, free cash flow, acquisition assumptions and any change to capital returns.
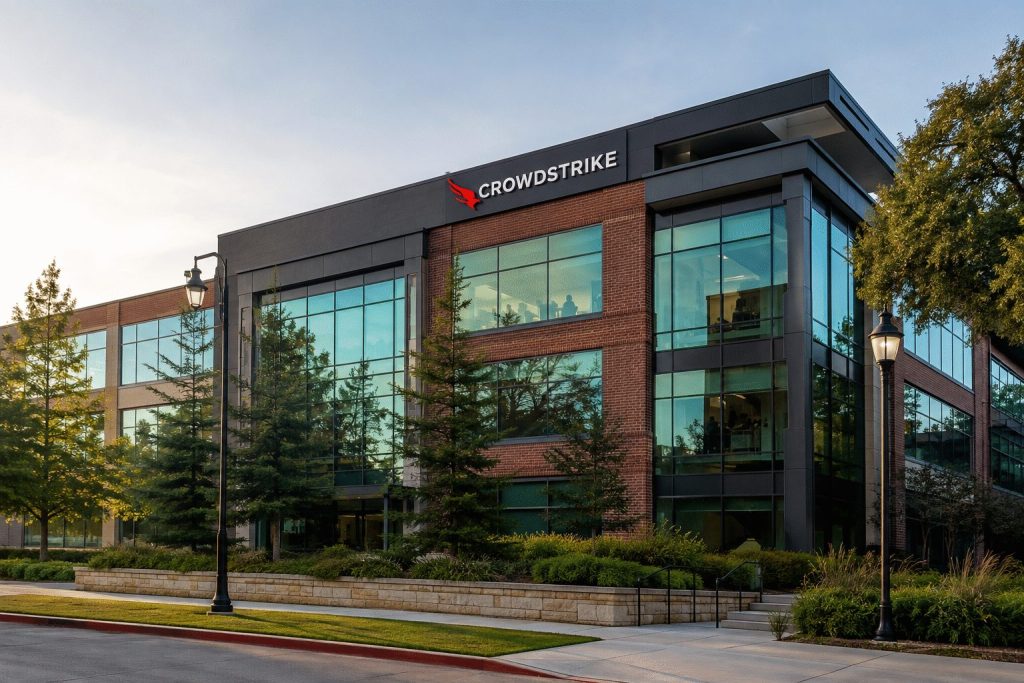
AUSTIN, Texas, August 26, 2026, 16:40 EDT — CrowdStrike stock climbed 10.9%, increasing its market capitalisation by $21 billion after the company reported an…
·3 min read
NASDAQ: CRWD · Company · Stock move
Record ARR growth resets the earnings bar
As of August 26, 2026, 16:40 EDT. After-hours quote; financial data covers fiscal Q2 ended July 31, 2026.
After-hours price
$209.77
Regular close: $189.18
After-hours move
+10.88%
+$20.59 per share
Implied value added
≈$21.0B
Using 1.02B shares outstanding
Net new ARR
$332.8M
Record; +51% year over year
Quarterly acceleration
What moved the stock
Revenue$1.471B · +26%
Subscription revenue$1.400B · +27%
Ending ARR$5.84B · +25%
Falcon Flex ARR>$2.29B · +101%
Free cash flow$377.4M · +33%
Regular volume12.2M · 115% avg.
Guidance: old bar versus new bar
Fiscal 2027
Previous
Current
Revenue midpoint
$5.937B
$6.001B
Ending ARR midpoint
$6.544B
$6.607B
Net new ARR growth
27.7%
34.0%
Adjusted EPS
$1.21–$1.24
$1.25–$1.26
Analyst expectations before the print
ConsensusOverweight · 54 ratings
Buy / Overweight35 / 5
Hold / Underweight / Sell12 / 2 / 0
Average target$214.43 · +2.2%
Median target$228.50 · +8.9%
Target range$103–$256
Valuation and financial signal
FY27 adjusted EPS midpoint$1.255
Price / guided adjusted EPS≈167×
Value gain / quarterly FCF≈56×
Falcon Flex share of ARR≈39%
Price versus median target
The after-hours price already captures most of the pre-results median target.
Risks and next checks
Execution: record pipeline must convert into the raised $6.607B ARR midpoint.
Valuation: a 167× guided adjusted-EPS multiple magnifies small forecast misses.
Accounting gap: $399.0M of stock compensation helped separate a $33.2M GAAP loss from $371.6M non-GAAP operating income.
Product risk: outages, faulty updates or weaker renewals can slow platform expansion.
Next dated catalyst: investor briefing at Fal.Con on September 2, 2026.
Sources: CrowdStrike fiscal Q2 2027 release; MarketWatch delayed after-hours quote and FactSet analyst estimates. After-hours trading can be less liquid and more volatile than the regular session.
SANTA CLARA, California, August 26, 2026, 16:30 EDT — Nvidia stock declined by 1.8% after reporting quarterly revenue of $96.2 billion, as the company’s…
·3 min read
NVIDIA · NASDAQ:NVDA · Q2 FY2027
Revenue beat, balance-sheet test
Market data: Aug. 26, 2026, 16:30 EDT Financials: quarter ended July 26, 2026
After hours
$205.92 · -1.78%
Close $209.66 · about $90B value erased
Q2 revenue
$96.22B
+106% YoY · +4.2% vs FactSet consensus
Q3 outlook
$108.0B
+3.6% vs $104.2B consensus · ±2% range
Commitments + guarantees
$474.5B
8.4× cash and marketable debt securities
Revenue acceleration
Q2 Data Center revenue was $89.0B, or 92.5% of total sales.
Investor bridge
Measure
Value
Signal
Adjusted EPS
$2.22
+6.2% vs est.
Q2 gross margin
75.0%
Flat QoQ
Q3 gross margin
74.0%
-1.0 pt
Free cash flow
$21.34B
-56% QoQ
DSO
60 days
+15 days
Commitment stack
Supply and capacity · $279B
Other contractual commitments · $87B
Contingent guarantees · $108.5B
Supply commitments rose $160B, or 134%, in one quarter. The guarantee total includes $105B for the Ohio site and $3.5B for AI-cloud leases.
Commitments are future obligations, not immediate debt. Guarantees are contingent. The valuation test is whether Nvidia's revenue and free cash flow scale faster than supply, lease and customer-support exposure.