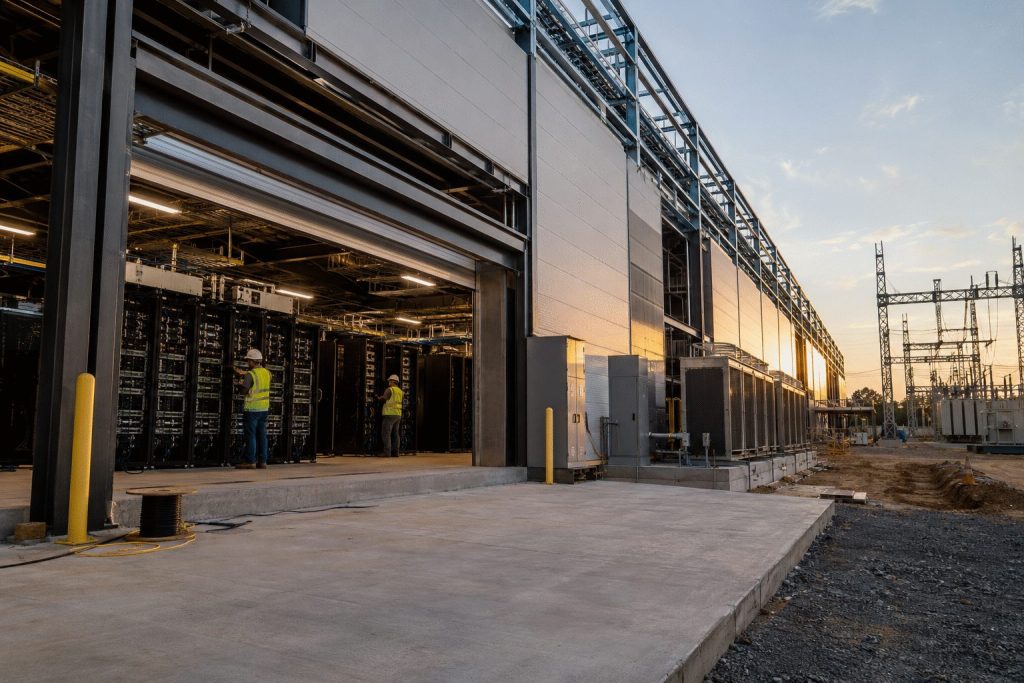
PECAN ISLAND, Louisiana, August 25, 2026, 21:30 EDT — SpaceX's Starbase Louisiana is preparing to meet a $100 billion capital expenditure test, with the company's stock climbing 2.2%.
PECAN ISLAND, Louisiana, August 25, 2026, 21:30 EDT — SpaceX's Starbase Louisiana is preparing to meet a $100 billion capital expenditure test, with the…
·3 min read
NASDAQ: SPCX · Commercial catalyst
Starbase Louisiana: the $100 billion execution test
Stock data: August 25, 2026 close, 16:00 EDT Dashboard updated: August 25, 2026, 21:30 EDT
SPCX close
$137.95
+2.19% Tuesday
Trading volume
53.1M
shares
Project commitment
$100B
multi-year plan
Market value
$1.87T
about 13.57B shares
Launch capacity
10 pads
five complexes
Scale against the current business
The planned commitment equals 5.3% of market value, 4.3 times trailing revenue and 5.4 quarters of the latest capital-spending pace.
Delivery timeline
2026 · Site and incentives125,000 acres; state and local agreements announced
2027 · Construction expectedPermitting and infrastructure become measurable
2029 · Company launch targetFirst Starship flight as early as 2029
2030 · State operations estimateMore conservative initial-operations reference
Project design
Site
125,000 acres
Launch complexes
5
Launch pads
10
Direct jobs
3,000
Average salary
$92,600
Indirect jobs
8,100
Direct local payments
>$820M
Revenue transmission
Starlink capacity
Direct
Commercial launch
Direct
Orbital AI systems
Longer term
More Starship slots can expand satellite deployment and payload revenue. Cash flow depends on launch reliability, customer demand and the final spending schedule.
Flight rate: Starship reliability limits pad utilization.
Cash flow: spending accelerates before revenue.
Demand: launch or Starlink growth slows.
Scope: final project cost differs from $100 billion.
Sources: Louisiana Economic Development, Reuters, SpaceX's August 4 SEC filing, StockAnalysis and S&P Global analyst data. Calculations use the August 25 close and approximately 13.57 billion shares. Figures may not sum because of rounding.
SANTA CLARA, California, August 25, 2026, 20:45 EDT — Nvidia stock advanced 2.2%, while options traders positioned for a $280 billion change in market…
·3 min read
NASDAQ: NVDA · Earnings setup
Nvidia's $280 billion decision point
Market data: August 25, 2026 close, 16:00 EDT Dashboard updated: August 25, 2026, 20:45 EDT
Closing price
$213.05
+2.19% Tuesday
Volume
121.8M
shares traded
Implied move
5.4%
about ±$11.50
Equity swing
$280B
options estimate
Market value
$5.16T
about 24.22B shares
Options-defined price envelope
$201.55 downside$224.55 upside
The 5.4% move equals about $11.50 per share. It is an options estimate, not a forecast or a guaranteed trading range.
At Tuesday's close, the 7.4% historical response equals about ±$15.77 and roughly $382 billion of equity value.
Investor bridge
3.1×
The $280 billion implied equity swing is roughly 3.1 times Nvidia's $91 billion quarterly revenue guide.
A modest change in revenue growth or margin expectations can therefore move more value than several quarters of sales.
Operating benchmarks
Metric
Reference
Q1 revenue
$81.6B
Year-over-year growth
85%
Data Center revenue
$75.2B
Data Center growth
92%
Q2 revenue guide
$91.0B ±2%
Q2 non-GAAP margin
75.0% ±0.5 pt
Analyst expectations
Strong Buy
62 analysts · S&P Global
49 Strong Buy · 10 Buy · 2 Hold · 1 Strong Sell
Average target
$304.73
Target range
$180–$500
Forward P/E
20.77
What can break the range?
Revenue: guidance below the $91 billion reference.
Margins: pressure below the 74.5% low end.
Demand: softer hyperscaler capital spending.
China: any change to the zero-compute-revenue assumption.
Volatility: an actual move closer to the 7.4% history.
Sources: Nvidia investor relations, Reuters options-market reporting, StockAnalysis and S&P Global analyst data. Calculations use the August 25 close of $213.05 and approximately 24.22 billion shares. Figures may not sum because of rounding.
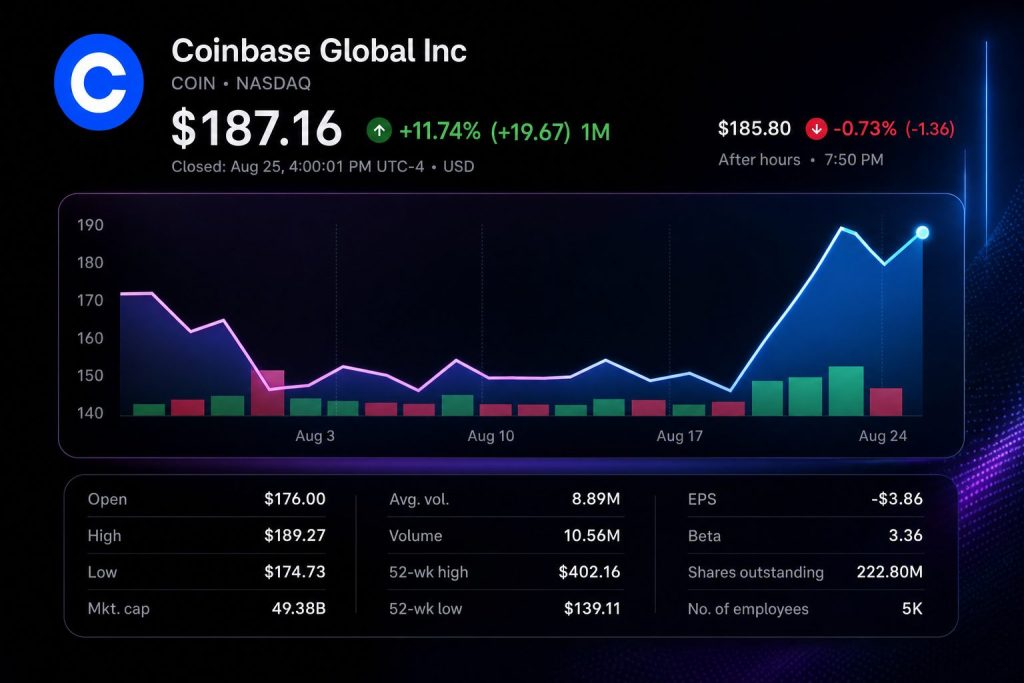
Coinbase Global rose $7.68, or 4.28%, to $187.16 on Tuesday. Volume reached 10.55 million shares. The move added roughly $2.03 billion to quoted equity…
Base tokenized stocks: price signal versus revenue evidence
NASDAQ: COINCompany · Stock moveBase / B20
Market data through August 25, 2026 19:22 EDT / August 26, 01:22 CEST
Regular close
$187.16
+$7.68 · +4.28%
August 25, 16:00 EDT
After hours
$186.68
−$0.48 · −0.26%
August 25, 19:22 EDT
Estimated value added
$2.03B
$7.68 gain × 263.84M shares
Trading activity
10.55M
Shares traded August 25
The valuation reaction was larger than one quarter of revenue
USD billionsValue gainQ2 revenue$2.03B$1.22BThe gain was 1.66× Q2 revenue; it is not a product-revenue estimate.
Operating base
Metric
Reading
Period
Total revenue
$1.22B
Q2 2026
Subscription & services
$555M
Q2 2026
Share of net revenue
48%
Q2 2026
Adjusted EBITDA
$207.8M
Q2 2026
Net loss
−$359.5M
Q2 2026
Trading-volume share
10.3%
Q2 2026
Product-to-financial bridge
Distribution
Strong
Asset breadth
4
Revenue proof
None
U.S. access
No
Interpretation: Base can distribute the assets across wallets and DeFi protocols. The investor case still needs disclosed volume, take rate and contribution margin.
Exchange peer check
Company
August 25 close
Day move
Market cap
Forward P/E
Analyst target upside
Coinbase
$187.16
+4.28%
$49.38B
162.8×
+5.0%
Cboe Global Markets
$308.82
+0.24%
$32.25B
21.3×
+2.1%
Intercontinental Exchange
$161.78
−0.74%
$90.82B
19.7×
+14.6%
Nasdaq
$98.73
−0.06%
$55.19B
22.6×
+11.2%
CME Group
$277.32
−0.66%
$99.72B
22.5×
+2.1%
Peer data are as of the August 25 U.S. close. The comparison shows Coinbase's greater earnings sensitivity to digital-asset activity and product adoption.
Analyst frame
Buy
Consensus across 34 analysts, with an average target of $196.55.
The target implied 5.0% upside from the August 25 close. That is smaller than the stock's single-day 4.28% move.
What changes the thesis
Positive: more listed shares, sustained liquidity and a disclosed take rate.
Positive: token use as collateral increases Base transaction activity.
Negative: low volume leaves the launch economically immaterial.
Negative: regulatory, custody or smart-contract issues slow distribution.
Investor read-through
Tuesday's price action treated tokenized equities as a credible extension of Coinbase's platform. The measurable evidence is the stock move, not product revenue. With only four securities and no disclosed fee schedule, adoption data now matter more than launch-day attention.
Sources: Coinbase/Base launch materials dated August 24, 2026; Coinbase Q2 2026 results; StockAnalysis market, valuation and consensus data through August 25, 2026. Market-value gain is an estimate using the daily price change and reported shares outstanding.
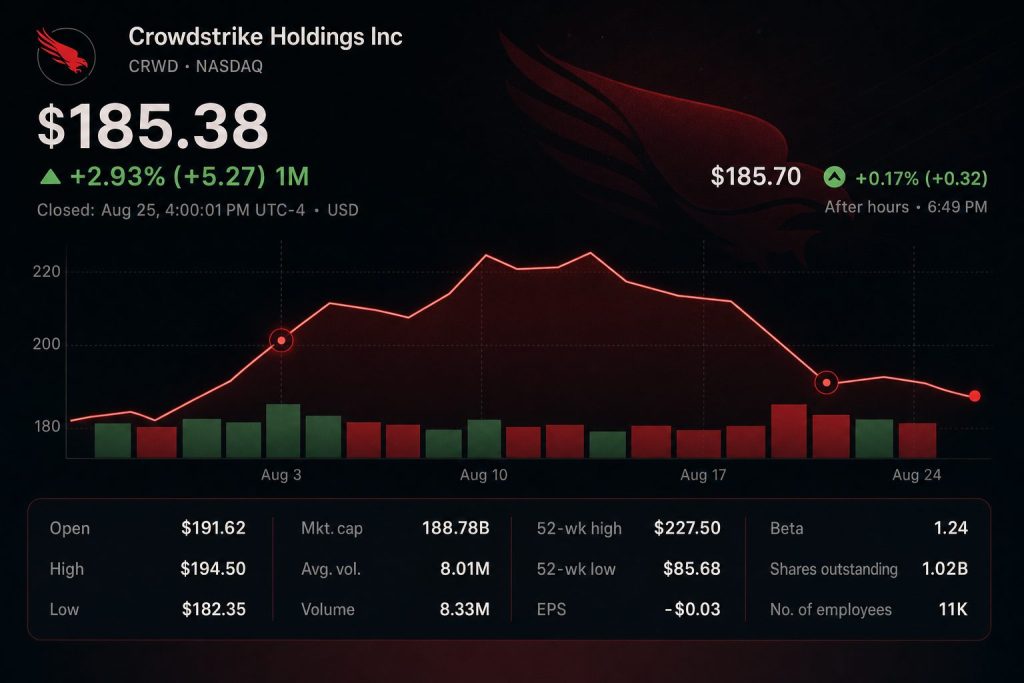
CrowdStrike Holdings, Inc. slipped 2.78% to $185.38 on Tuesday. The cybersecurity firm lagged a 0.66% gain in the Nasdaq Composite ahead of its fiscal…
·3 min read
NASDAQ: CRWD • Earnings setup
CrowdStrike’s $15.1 billion test
The options market expects a move more than ten times expected quarterly revenue.
Market data through August 25, 2026 18:40 EDT / August 26, 00:40 CEST
Regular close
$185.38
−2.78% • −$5.30
Options-implied move
±8.0%
±$14.83 per share
Implied equity swing
$15.1B
Using $188.76B market value
Expected Q2 revenue
$1.44B
About +23% year over year
What the options market prices
The range is based on Tuesday’s close and an 8% options-implied move through week-end. It describes expected volatility, not a forecast of direction.
Q2 hurdles
Metric
Reference
Investor test
Revenue
$1.436B–$1.442B
Hold or beat midpoint
Adjusted EPS
$0.29 estimate
Post-split basis
ARR
$5.793B–$5.795B
Fresh bookings matter
Non-GAAP operating income
$345.6M–$349.1M
About 24.1% margin
ARR bridge
Q1 ARR
$5.51B
Q2 midpoint
$5.794B
Implied add
~$284M
Q1 net add
$255.8M
The Q2 midpoint implies roughly 11% more net new ARR than Q1. Reported balance rounding makes this calculation approximate.
Cybersecurity peer tape
Company
Aug. 25 close
Daily move
Forward P/E
Analyst target upside
CrowdStrikeCRWD
$185.38
−2.78%
146.1×
+13.6%
Palo Alto Networks PANW
$339.90
−3.13%
89.6×
+6.7%
Zscaler ZS
$168.42
−4.34%
39.7×
+18.0%
Fortinet FTNT
$153.66
+1.10%
43.4×
+4.7%
Peer weakness makes earnings-specific attribution difficult. CrowdStrike’s premium multiple raises the bar for guidance and contracted subscription growth.
Decision map
Bull caseARR clears $5.795B, net new ARR beats the roughly $284M implied level, and the operating-margin outlook expands.
Neutral caseRevenue meets the $1.439B midpoint while bookings and guidance remain within management’s existing ranges.
Bear caseARR falls below $5.793B or forward guidance softens, putting the $170.55 options boundary in focus.
Risk lens
The options range can overstate or understate the actual reaction. A headline revenue beat may not support the shares if ARR, net new bookings or guidance disappoint. Conversely, stronger contracted revenue and margins could outweigh a modest earnings miss. The after-hours market is also thinner than the regular session.
Zoom Communications shares fell about 6.9% from their previous close after quarterly results showed faster enterprise growth but little change to the annual sales…
·2 min read
NASDAQ: ZM · fiscal Q2 2027
Zoom's AI growth test
Enterprise momentum accelerated, but the annual revenue midpoint moved by only 0.1%. The market treated the report as an earnings-efficiency update, not a revenue reset.
Latest observation Aug. 25, 2026 · 16:49 EDT 22:49 CEST
After-hours price
$97.63
Google Finance, 16:49 EDT
From prior close
−6.87%
$104.83 to $97.63
Regular close
$100.92
−3.73% at 16:00 EDT
Volume
6.39M
2.12× 3.01M average
Revenue growth by channel
Enterprise supplied 61.7% of quarterly revenue and nearly all incremental sales.
The guidance change
Revenue midpoint+0.10%
Adjusted EPS+2.01%
FCF midpoint+4.65%
Compared with guidance issued May 21. Revenue midpoint moved from $5.085B to $5.090B.
Quarterly scorecard
Metric
Q2 FY2027
Year earlier
Change / signal
Total revenue
$1.277B
$1.217B
+4.9%
Enterprise revenue
$787.5M
$730.7M
+7.8%
Online revenue
$489.7M
$486.6M
+0.6%
GAAP operating income
$314.3M
$321.7M
−2.3%
Free cash flow
$472.4M
$508.0M
−7.0%; 37.0% margin
Non-GAAP operating margin
40.0%
41.3%
−130 bps
AI and customer signals
Zoom Virtual Agent customer count rose 256% year over year.
Customer Experience ARR expanded at a high-double-digit rate.
Customers spending above $100,000 annually rose 8.2% to 4,625.
Enterprise net dollar expansion improved to 99%, still below expansion territory.
Online monthly churn held at 2.9%.
Valuation and capital return
Trailing P/E
14.8×
Forward P/E
17.4×
Analyst consensus
Buy · 30 analysts
Average target
$116.80 · 19.6% above after-hours price
Quarterly repurchases
3.7M shares
Remaining authorization
$1.3B at July 31
Profit-quality check
81%
Strategic-investment gains supplied $1.614B, or 81% of GAAP pretax income. Non-GAAP net income fell 1.5% to $464.0M.
The large investment gain should not be read as recurring operating profit.
Risks and next checks
Growth: Online sales may remain nearly flat while Microsoft bundles competing tools.
Margins: free cash flow and non-GAAP operating margin declined year over year.
Upside condition: enterprise expansion above 100% would show existing customers are spending more overall.
Next catalyst: Q3 revenue midpoint of $1.2775B implies about 5% growth.
Shares of Hyperscale Data, Inc. declined 17.33% to $0.3869 on Tuesday, following a 1-for-5 reverse stock split in its debut session post-split.
·3 min read
NYSE American: GPUS · post-split monitor
Hyperscale Data
The reverse split changed the share count, not the economics. The first adjusted close remained deeply below the exchange's $1 reference level.
Market close Aug. 25, 2026 · 16:00 EDT 22:00 CEST
Adjusted close
$0.3869
Yahoo Finance, Aug. 25 close
Session move
−17.33%
First split-adjusted session
Distance to $1
−61.31%
A 158.5% gain is needed to reach $1
Split ratio
1-for-5
Effective Aug. 24 at 23:59 EDT
What the split changed
Class A before679.91Mshares, approximately
÷ 5 →
Class A after135.98Mshares, approximately
Class B changed from roughly 23.88 million to 4.78 million shares. Options and warrants were adjusted proportionally; par value was unchanged.
Intraday stress
Volume reached 24.31 million shares by 15:23 EDT on Aug. 25. The reference close was $0.468 on a split-adjusted basis.
Equity value versus Bitcoin treasury
Reference value$63.6M
Closing value$52.6M
Bitcoin treasury$21.6M
Estimated Class A values use approximately 135.98 million post-split shares. The Aug. 25 decline erased about $11.0 million. The treasury held 278.0314 bitcoin worth about $21.6 million on Aug. 23.
Operating picture
Metric
Latest period
Reading
Investor signal
Revenue
Q2 2026
$34.841M
+34.8% YoY
Gross profit
Q2 2026
about $8.8M
roughly 25% margin
Net loss attributable to common
Q2 2026
−$21.654M
62.2% of revenue
Operating cash flow
H1 2026
−$9.885M
cash-consuming
Cash and equivalents
June 30, 2026
about $36.8M
below planned campus funding need
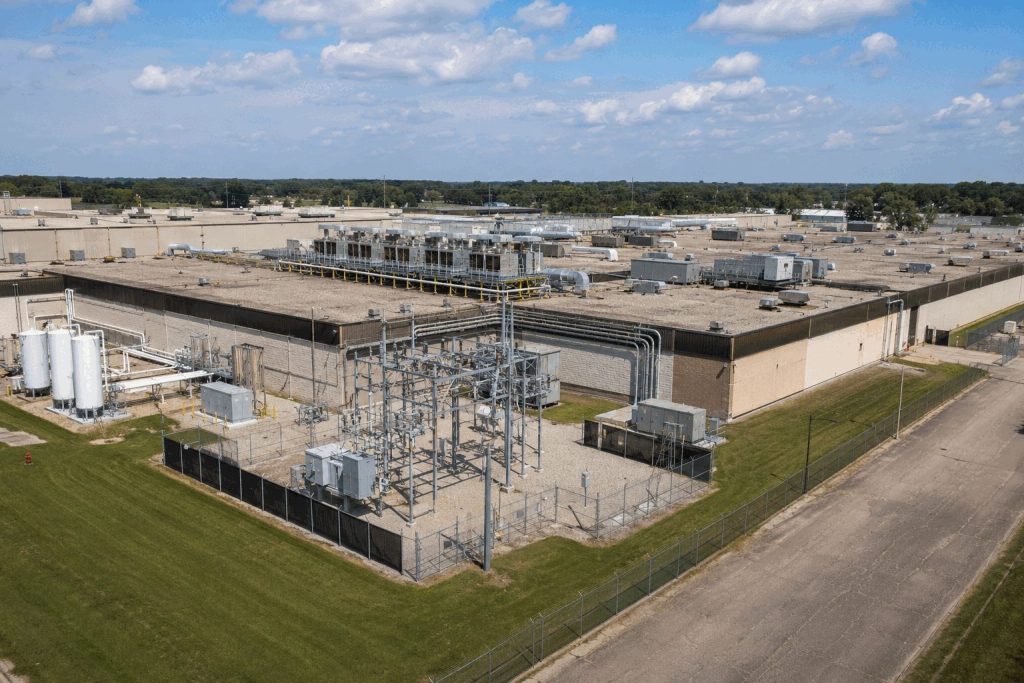
Michigan campus: the operating option
A customer commitment covers an initial 20 megawatts.
The Dowagiac site could expand toward 340 megawatts.
Management estimates more than $100 million of capital is required.
The latest filing says current liquidity is insufficient for the next 12 months.
No reliable current sell-side consensus price target was available at publication.
Risk register
Listing: a reverse split does not itself restore a durable price above $1.
Funding: campus expansion may require new debt, asset sales or dilution.
Bitcoin: treasury value introduces another volatile balance-sheet variable.
Execution: the 340-megawatt case depends on financing, construction and customer conversion.
Next investor checks
Whether GPUS can sustain a bid near the adjusted reference price.
Financing terms for the Michigan expansion and their share-count effect.
Named customer additions beyond the initial 20-megawatt commitment.
Weekly Bitcoin purchases, sales and value per common share.
Shares of NuScale Power Corporation surged 9.78% to close at $9.94 on Tuesday, boosting its market capitalization by approximately $379 million.
·3 min read
NuScale Power · NYSE: SMR
Nuclear AI meets a pre-revenue valuation
Market snapshot: August 25, 2026, 14:21 EDT · Regular session
$9.94+9.78% · +$0.89
$4.26B
Market capitalization
36.60M
Volume · 1.17× average
≈$379M
Value added in the session
Up to 80%
Faster information retrieval in proof of concept
Price position
The shares remain 82.7% below their $57.42 high. The 13-analyst average target implies 19.2% upside.
What changed
Fresh catalyst
NuScale deployed Nuclearn AtomAssist and NPX across engineering and knowledge management.
Proof-of-concept search-time reduction: up to 80%.
No customer contract, order value, revenue or savings target was disclosed.
Valuation versus operating scale
Signal
Value
Investor read
Q2 revenue
$75K
≈99% below estimate
Session value gain
≈$379M
>5,000× Q2 revenue
Liquidity
$1.9B
44.6% of market cap
ATM authorization
Up to $750M
17.6% of market cap
Module output
77 MWe
Up to 924 MWe for 12 modules
Analyst spread
Reference
Target
Cantor · Buy
$20.00
Texas Capital · Buy
$12.00
RBC · Hold
$10.00
Citi · Sell
$6.50
Consensus: 5 Buy, 7 Hold, 1 Sell.
Catalyst timeline
August 5Q2 revenue of $75K; liquidity reached $1.9B.
August 11Up to $750M at-the-market program registered.
August 20Texas Capital set a $12 Buy target.
August 25Nuclear-specific AI deployment announced; shares gained 9.78%.
Risk monitor
Internal efficiency is not the same as customer revenue. The proof-of-concept result may not translate into lower project costs. Licensing, financing, manufacturing readiness and binding customer commitments remain the larger valuation tests. Sector-wide strength also amplified Tuesday's move: Oklo rose 12.8% and Nano Nuclear Energy gained 6.4% in the same snapshot.
Sources: NuScale Power releases dated August 5 and August 25, 2026; SEC filing dated August 11, 2026; Google Finance market and analyst data captured August 25, 2026, 14:21 EDT. Calculations use displayed figures and may differ because of rounding.
The chart uses verified closes through Aug. 21 and the Aug. 25 intraday snapshot. The stock remains about 26% above its July 31 close despite Tuesday's drop.
Upcoming catalyst
Wells Fargo raises target to $120 and keeps Overweight.
Fiscal Q2 results after the close.
Management conference call and webcast.
High expectationsRegular session
Operating scorecard
Metric
Latest / guide
Signal
Q1 revenue
$387.1M; +39% YoY
Growth
Q1 subscription ARR
$1.57B; +32% YoY
Core demand
Q1 free cash flow
$73.6M; 19% margin
Leverage
Q2 revenue guide
$395M–$397M
+27.7% YoY at midpoint
Q2 adjusted EPS guide
$0.03–$0.05
Profitable
FY27 revenue guide
$1.638B–$1.648B
Valuation base
FY27 free-cash-flow guide
$293M–$303M
≈18.1% midpoint margin
Valuation hurdle
Price / FY27 revenue guide midpoint
≈11.4×
Consensus target
$103.07 · 13.3% upside
Target range
$85–$135
At the intraday price, the low target implies 6.6% downside and the high target 48.4% upside.
Analyst comparison
Firm / sample
Rating
Target
Implied move
Wells Fargo
Overweight
$120
+31.9%
Oppenheimer
Outperform
$120
+31.9%
Cantor Fitzgerald
Overweight
$120
+31.9%
KeyBanc
Overweight
$112
+23.1%
27-analyst consensus
Strong Buy
$103.07
+13.3%
What can break the setup
ARR growth below expectations, cautious forward guidance, or heavier investment could compress the revenue multiple. The stock's August rally also raises the threshold for a favorable post-earnings reaction.
Sources: Rubrik investor relations, Yahoo Finance, Wells Fargo research summary, S&P Global analyst compilation and company guidance. Time-sensitive market figures are stamped August 25, 2026, 14:33 EDT.
Shares of 707 Cayman Holdings Limited surged 57.85% on Tuesday, following the apparel supplier's announcement that it had entered into a non-binding term sheet…
·3 min read
NASDAQ: JEM · Stock move
707 Cayman acquisition dashboard
Crucial Innovation non-binding term sheet · Market data observed August 25, 2026, 14:25 EDT
Share price
$6.03
▲ 57.85% · +$2.21
Volume
14.47M
12.7× average
Market capitalization
$4.05M
≈$1.49M added today
Expected financing
$10.25M
2.5× market capitalization
Financing scale versus current business
Expected financing
$10.25M
Cash, Mar. 31
$5.13M
Six-month revenue
$4.43M
Daily value gain
$1.49M
Investor read: the financing headline is larger than the listed company's market value and more than twice its recent half-year revenue.
Deal status
NON-BINDING TERM SHEET
Target
Crucial Innovation
Sector shift
Apparel → botanical pharma
Financing lead
GeoNova Holdings
Valuation
Undisclosed
Consideration
Undisclosed
Analyst ratings
None available
Critical next disclosure: audited target results, definitive financing terms, share consideration and a closing timetable.
Latest operating base
Six months to Mar. 31
2026
Change / read
Revenue
$4.43M
−22.5%
Gross margin
4.35%
From 25.9%
Net loss
($9.74M)
Vs. profit
Share-based marketing cost
$8.41M
86% of net loss
Cash
$5.13M
At March 31
Operating cash use
$0.55M
Six months
Catalyst timeline
April 1320-for-1 reverse share split became effective.
July 14Second reverse split, 12-for-1, became effective.
August 10Interim filing showed revenue contraction and margin compression.
August 25Crucial Innovation term sheet and $10.25M financing framework announced.
Sources: Yahoo Finance live U.S. trending table; 707 Cayman company release at 11:20 EDT on August 25, 2026; SEC Form 6-K filed August 10, 2026. Market figures are time-stamped above. The acquisition is not definitive.
CoreWeave, Inc. shares climbed 2.32% on Tuesday as Rescale integrated its AI cloud with a digital-engineering platform utilized in five sectors. Shares changed hands…
·3 min read
CoreWeave · NASDAQ:CRWV · Commercial catalyst
Rescale opens a five-industry route into CoreWeave Cloud
Market snapshot: August 25, 2026, 13:12 EDT · U.S. regular session. Partnership announced August 25, 2026.
Share price
$88.25
+2.32% · +$2.00
Volume
8.62M
About 39% of Aug. 21 volume
Market value
$48.67B
≈+$1.10B today
52-week range
$60.55–153.20
42% below the high
What changed
RescaleDigital-engineering front end
CKSContainer orchestration
CoreWeaveAI/HPC compute, network, storage
Five verticalsAerospace, autos, energy, life sciences, manufacturing
Commercial terms, minimum usage and contract duration were not disclosed. The value lies in workload access; monetization still requires consumption.
Investor bridge
Backlog / market cap
2.14×
$104B backlog compared with $48.67B equity value. Backlog converts only as capacity becomes available and services are delivered.
Quarterly operating scorecard
Metric
Q2 2026
YoY / margin
Revenue
$2.575B
+112%
Adjusted EBITDA
$1.510B
59% margin
Operating loss
$49M
-2% margin
Net loss
$626M
-24% margin
Interest expense
$640M
24.9% of revenue
Property purchases
$6.422B
2.49× revenue
Capacity and balance-sheet load
June 30, 2026. Debt is the sum of current and long-term recourse and non-recourse balances.
Analyst recommendations
Firm / set
Date
Rating
Target
Upside / downside
38-analyst consensus
Aug. 25
Buy
$144.17
+63%
Truist
Aug. 19
Buy
$155
+76%
Goldman Sachs
Aug. 20
Hold
$139
+58%
Barclays
Aug. 13
Hold
$105
+19%
Bernstein
Aug. 12
Sell
$74
-16%
Bull case
Rescale adds a distribution layer for compute-heavy engineering. CoreWeave can diversify workload types while reusing the same GPU, networking and storage stack. Revenue growth above 100% and a backlog twice the equity value create substantial operating leverage if utilization rises.
Risk case
No commercial value was disclosed. Debt is more than six times cash, interest consumed nearly one quarter of quarterly revenue, and property purchases were 2.5 times revenue. Slow deployments or weak utilization can make new demand expensive to serve.
Shares of ParaZero Technologies Ltd. jumped 28.91% on Tuesday, following news that the drone-safety firm received its inaugural DefendAir order from a U.S. federal…
·3 min read
NASDAQ: PRZO · Stock move
ParaZero federal-order dashboard
First U.S. federal DefendAir order · Market data as of August 25, 2026, 14:06:26 EDT
Share price
$0.81
▲ 28.91% · +$0.18
Trading volume
70.76M
71.3× three-month average
Market capitalization
$21.01M
About $4.67M added today
Federal order value
Undisclosed
Launchers, Net Pods and training
Valuation response versus operating scale
Market-value gain
$4.67M
2025 revenue
$1.05M
2026 orders before award
$1.28M
Year-end liquidity
$4.20M
Investor read: the daily equity-value gain equals about 4.5 times 2025 revenue. The market is pricing a federal adoption signal before contract economics are known.
Catalyst snapshot
FIRST U.S. FEDERAL ORDER
DefendAir uses net-based interception rather than explosives or gunfire. The package includes launchers, Net Pods and on-site operator training.
Customer
U.S. federal security entity
Order size
Not disclosed
Order contents
Hardware + training
Analyst ratings found
0
Shares outstanding
25.93M
Watch: follow-on awards, disclosed order values, delivery timing and recurring Net Pod demand.
Financial base
Metric
2025
Signal
Revenue
$1.047M
+12.3%
Gross profit
≈$0.050M
≈4.8% margin
Net loss
($5.412M)
Improved 51%
Cash + short-term deposits
≈$4.2M
At Dec. 31
2026 direct offerings
≈$7.5M gross
Liquidity + dilution
Source dates: 2025 results released March 26, 2026; market data captured August 25, 2026, 14:06:26 EDT.
Commercial timeline
Early 2026$1.278M of customer orders announced before the current award.
March 262025 revenue reported at $1.047M; net loss narrowed to $5.412M.
August 3Initial DefendAir order from a Tier-1 European defense manufacturer.
August 25First U.S. federal DefendAir order; shares rose 28.91%.
Sources: ParaZero SEC filing dated August 25, 2026; Google Finance; ParaZero 2025 results and product disclosures. No order value or reliable analyst consensus was available at publication.
Shares of Navitas Semiconductor Corporation climbed 5.3% on Tuesday after the company announced a deal to acquire Claros for as much as $232.8 million.…
·3 min read
NVTS · Deal dashboard
Navitas + Claros
Near-chip power technology meets a cash-and-stock acquisition
Market data: Aug. 25, 2026 13:27 EDT / 19:27 CEST
Share price
$12.88
▲ 5.31% regular session
Range $12.41–$13.44
Volume
9.7M
Shares traded by 13:27 EDT
67% of 14.3M Aug. 21 volume
Deal value
$232.8M
Up to; based on $12.97 reference price
Market value
$3.36B
About 92× trailing revenue
Transaction funding
Investor read: maximum disclosed merger shares, earnout shares and retention awards total about 10.4 million, or roughly 4.0% of the current 261.1 million shares.
Eight-analyst consensus: Neutral · average target $14.08
What changes — and when
Claros closes Navitas's power chain from the grid to the processor package. The transaction adds a claimed $3.5B VPD/IVR market, but management expects the revenue lift mainly from 2028–2029.
Current GaN/HV-SiC SAM $3.5BNew JFET SAM $1.0BClaros VPD/IVR SAM $3.5B+Post-deal 2030 SAM $8B+
Catalysts and risks
Next confirmationRegulatory clearance and closing before Dec. 31
Operating proofQ3 revenue near $13.5M and 39.7% non-GAAP margin
Strategic proofVPD/IVR customer ramps from 2028–2029
Shares of Advanced Micro Devices rose 4.3% to $476.50 on Tuesday, after a Raymond James upgrade, drawing increased market attention to CPUs as well…
·3 min read
NASDAQ: AMD · Stock move · Server CPU thesis
AMD's 4% rally prices a much larger role for CPUs in agentic AI
AMD snapshot: August 25, 2026, 12:45 EDT · U.S. regular session · Peer snapshots: 12:50–12:59 EDT
AMD price
$476.50
+$19.75 · +4.33%
Market value
$779B
About $32.2B added today.
Volume
11.3M
Shares by 12:40 EDT.
Forward P/E
41.1×
Execution remains expensive.
What changed
$641 target
Raymond James moved AMD to Strong Buy from Outperform and raised its target from $565. The firm models a 44% five-year CAGR for server CPUs, reaching $201B in 2030.
Fresh catalyst: Aug. 25Target upside: 34.5%Analyst: Simon Leopold
$641 × 1.63B shares ≈ $1.045T implied value $1.045T − $779B ≈ $266B valuation gap
Price and target ladder
Operating proof points
Measure
Q2 2026
Y/Y
Revenue
$11.54B
+50%
Data Center
$6.72B
+107%
Data Center mix
58%
Core engine
Non-GAAP gross margin
56%
+13 pts
Q3 revenue midpoint
$13.0B
≈+41%
2026 consensus
Revenue
+46.7%
EPS
+81.5%
Free cash flow
$7.46B
Analysts model $50.8B revenue and $7.57 adjusted EPS. The target case needs earnings to compound faster than sales.
Analyst map
Source
Rating
Target
Upside at $476.50
Date
Raymond James
Strong Buy
$641
34.5%
Aug. 25
Roth MKM
Buy
$650
36.4%
Aug. 20
BMO Capital
Buy
$550
15.4%
Aug. 20
Bernstein
Buy
$650
36.4%
Aug. 13
54-analyst consensus
Strong Buy
$612.29
28.5%
Aug. 25 snapshot
Peer tape
Company
Price
Session move
Market cap
Forward P/E
AMD
$476.50
+4.33%
$779B
41.1×
Nvidia
$212.34
+1.85%
$5.14T
20.8×
Intel
$88.21
+1.09%
$463.5B
52.5×
AMD's outperformance isolates the company-specific upgrade from the broader chip rebound.
Risk monitor
High bar
A slower agentic-AI rollout, weaker server share gains, export controls or price competition would challenge the $201B thesis. Nvidia reports August 26 after the close. Its outlook can reset the entire AI-infrastructure valuation curve.
Richtech Robotics Inc. shares jumped 16.7% on Tuesday after the service-robot maker authorized a $12 million stock-repurchase program. The stock traded at $1.89 at…
·2 min read
NASDAQ: RR · Stock move
Buyback signal meets a doubled share count
Richtech Robotics Inc. · Service robotics · Market open
Market data: Aug. 25, 2026 12:21 EDT
Share price
$1.89
+16.67%
Previous close: $1.62
Volume
8.05M
1.63× average
20-day average: 4.94M
Market value
$425.4M
About $60.8M added today
Buyback ceiling
$12M
Authorization, not a commitment
Capital structure test
Potential retirement is small beside issuance
Issued base expandedHypothetical full buyback
Buyback math at $1.89
Potential shares6.35M
Shares outstanding225.10M
Market-cap share2.82%
Cash-pool share3.53%
Authorization endAug. 21, 2027
Financial snapshot
Cash + short investments$339.6M
TTM revenue$5.39M
TTM net loss−$4.41M
TTM free cash flow−$29.12M
Price / sales67.7×
Enterprise value / sales4.8×
What changed
$12 million Rule 10b5-1 repurchase plan
The board authorized purchases of Class B stock through Aug. 21, 2027. No minimum purchase is required. The board may modify, pause or end the program without notice.
Investor read-through: Tuesday's $60.8 million market-cap gain is about five times the authorization. The response therefore reflects a valuation signal, not only prospective demand for 6.35 million shares.
Published analyst views
Firm
Action
Rating
Target
Date
Vs. $1.89
Freedom Broker
Upgrade
Hold
$2
Aug. 16, 2026
+5.8%
H.C. Wainwright
Reiterate
Buy
$6
Feb. 2, 2026
+217.5%
Coverage is sparse. The target spread highlights unusually wide uncertainty around commercialization and valuation.
Watch list
Actual repurchases Future filings must show whether the authorization was used.Primary
Share count New issuance can outweigh buyback activity.225.10M
Commercial scale Nine-month revenue was $3.95M versus a $20.41M net loss.Execution risk
Short positioning Short interest equals 21.2% of shares outstanding.Volatility