Core AI Stock Jumps 56% as Q2 Revenue Rises to $22.4 Million
Core AI Holdings shares jumped about 56% on Friday after quarterly revenue reached $22.35 million. Trading volume exceeded 205 million shares, roughly 388 times…
Technology
Core AI Holdings shares jumped about 56% on Friday after quarterly revenue reached $22.35 million. Trading volume exceeded 205 million shares, roughly 388 times its recent average.
All coverage
Core AI Holdings shares jumped about 56% on Friday after quarterly revenue reached $22.35 million. Trading volume exceeded 205 million shares, roughly 388 times…
NASDAQ: CHAI · Mobile games and advertising analytics
| Metric | Q2 2026 | Q2 2025 | YoY |
|---|---|---|---|
| Revenue | $22.35m | $14.34m | +55.8% |
| Gross profit/(loss) | ($0.01m) | ($0.40m) | 97.2% narrower |
| Net loss | ($1.62m) | ($0.76m) | +114% |
| H1 revenue | $26.12m | $28.85m | -9.5% |
| H1 operating cash flow | $5.45m | ($2.42m) | Turned positive |
Pasqal Holding SA surged 54.7% during its Nasdaq debut. The stock was at $15.14 as of 10:57 EDT, with trading volume at 2.15 million…
Using the original 264.4M-share model, $14.50 implies an illustrative $3.83B equity value—not a verified current market cap.
| Measure | Reading | Investor interpretation |
|---|---|---|
| 2025 commercial revenue | €16.5M | 4.7× 2024 level |
| 2025 total revenue incl. grants | €23.7M | Grants remain material |
| Booked / awarded business | >€66M | >4.0× commercial revenue |
| Illustrative equity value | $3.83B | ≈200× 2025 commercial revenue* |
| Cash per modeled share | ≈$1.36 | Based on $360M / 264.4M |
| Company | Price | Day | Market value |
|---|---|---|---|
| Pasqal | $14.50 | +48.12% | Debut; share count unsettled |
| IonQ | $39.17 | −7.75% | $14.42B |
| Rigetti | $15.63 | −4.93% | $5.20B |
| D-Wave | $16.81 | −6.12% | $6.23B |
| Quantum Computing | $8.16 | −5.72% | $1.83B |
Synopsys, Inc. dropped 3.4% on Friday, wiping out approximately $3.1 billion in market capitalization following a surge on Thursday after earnings. Despite the pullback,…
A $3.1B pullback leaves most of the earnings rerating intact.
Friday retraced about 29% of Thursday’s estimated $10.6B market-value gain.
| Measure | Latest | Signal |
|---|---|---|
| Q3 revenue | $2.477B | +42% YoY |
| GAAP net income | $545.8M | +125% YoY |
| Non-GAAP EPS | $3.91 | Above guide |
| FY revenue midpoint | $9.715B | Raised |
| Operating cash-flow target | ≈$2.8B |
| Free cash-flow target | ≈$2.6B |
| FCF / revenue midpoint | 26.8% |
| Average analyst target | $544.97 |
| Target upside | ≈21% |
Ansys integration costs, slower EDA demand and weaker cash conversion could compress the earnings multiple. The gap between 41.5% non-GAAP and 10.4% GAAP operating-margin guidance remains large.
Q4: $2.530B–$2.580B revenue and $4.10–$4.16 non-GAAP EPS. Full year: $15.04–$15.10 non-GAAP EPS and approximately $2.6B free cash flow.
Sources: Synopsys fiscal Q3 release and financial supplement; market data at 11:33:12 EDT; analyst consensus accessed Aug. 28. Market-value changes are estimates derived from reported price moves and current capitalization. Not investment advice.
FingerMotion, Inc. shares surged over threefold on Friday, following the announcement of a modular artificial-intelligence data-center plan with BlueFlare Energy Solutions. The move boosted…
The market priced an AI-infrastructure plan before contracts.
| Measure | Figure | Status |
|---|---|---|
| Lyken.AI ownership | 9.9% | Acquired |
| FNGR shares issued | 1,674,480 | Restricted |
| Cash paid | $0 | Equity-funded |
| B300 nodes | 128 | Nonbinding MOU |
The rally values execution that has not occurred. No site, power, customer or project-financing agreement is definitive. The Lyken customer memorandum is nonbinding. Equity consideration dilutes holders, while micro-cap liquidity can reverse quickly.
Illustrative milestone completion: strategy disclosed; four core contractual steps remain.
Sources: FingerMotion announcement and June 8-K; Aug. 28 filing summary; market data at 11:26:07 EDT. Implied prior market cap and value added are calculations from current market cap and the 261.7% price move. Not investment advice.
NEW YORK, August 28, 2026, 11:13 – SharonAI shares slid 4.2% as uncertainty grew over its $4.88 billion deal with Nvidia, following Nvidia's decision…
Reuters reported Nvidia paused some credit-support deals that exchanged financing help for cloud-revenue participation.
Nvidia said the broader compute-access model remains in place and continues to evolve.
| Metric | Value | Signal |
|---|---|---|
| Revenue | $1.93M | +412% YoY |
| Adjusted EBITDA | $0.59M | Positive |
| Net loss | −$430.4M | Mostly non-cash |
| Cash | $1.861B | Build-out buffer |
| Current note liabilities | $1.007B | Financing weight |
| Checkpoint | Why it matters |
|---|---|
| Financing terms | Determines deployment cost and equity dilution |
| GPU acceptance | Triggers capacity availability and revenue |
| Customer utilization | Turns reserved capacity into billed sales |
| Contract amendments | Tests whether Nvidia's pause reaches SharonAI |
| Cash burn | Measures runway during infrastructure ramp |
The stock move values implementation risk, not simply demand. SharonAI's SEC filing already says deployments need additional debt or equity financing and face phased acceptance tests.
Key question: can $8.8 billion of contracted value convert into revenue without costly new capital?
Veeva Systems held onto most of its post-earnings gains on Friday, as higher subscription growth and expanding operating margins contributed to a valuation boost…
| Metric | Q2 FY27 | Q2 FY26 | Change |
|---|---|---|---|
| Total revenue | $928.0M | $789.1M | +18% |
| Subscription revenue | $766.8M | $659.2M | +16% |
| GAAP operating income | $275.0M | $195.9M | +40% |
| GAAP net income | $273.4M | $200.3M | +37% |
| Adjusted EPS | $2.35 | $1.99 | +18% |
Recurring subscription growth and restrained cost expansion drove the earnings leverage.
Vault CRM conversions and Falcon deployments are the clearest operating tests behind the AI narrative.
Shares of SentinelOne declined 5.94% in premarket trading on Friday following a mixed earnings forecast. Robust growth in recurring revenue did not counterbalance the…
Recurring growth versus weaker per-share profit expectations
Premarket: August 28, 2026, 09:30 EDT · Results: fiscal Q2 ended July 31, 2026| Metric | New | Previous / consensus |
|---|---|---|
| Q3 revenue | $309M–$311M | $310M consensus |
| Q3 adjusted EPS | $0.08–$0.09 | $0.10 consensus |
| FY revenue | $1.202B–$1.207B | $1.195B–$1.205B |
| FY operating income | $124M–$128M | $115M–$125M |
| FY adjusted EPS | $0.30–$0.32 | $0.32–$0.38 |
| FY diluted shares | 361M | 350M |
Bar lengths normalize the displayed growth rates to a 25% scale.
| Non-GAAP operating margin | 10% | 2% year ago |
| Non-GAAP net margin | 10% | 5% year ago |
| GAAP gross margin | 72% | 75% year ago |
| Non-GAAP gross margin | 77% | 79% year ago |
| GAAP net margin | −32% | −30% year ago |
Change in guidance midpoints versus the prior company outlook.
The selloff reflects a quality-of-earnings question. ARR and revenue still grow above 20%, and adjusted operating margin reached a record 10%. Yet a larger diluted share count and lower EPS range mean that improved operations are not translating cleanly into per-share earnings.
| Cash and investments | $813M |
| Q2 free cash flow | −$13.2M |
| Six-month operating cash flow | $31.9M |
| Six-month free cash flow | $17.5M |
| GAAP Q2 net loss | $93.4M |
| Consensus | Overweight |
| Buy / Overweight | 22 |
| Hold | 16 |
| Average target | $22.98 |
| Target range | $15.50–$28.00 |
Average target implies roughly 8% upside from the 09:30 EDT premarket price.
Sources: SentinelOne fiscal Q2 2027 release and filings; MarketWatch; Public premarket data; Investor’s Business Daily; WSJ/FactSet. Extended-hours prices can be thin and volatile.
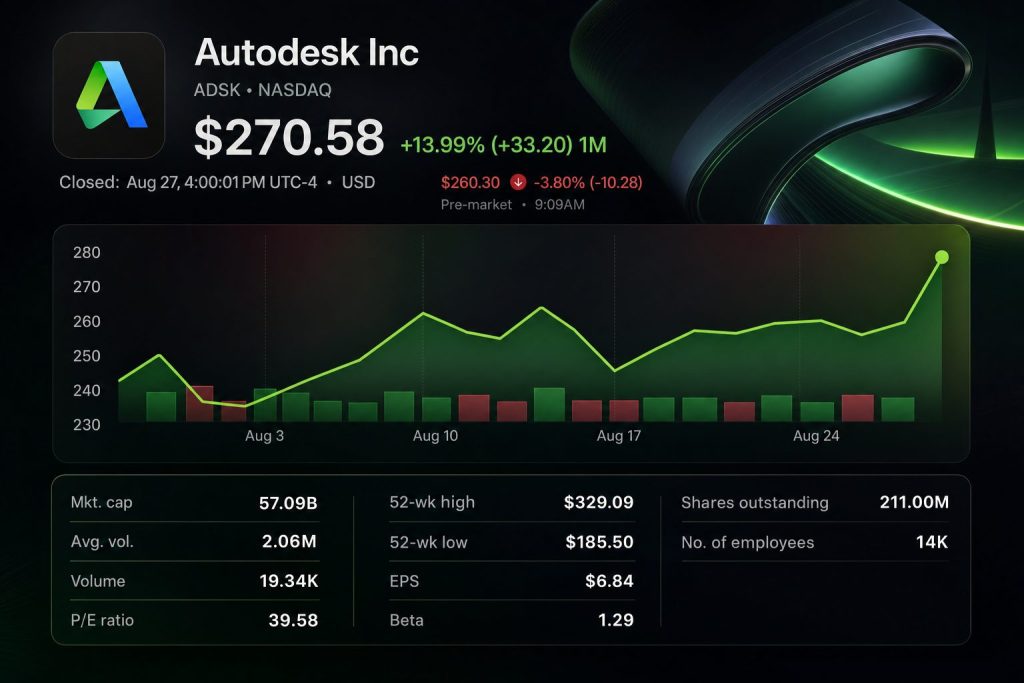
Autodesk, Inc. dropped 4.1% after reporting a robust quarter but issuing a weaker short-term profit outlook. Shares changed hands at $259.50 as of 07:15…
| Metric | Q2 FY27 | YoY |
|---|---|---|
| Billings | $1.854B | +10% |
| Revenue | $2.046B | +16% |
| GAAP operating margin | 29% | +4 pts |
| Adjusted margin | 41% | +2 pts |
| Adjusted EPS | $3.30 | +$0.68 |
| Current RPO | $5.245B | +12% |
| Total RPO | $7.433B | +2% |
| Deferred revenue | $4.258B | +11% |
| Unbilled deferred revenue | $3.175B | -8% |
Lower multi-year discounts support pricing but temporarily weigh on long-duration RPO.
| Revenue | $8.295B–$8.345B |
| Billings | $8.575B–$8.650B |
| Adjusted margin | ≈39% |
| Adjusted EPS | $12.52–$12.60 |
| Free cash flow | $2.725B–$2.750B |
Free cash flow includes about $45M of MaintainX transaction expenses.
Autodesk is expanding revenue, current backlog and margins. The selloff says the market wants that strength to reach per-share profit faster. MaintainX can deepen the platform, but its integration now sets the next execution hurdle.
Sources: Autodesk Aug. 27, 2026 earnings release and opening commentary; MarketWatch; Barron’s; MarketBeat. Market figures may be delayed. Informational only.
SANTA CLARA, California, August 28, 2026, 07:21 — Marvell Technology fell 6.9% as investors reacted to Google's adjusted forecast, placing significant AI-related revenue gains…
Management lifted fiscal 2027 guidance by about $500 million and fiscal 2028 guidance by about $1.5 billion.
| Metric | Q2 FY27 | Signal |
|---|---|---|
| Revenue | $2.739B | +37% |
| Adjusted EPS | $0.94 | $0.93 est. |
| GAAP net income | $308M | +58% |
| Operating cash flow | $605.5M | 22.1% margin |
| Non-GAAP gross margin | 58.9% | Profitable scale |
| Signal | Current view | Investor meaning |
|---|---|---|
| Q3 revenue | $3.15B ±5% | More than 50% growth implied |
| Q3 adjusted EPS | $1.10 ±$0.05 | Above Q2 run-rate |
| Google contribution | Some through FY28 | Larger in FY29 |
| Investor Day | Oct. 6, 2026 | Next major detail point |
The median target offers roughly 22% upside from premarket. Forward P/E is 58.4×, versus 32.2× for Broadcom.
Rubrik, Inc. stock dropped 6.7% in premarket trade on Friday, even after the company surpassed quarterly expectations. The slide wiped about $1.5 billion in…
The selloff reversed part of Thursday’s 11.3% surge. Premarket price remained 3.9% above Wednesday’s close, supporting an expectations-reset reading.
| Metric | Q2 FY27 | Signal |
|---|---|---|
| Revenue | $427.3M | +38% |
| Subscription revenue | $407.2M | +37% |
| Cloud ARR | $1.48B | +39% |
| $100K+ ARR customers | 3,084 | +23% |
| Free cash flow | $65.7M | 15% margin |
| Fiscal 2027 | New range | Prior range |
|---|---|---|
| Revenue | $1.685B–$1.693B | $1.638B–$1.648B |
| Adjusted EPS | $0.47–$0.53 | $0.25–$0.35 |
| Subscription ARR | $1.880B–$1.885B | Raised |
| Free cash flow | $323M–$333M | Raised |
Twenty-eight analysts tracked by StockAnalysis rate the shares Buy or Strong Buy. New post-results targets included $115, $120 and $130.
SAN JOSE, California, August 28, 2026, 07:02 — PayPal Holdings Inc shares slumped 15.4% after the company called off its pursuit of a $53…
Shares of Okta Inc. jumped 28.6% on Thursday following reports of faster backlog growth and an upgraded annual forecast. The stock ended the session…
| Metric | Q2 FY27 | YoY |
|---|---|---|
| Revenue | $805M | +11% |
| Subscription revenue | $793M | +12% |
| RPO | $4.858B | +17% |
| cRPO | $2.585B | +14% |
| GAAP operating income | $107M | +161% |
| Free cash flow | $227M | +40% |
| Period | Metric | Guidance |
|---|---|---|
| Q3 FY27 | Revenue | $813M–$817M |
| Q3 FY27 | cRPO | $2.590B–$2.600B |
| Q3 FY27 | Operating margin | 24%–25% |
| FY27 | Revenue | $3.216B–$3.226B |
| FY27 | Free cash flow | $910M–$930M |
| FY27 | FCF margin | 28%–29% |
Okta’s rally rests on a measurable combination: faster near-term backlog growth, a doubled GAAP operating margin and 28% free-cash-flow conversion. The stock now prices in continued cRPO expansion and little tolerance for a guidance miss.
CrowdStrike Holdings jumped 20.5% to $227.96 on Thursday after the company reported record recurring-revenue growth and raised its annual outlook. Trading volume reached roughly…
Record net new ARR and stronger cash conversion pushed the stock near fresh highs. The valuation now leaves less room for a routine quarter.
Market close: Aug. 27, 2026, 16:00 EDT · Financials: quarter ended July 31, 2026The pre-report reference is inferred from the 20.5% one-day move. Closing data are timestamped Aug. 27, 2026, 16:00 EDT.
Net new ARR accelerated faster than total ARR. Falcon Flex ARR exceeded $2.29B and grew 101%, showing larger platform commitments rather than a narrow seat expansion.
| Revenue guide midpoint | $6.001B |
| Prior midpoint | $5.935B |
| Guide increase | $66M |
| Q3 revenue midpoint | $1.526B |
| Metric | Q2 FY27 | Change |
|---|---|---|
| Revenue | $1.471B | +26% |
| Subscription revenue | $1.400B | +27% |
| GAAP subscription margin | 78% | +1 pt |
| Operating cash flow | $530.3M | +59% |
| Free cash flow | $377.4M | +33% |
| GAAP operating loss | ($33.2M) | improved $72.3M |
Adoption rates among subscription customers as of July 31, 2026.
| Company | Ticker | Daily move |
|---|---|---|
| Okta | OKTA | +28.6% |
| CrowdStrike | CRWD | +20.5% |
| Palo Alto Networks | PANW | +12.8% |
| ServiceNow | NOW | +10.0% |
Software and security stocks also benefited from renewed AI spending confidence.
| Implied equity value | ~$238B |
| FY27 guide midpoint multiple | ~39.7× sales |
| Raised analyst targets | $238–$250 |
| Upside to target range | 4.4%–9.7% |
| Consensus | Buy · 44 analysts |
Equity value uses $227.96 and 1.044B diluted weighted-average shares. It is an approximation, not the exchange-reported market capitalization.
Valuation risk is immediate: raised price targets sit close to the market price.
Other watchpoints: long enterprise sales cycles, intense platform competition, acquisition integration, and $399.0M of quarterly stock-based compensation.
SAN FRANCISCO, August 27, 2026, 18:45 EDT — PagerDuty stock eased 0.2% in after-hours trading after the company announced it will cut its workforce…
Cost controls and a 15% workforce reduction lifted the earnings outlook. Revenue grew just 0.8%, leaving shares almost unchanged after hours.
Q2 FY2027Reported Aug. 27, 2026The margin expansion is the dominant signal. Customer and recurring-revenue growth remain modest.
| Metric | New | Prior | Midpoint change |
|---|---|---|---|
| FY revenue | $491.5M–$496.5M | $488.5M–$496.5M | +0.3% |
| FY adj. EPS | $1.33–$1.37 | $1.27–$1.32 | +4.2% |
| Q3 revenue | $123M–$125M | — | New |
| Q3 adj. margin | 26.5%–27.5% | — | New |
Bull case: The restructuring protects cash generation and supports a higher EPS range. Q2 beat revenue guidance, and free cash flow improved.
Bear case: ARR grew only 0.4% and retention stayed below 100%. The stock already trades above the average analyst target.
Watch next: Q3 revenue of $123M–$125M, adjusted margin of 26.5%–27.5%, retention and the pace of restructuring charges.
Shares of Elastic N.V. jumped 19.7% following an earnings report that surpassed expectations on Thursday. The rise boosted its market capitalization by roughly $1.7…
| Metric | Q1 FY2027 | Change / reference |
|---|---|---|
| Total subscription revenue | $449M | +15% |
| Sales-led subscription revenue | $399M | +18% |
| Total RPO | $1.854B | +27% |
| Net expansion rate | ~111% | Stable expansion signal |
| Non-GAAP operating margin | 16.2% | $77M income |
| GAAP operating margin | -5.0% | $24M loss |
Consensus: 24 analysts. Targets may reset after the earnings release.
SANTA CLARA, August 27, 2026, 18:05 — Marvell Technologies stock slid 7.6% in after-hours trading, despite the company reporting record quarterly revenue of $2.74…
The fundamentals beat estimates, but not elevated AI expectations. Q3 revenue guidance exceeded consensus by about 4%, while the non-GAAP gross-margin midpoint falls 90 basis points sequentially.
| Metric | Q2 FY26 | Q2 FY27 | YoY |
|---|---|---|---|
| Revenue | $2.006B | $2.739B | +36.5% |
| GAAP operating income | $290.1M | $459.7M | +58.5% |
| GAAP gross margin | 50.4% | 53.1% | +270 bp |
| Operating cash flow | — | $605.5M | — |
| Metric | Guide midpoint | Consensus | Premium |
|---|---|---|---|
| Revenue | $3.15B | $3.03B | +4.0% |
| Adjusted EPS | $1.10 | $1.07 | +2.8% |
| Non-GAAP gross margin | 58.0% | — | −90 bp QoQ |
Revenue midpoint implies roughly 15% sequential growth.
Watch: custom-silicon ramps, optical demand, customer concentration, supply, gross-margin conversion and cash returns.