Earnings ReportsStock Market
TOP Financial Shares Jump 8.5% Despite 19% Revenue Drop and Shift to Loss
Shares of TOP Financial Group climbed 8.5% on Friday, despite reporting decreased revenue and a swing back to losses for the recent quarter. The…
Market intelligence
Fast, evidence-led coverage of the companies and events moving global markets.
All coverage
Shares of TOP Financial Group climbed 8.5% on Friday, despite reporting decreased revenue and a swing back to losses for the recent quarter. The…
The market move and operating direction diverged. The split-adjusted nominal price should not be read as business growth.
| Metric | Latest | Reference |
|---|---|---|
| Quarter revenue | $1.08M | $1.33M prior year |
| Quarter net result | -$113K | +$86K prior year |
| FY2026 revenue | $4.72M | Total expenses: $5.40M |
| Institutional ownership | 0.26% | Thin professional participation |
| Analyst consensus | Sell | One tracked analyst |
The shares closed near a 52-week high while revenue contracted and profit turned negative. A durable rerating needs brokerage activity to produce revenue growth faster than compliance and operating costs.
Quarterly revenue decline: 18.8% year over year
| Next earnings evidence | Revenue recovery and return to profit |
| Structure | One-for-five reverse split approved July 30 |
| Liquidity | Thin ownership can magnify price moves |
| Coverage | One analyst limits consensus value |
New York, August 31, 2026, 06:20 EDT — Solstice stock climbed 12.8% following the company's move to launch a $500 million share buyback programme,…
NASDAQ: SOLS · investor dashboard
Price: August 28, 2026 close · Financials: Q2 2026
| Metric | Q2 | Growth / change | Signal |
|---|---|---|---|
| Net sales | $1.148B | +11% | Broad volume growth |
| Adjusted EBITDA | $290M | +2% | Weak conversion |
| Adjusted EBITDA margin | 25.3% | -218 bp | Turnaround costs |
| Adjusted EPS | $0.88 | +$0.03 vs estimate | Beat |
| Measure | Guidance | Midpoint |
|---|---|---|
| Sales | $4.125B-$4.185B | $4.155B |
| Adjusted EBITDA | $1.035B-$1.055B | $1.045B |
| Adjusted EPS | $2.75-$2.95 | $2.85 |
| Capital spending | $420M-$440M | $430M |
Seven published targets average about $79.43, versus Friday's $63.53 close.
Low $70 · Average $79.43 · High $85 · Implied average upside 25%
SAN JOSE, California, August 31, 2026, 05:54 EDT — PayPal Holdings Inc shares fell 12.7% after reporting an operating margin of 17.4%, raising questions…
| Q2 TPV | $486.4bn |
| Q2 transaction-margin dollars | $3.9bn |
| Adj. operating margin | 17.4% |
| 2026 TM-dollar outlook | ≈$15.6bn |
| Year-end savings target | ≈$400m |
| H2 transformation charges | up to $140m |
| Driver | Investor read |
|---|---|
| Bid withdrawal | Premium removed |
| Low multiple | Downside support |
| Margin contraction | Execution burden |
| Branded checkout | Share test |
Third-quarter results must show savings offsetting cloud, fraud and marketing investment. Faster transaction-margin growth would support a rerating; another margin miss could keep PayPal below the abandoned offer price.
Sources: PayPal Q2 2026 results; Reuters reports dated July 28 and August 28, 2026. Company measures include non-GAAP figures.
ServiceNow Inc. gained 4.5% on Friday, finishing at $144.71. The increase brought renewed focus to a core software debate: is AI-driven revenue enough to…
| Company | P/E | Move |
|---|---|---|
| ServiceNow | 89.3× | +4.5% |
| Salesforce | 23.5× | +1.6% |
| Workday | 41.4× | +5.6% |
| Oracle | 27.1× | -0.8% |
ServiceNow's premium requires sustained growth above peers.
| RPO | $29.0bn |
| Current RPO | $13.2bn |
| Non-GAAP operating margin | 29.5% |
| H1 free cash flow | $2.3bn |
| FY subscription guide | $15.76–15.78bn |
AI contract value must grow roughly 50% from the Q2 run rate to reach the year-end target. Pricing pressure, stock compensation or weaker backlog would make the valuation premium harder to defend.
Sources: ServiceNow Q2 2026 results and investor relations; current market data timestamped above. Non-GAAP measures are management figures.
Pfizer Inc. edged down 0.2% on Friday, closing at $27.96. The modest change belies a more pronounced battle between expanding sales from key drugs…
| Company | P/E | Move |
|---|---|---|
| Pfizer | 36.8× | -0.2% |
| J&J | 31.1× | +0.8% |
| Merck | 118.7× | -0.8% |
| Eli Lilly | 39.4× | -0.2% |
Pfizer trades near 9.6× the midpoint of adjusted 2026 EPS guidance. The trailing multiple is distorted by impairments.
| First-half dividends | $4.9bn |
| Internal R&D | $5.3bn |
| 2026 buybacks | $0 |
| Indicated yield | 6.15% |
| Cost savings by end-2026 | $5.7bn |
Core products must outrun a roughly $4 billion COVID franchise. Patent losses, pricing pressure and integration charges can absorb the benefit of launched-product growth.
Sources: Pfizer Q2 2026 release and investor relations; market data timestamped above. Guidance and non-GAAP measures are management figures.
At 05:00 EDT, U.S. stock futures edged down as fresh clashes between the U.S. and Iran pushed oil prices past $90. Nasdaq futures managed…
| Proxy | Level | 04:00–05:00 | Last hour |
|---|---|---|---|
| SPY | $768.33 | -0.13% | -0.13% |
| QQQ | $716.04 | -0.05% | -0.05% |
| IWM | $296.09 | +0.11% | +0.11% |
| DIA | $534.42 | -0.12% | -0.12% |
The premarket was exactly one hour old, so both columns cover the same available interval.
Two-year Treasury yields, Gulf headlines and airline/utility reactions. Chicago PMI comes later Monday; ISM manufacturing follows Tuesday and payrolls Friday.
Breadth and consolidated volume are not representative before the 09:30 EDT cash open.
Sources: Yahoo Finance futures snapshot at 05:00 EDT; Investing.com premarket snapshot at 04:45 EDT; MarketWatch; Reuters/AP market reports.
NEW YORK, August 31, 2026, 05:12 EDT AT&T's stock advanced 2.3% after the company announced $4.7 billion in cash flow, which will be allocated…
NYSE: T · fiber cash conversion and capital returns
Snapshot: Aug. 31, 2026 · 04:50 EDT
| Company | P/E | Move |
|---|---|---|
| AT&T | 8.6× | +2.3% |
| Verizon | 13.0× | +1.3% |
| T-Mobile US | 19.0× | +2.0% |
Prices: Aug. 31 premarket snapshot. AT&T volume Friday was 22.7m versus a 65.5m 50-day average.
| 2026–28 annual capital investment | $23–24bn |
| Q2 shareholder returns | $4.1bn |
| Q2 buybacks | $2.2bn |
| 2026 adjusted EPS guide | $2.25–2.35 |
Legacy erosion is accelerating. Higher build costs, weaker fiber take-rates or pricing pressure could slow free-cash-flow conversion. The EchoStar transaction also makes leverage reduction a competing use of cash.
Sources: AT&T Q2 2026 release and Form 10-Q; MarketWatch; market prices as timestamped. Figures are reported, except valuation ratios calculated from quoted market data.
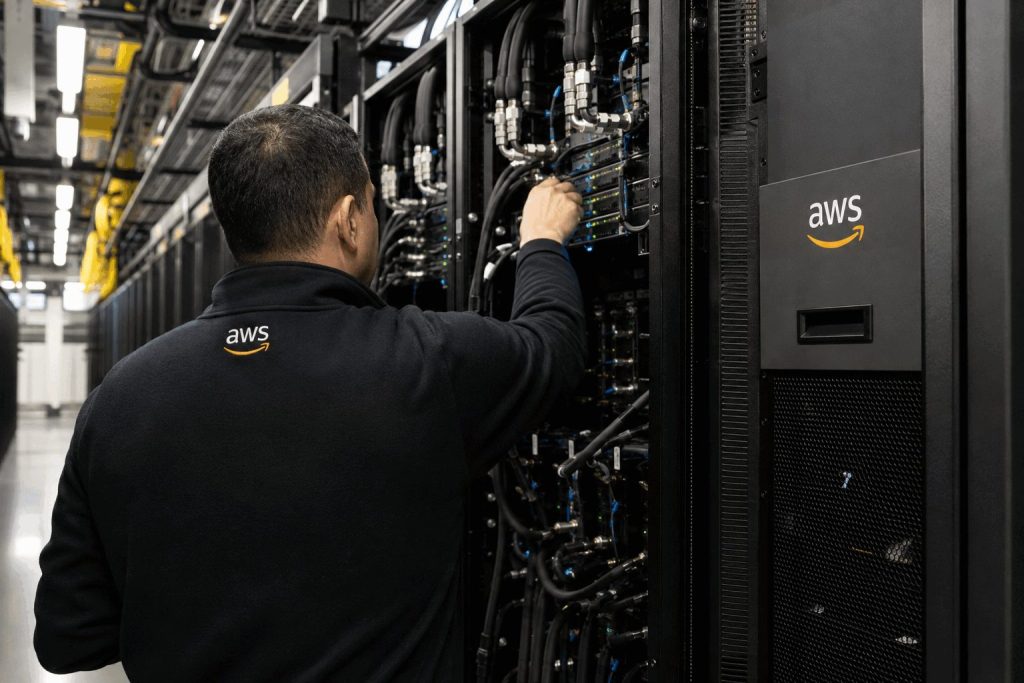
Amazon.com rose roughly 4% on Friday following an analyst upgrade that emphasized the possibilities for agentic AI to enhance retail operations. Shares were around…
AWS generated 60% of group operating profit from 21% of sales.
| Group sales | $200.6B |
| Operating income | $27.5B |
| AWS sales | $42.2B |
| AWS operating income | $16.6B |
| AWS operating margin | 39.3% |
| Advertising growth | 26% |
| Measure | Current TTM | Prior TTM |
|---|---|---|
| Operating cash flow | $161.4B | $121.1B |
| Free cash flow | −$7.6B | $18.2B |
| P&E purchase increase | +$66.1B year over year | |
| Implied annualized Q2 operating profit | $110.0B | |
| Market value / annualized operating profit | ~26× | |
Core test: keep AWS near 37% growth without making negative free cash flow structural.
Sources: Amazon Q2 2026 results; current market quotes; public reporting on the AWS–NVIDIA expansion. Estimates may differ from reported GAAP measures.
New York, August 31, 2026, 04:30 - Nokia stock dropped 3.6% as the company's €732 million cash burn put added pressure on the telecom…
The reported-margin marker sits below zero; restructuring created a 10-point gap versus the comparable measure.
| Metric | Value | Change |
|---|---|---|
| Net sales | €4.82B | +8% |
| AI & Cloud sales | €446M | +105% CC |
| AI & Cloud orders | ~€2.8B | Pipeline |
| Comparable operating profit | €434M | 9.0% margin |
| Reported operating result | −€50M | −1.0% margin |
| Restructuring charges | €390M | Cash burden |
| 2026 comparable operating profit | €2.1B–€2.6B |
| Management target | Somewhat above midpoint |
| Net cash + interest-bearing investments | €2.78B |
| Working-capital outflow | ~€1.15B |
| Trailing P/E screen | ~72× |
| Communications-industry average | ~34× |
Core test: AI revenue can support a rerating only if operating gains reach free cash flow.
Sources: Nokia Q2 and half-year 2026 report; MarketWatch price and volume; published valuation screen. Constant-currency growth is marked “CC.”
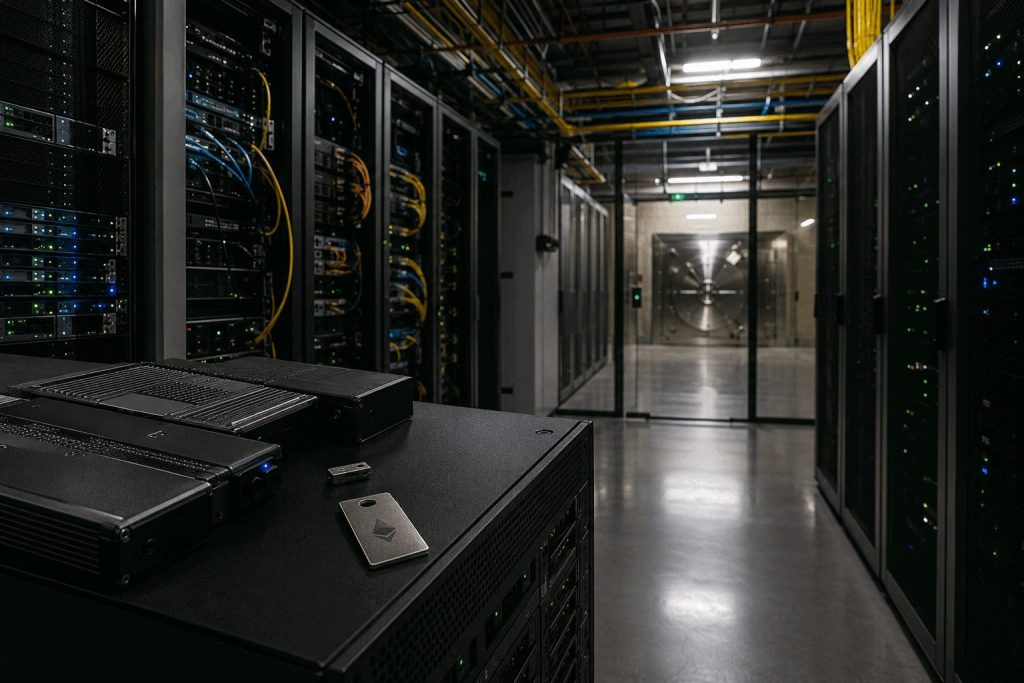
BitMine Immersion Technologies entered Monday's premarket after a 7.1% Friday decline. The more important move came after the close. Ether fell to about $1,625…
| 5.85M ETH | $9.50B |
| 210 BTC | $16.4M |
| Cash + marketable securities | $308M |
| Beast Industries stake | $180M |
| Eightco stake | $89M |
| Total estimate | $10.10B |
|---|
Simple mark-to-market estimate. It excludes liabilities, taxes, other balance-sheet items and changes after the disclosure date.
| Metric | Reported | Current-price estimate |
|---|---|---|
| Staked ETH | 5.067M | 5.067M |
| 7-day annualized yield | 2.67% | 2.67% |
| Annualized revenue | ~$330M | ~$220M |
| Share of ETH staked | 87% | 87% |
Core question: can MAVAN and treasury execution justify a 30% premium after Ether's weekend reset?
Sources: BitMine August 24 release; MarketWatch/FactSet; live crypto quotes. Estimates use BMNR market capitalization of $13.13B, ETH at $1,624.95 and BTC at $78,117.
Shares of American Airlines Group Inc. dropped 0.6% on Friday, with investors considering record revenue versus a sharp decline in profit due to higher…
| Financial signal | Current | Context |
|---|---|---|
| Adjusted EPS | $0.15 | Consensus cited: $0.03 |
| Fuel cost increase | >$2.2bn | Nearly half offset by demand |
| FY adjusted EPS guide | −$0.65 to +$0.65 | Midpoint: $0.00 |
| Q3 capacity growth | 3%–5% | Reduced operating cushion |
| Analyst target | $18.50 average | $10–$25 range |
Only 0.4 cents of each revenue dollar reached GAAP net income. The 2025 comparison was roughly 4.2 cents.
Nu Holdings Ltd. lost 3.9% on Friday, with investors focusing on its all-time high profit alongside an uptick in late-stage delinquencies. Shares finished at…
Early arrears improved, but late-stage NPLs rose 35 basis points sequentially.
| Metric | Q2 2026 | Comparison |
|---|---|---|
| Net income | $1.06B | +17% QoQ |
| Gross revenue | $5.88B | +39% YoY |
| Risk-adjusted NIM | 12.4% | +290 bps QoQ |
| Credit portfolio | $39.4B | +37% YoY |
| Cost of credit | $1.69B | Lower QoQ |
| ROE | 33% | Record quarter |
| Activity rate | 83.5% |
| Monthly ARPAC | ~$17 |
| Efficiency ratio | 19.5% |
| Deposit cost | 88% of interbank rates |
Sept. 14–15: Brazil Copom policy meeting. Rate direction affects funding, loan demand and credit performance.
Nov. 12: scheduled Q3 results. Watch 90+ day NPLs, provisions, risk-adjusted NIM and efficiency.
Late-stage defaults may lift provisions. Faster unsecured lending can amplify losses. Currency weakness changes reported dollar results. Mexico, Colombia and U.S. expansion can raise costs before revenue scales.
Ondas Inc. ended Friday down 9.71% at $7.90. Volume totaled 69.97 million shares, representing roughly 81% of the company's 65-day average.
| June 30 cash + restricted cash + short-term investments | $1.4B |
|---|---|
| Q3 cash used for DZYNE and Cyberhawk | ≈$325M |
| Modeled remainder before other flows | ≈$1.08B |
| Execution checkpoint | Current evidence | What changes the thesis |
|---|---|---|
| Q3 revenue | $140M–$155M guide | Delivery timing and mix |
| Margins | 50.4% adjusted gross margin in Q2 | Operating leverage must offset integration costs |
| Profitability | Platform target: Q4 2026 | Sequential EBITDA improvement |
| M&A | Aran: ≈$33M for ≈$26M expected 2026 sales | Q3 closing and integration |
Humana Inc. fell 1.79% Friday as investors weighed a 2027 Medicare Advantage pullback affecting about 600,000 members. That total represents roughly 8% of its…
| 2Q adjusted EPS | $7.61 |
| FY26 adjusted EPS guide | ≥$9.00 |
| FY26 GAAP EPS guide | ≥$6.52 |
| 2Q Insurance benefit ratio | 91.2% |
| FY26 benefit-ratio guide | 92.75% ±25 bp |
| FY26 individual MA growth | ≈25% |
UiPath Inc. heads into earnings week with a high level of short interest and expectations for a strong rebound priced into the stock. Shares…
A 39% monthly rally meets high short interest and a slower sequential ARR build.
| Metric | Q1 FY2027 | Next test |
|---|---|---|
| Revenue | $418M · +17% YoY | $395M–$400M Q2 guide |
| ARR | $1.901B · +12% | $1.929B–$1.934B |
| Net new ARR | $49M | ≈$30.5M implied midpoint |
| Net retention | 109% | Stabilization or reacceleration |
| GAAP operating income | $28M | Profit durability |
| Adjusted free cash flow | $130M | Cash conversion |
High short interest can accelerate covering on a beat or deepen a reversal after a miss.
ARR growth below 12%, net retention slipping from 109%, weaker federal or international demand, and poor conversion of agentic pilots into production contracts would challenge the rerating.
Banco Azteca provides operating proof: 300+ automations across 8,800+ processes. It does not disclose UiPath contract value.
SANTA CLARA, California, August 30, 2026, 23:05 – Marvell Technology stock declined 10.3%, erasing $22 billion from its market capitalization after the company said…
| Metric | Marvell | Reference |
|---|---|---|
| Forward P/E | 58.41× | Broadcom 32.15× |
| FY2027 EPS estimate | $4.20 | $4.04 three months ago |
| FY2028 EPS estimate | $6.69 | $6.13 three months ago |
| Ratings | 30 Buy · 7 Overweight | 6 Hold · 0 Sell |
| Target range | $211.97–$400 | Median $295 |
Beat: Revenue was $39M above prior guidance midpoint. Adjusted EPS of $0.94 topped the $0.93 consensus.
Guide: Q3 revenue midpoint implies about 15% sequential growth.
Disconnect: The Google agreement can support up to $120B of cumulative custom-product revenue, but the strongest contribution is not expected until fiscal 2029.
Friday's decline removed about $22.3B of equity value even as quarterly revenue grew 37%. The central question is timing: Marvell must convert its Google and other hyperscaler programs into revenue quickly enough to justify a forward earnings multiple roughly 82% above Broadcom's.