Dell Technologies gained 0.96% to $460.64 as of 10:50 EDT. Market participants are anticipating an approximately 10% swing following Tuesday’s earnings report.
·2 min read
Dell earnings pressure map
NYSE: DELL · Stock move · Market data: August 31, 2026, 10:50 EDT · Earnings: September 1 after close
Dell price
$460.64
▲ 0.96%
Options move
±10%
$414.58-$506.70
AI-server target
$60B
FY2027
Average target
$510.48
▲ 10.8% implied
Quarterly hurdle
Metric
Estimate
Growth
Q2 revenue
$45.19B
~+52%
Q2 adjusted EPS
$4.91
~+112%
Q1 revenue
$43.84B
+88%
Q1 adjusted EPS
$4.86
$2.94 prior estimate
Fiscal-2027 revenue mix test
AI servers as share of guided midpoint
$60B AI-server target
$167B Revenue midpoint
AI servers equal about 36% of midpoint revenue, increasing exposure to accelerator costs and large orders.
Hardware peer snapshot
Company
Price
Session
Market value
Trailing P/E
Dell
$460.64
+0.96%
$302.2B
36.7×
HPE
$52.33
+0.04%
$74.9B
48.0×
HP Inc.
$30.27
-0.84%
$28.1B
11.6×
Event and analyst range
Low target · options downside · current · average target · high target.
What the market needs
A revenue beat is largely expected. The stronger signal would be higher full-year profit guidance with stable margins. Misses on AI-server mix, customer timing or component costs could trigger the full implied downside.
Catalyst: fiscal Q2 results, September 1, 2026, after the closing bell.
Palantir Technologies dropped 0.45% to $185.45 as of 10:36 EDT. Palantir's stock lagged behind Nvidia even though the company posted quicker revenue growth.
Contract timing can distort quarterly growth. European resistance may limit international expansion. Palantir also needs sustained margin and cash-flow execution to support a 158.5× earnings multiple.
Near-term checkpoint: Q3 revenue versus the $2.160-$2.164B company range.
MediaTek Inc. finished down 1.51% ahead of Nvidia's $3.5 billion convertible-bond investment announcement. The statement came after Taiwan markets had closed, positioning Tuesday's trade…
·3 min read
MediaTek · TPE:2454 · Product/commercial catalyst
Nvidia capital meets MediaTek's AI scale-up
Market close: August 31, 2026, 13:30 CST · Deal announced after close · Dashboard timestamp: 22:35 CST / 10:35 EDT
Close
NT$3,925
−1.51%
Nvidia investment
$3.5B
Convertible bonds
Market value
NT$6.36T
≈ $197B
Trailing P/E
64.8×
Premium execution bar
Funding scale
Next financial signals
September 10
August sales
October 23
Next earnings estimate
Still missing
Coupon, maturity, conversion price
First price test
September 1 Taiwan session
Operating bridge
Measure
Value
Change
Q2 revenue
NT$152.18B
+1.2%
Q2 net income
NT$24.6B
−12.3%
Mobile-chip revenue
Not disclosed
−20%
July revenue
NT$48.48B
+12.16%
Jan–Jul revenue
NT$349.81B
+0.84%
Custom-AI ambition
2027 addressable market
$80B
Target share
15%–20%
Implied opportunity
$12B–$16B
Simple multiplication of company estimates. It is not revenue guidance.
Valuation and consensus
Metric
Latest
Read-through
52-week range
NT$1,130–4,970
Close is 21% below high
Year to date
+174.5%
AI rerating already substantial
Average target
NT$5,503
About 40% above close
Recommendations
23 Buy / 0 Sell
Strong Buy consensus
Sources: MediaTek and Nvidia joint release; MediaTek investor relations; Reuters; MarketWatch/Investing delayed market data. Currency conversion uses about NT$32.3 per U.S. dollar. All time-sensitive figures are stamped above.
U.S. futures lost ground in the second premarket hour, with fresh conflict in the Gulf region keeping crude prices over $90. The Nasdaq-100 saw…
·2 min read
U.S. premarket recovery snapshot
Oil risk pushed Nasdaq futures into the red
August 31, 2026 · 06:00 EDT
S&P 500 futures
−0.17%
7,708.50
Dow futures
−0.18%
53,489
Nasdaq-100 futures
−0.13%
29,454.50
Brent crude
$90.86
more than 3% above settlement
Futures: session versus last hour
Instrument
Session
05:00–06:00
S&P 500
−0.17%
−0.02%
Dow
−0.18%
−0.03%
Nasdaq-100
−0.13%
−0.19%
The Nasdaq reversed from +0.07% at 05:00 EDT. Levels are indicative futures snapshots.
Hourly direction
S&PDowNasdaq
Energy leadership
Company
Move
Channel
Halliburton
+2.27%
Services
Valero
+2.17%
Refining
Occidental
+1.79%
Upstream
Chevron
+1.58%
Integrated
Exxon Mobil
+1.30%
Integrated
Cross-asset read
Market
05:00
06:00
Brent
$90.40
$90.86
WTI
$85.51
$85.54
Signal: Brent extended its rise while technology futures weakened. The setup pointed to inflation pressure rather than broad risk capitulation.
What mattered next
Cash open
09:30
EDT
Breadth
N/A
premarket fragmentation
Primary catalyst
U.S.–Iran strikes
Hormuz shipping risk
Key risk
Headline reversal
thin liquidity
Historical recovery dashboard. Figures timestamped to approximately 06:00 EDT on August 31, 2026; last-hour changes calculated from verified 05:00 and 06:00 snapshots.
NEW YORK, August 31, 2026, 10:00 – U.S. stocks dropped in morning trading as surging oil prices weighed on markets, with investors closely monitoring…
·3 min read
U.S. REGULAR SESSION · 10:00 EDT
Oil shock pulls stocks lower
August 31, 2026 · Available interval: 09:30–10:00 ET
S&P 500
-0.3%
Opening move: -0.18%.
Dow
-0.5%
Weakest major index.
Nasdaq
-0.1%
Semis cushioned software losses.
WTI crude
$86.40
+3.6% on Hormuz risk.
Session-to-date vs available interval
Index
At open
At 10:00
09:30–10:00
Dow
-0.18%
-0.5%
-0.5%
S&P 500
-0.18%
-0.3%
-0.3%
Nasdaq
-0.17%
-0.1%
-0.1%
The session was 30 minutes old, so the available interval replaces a full preceding hour.
Cross-asset pressure
Brent
>$90
+2.5%
WTI
$86.40
+3.6%
10-year Treasury
~4.75%
Higher
VIX
~15.3
+6%
Energy Select SPDR
$64.15
+2.35%
NYSE breadth
Decliners led by 1.22 to 1.
Movers
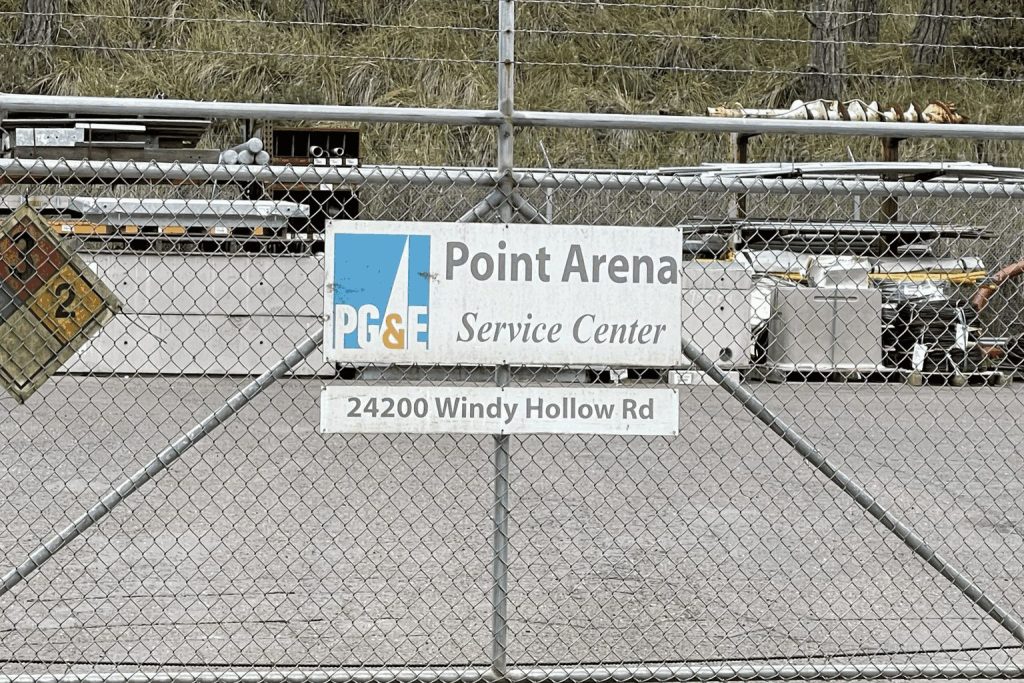
PG&E
-19%
Wildfire liability
Aon
-5%
USI deal report
BioMarin
+5%
Royalty agreement
IREN
+2.7%
Post-results rebound
Intel
+1%
Semiconductor rebound
Market read
The opening decline broadened as oil crossed $86 and the 10-year yield approached 4.75%. Energy gained 2.35%, but decliners still outnumbered advancers. The market is treating renewed Hormuz conflict as an inflation event, not only a geopolitical headline.
Next-hour risks
Watch tanker-flow headlines, WTI, the 10-year yield and PG&E contagion across utilities. Lower oil or yields would help technology; another spike would favor energy and deepen pressure on consumers.
IREN Limited shares climbed 2.7% to $36.42 as of 10:00 EDT Monday. The rise comes after a 12.5% drop in response to earnings on…
·3 min read
IREN LIMITED · NASDAQ: IREN
Contracted AI growth meets execution risk
Market data: August 31, 2026, 10:00 EDT · Financials: FY2026
Price
$36.42
+2.74%
Friday: -12.53%.
Market value
$14.4B
Approximation using 394.1M shares.
AI Cloud revenue
$128.8M
+685% in FY2026.
Short interest
30.61%
Of float, August 14.
Revenue mix transition
Metric
FY25
FY26
Move
AI Cloud
$16.4M
$128.8M
+685%
Bitcoin mining
$484.6M
$578.2M
+19%
Total revenue
$501.0M
$707.0M
+41%
Adjusted EBITDA
$269.7M
$245.7M
-9%
AI run-rate bridge
Market setup
Monday 10:00 price
$36.42
Friday volume
89.9M
65-day average
45.6M
52-week high
$76.87
Average analyst target
$81.57
Analyst target upside
124%
Financial quality
FY2026 net loss
-$702.6M
Non-cash impairments/transition
$638.8M
Adjusted EBITDA
$245.7M
Adjusted EBITDA margin
34.8%
Price / FY2026 revenue
20.3×
Contracted share of target ARR
~85%
Investor bridge
IREN’s AI Cloud revenue grew almost eightfold, and contracted awards support a year-end run-rate target above $4 billion. The stock still prices in a large delivery gap: current annual revenue is $707 million, adjusted EBITDA fell 9%, and construction plus GPU financing must precede revenue recognition.
Risk monitor
Watch customer acceptance, construction milestones, GPU deliveries, financing costs, Bitcoin-linked cash flow and margin conversion. With 30.6% short interest, failed milestones can produce outsized downside.
DEARBORN, Michigan, August 31, 2026, 09:36 — Ford shares slipped 0.5% on Tuesday as the automaker reported adjusted earnings of $2.5 billion, offset by…
·3 min read
FORD MOTOR COMPANY · NYSE: F
Profit quality, not the headline loss
Investor dashboard · Market data through August 31, 2026, 09:36 EDT · Financials through Q2 2026
Key funding source for investment and the regular dividend.
Valuation and financial signals
FY2026 EPS estimate
$1.85
Price / estimated EPS
7.5×
Dividend yield
4.32%
Cash and securities
$31.6B
Company debt, ex-Credit
$23.6B
Friday volume / 65-day average
75%
Investor bridge
Ford’s adjusted EBIT rose 17% even as revenue fell 4%. Blue pricing and a smaller Model e loss did the heavy lifting, while Ford Pro slipped. The $1.33 billion GAAP loss chiefly reflects strategic reversals already captured in $4.18 billion of special items. The shares trade at about 7.5 times estimated 2026 earnings, but the discount will persist unless cash conversion and Pro margins recover.
Watch: Pro marginWatch: Model e lossWatch: warranty costsWatch: tariffs
Risk monitor
Tariffs, pricing pressure, warranty expense and supply disruption can erase the margin gain. More EV cancellations could trigger further charges. Higher delinquencies or used-vehicle weakness would pressure Ford Credit.
U.S. equity futures were mixed at the 04:00 ET premarket threshold as oil above $90 challenged hopes for easier policy.
·2 min read
U.S. premarket dashboard
Snapshot: August 31, 2026, 03:56 ET • Defined session age at report: 1 minute
Dow futures
53,483.5
−0.14%
S&P futures
7,700.0
−0.15%
Nasdaq-100
29,458.9
+0.09%
Russell 2000
2,975.3
+0.10%
Cross-asset
Level
Change
Signal
Brent
$90.21
+4.75%
Inflation and margin pressure
WTI
$85.25
+2.22%
Energy leads; transport lags
VIX futures
17.05
+0.68%
Modest risk premium
U.S. 2-year yield
4.325%
−2.5 bp
Policy sensitivity remains high
U.S. 10-year yield
4.705%
−1.7 bp
Restrictive long rate
Main catalyst: Brent above $90. Higher energy costs threaten transport margins and complicate the rate outlook.
Data limitation: 04:00–04:01 ET was the exact available session interval. Consolidated breadth, volume, sector ranks and a stable stock-mover list were not meaningful after one minute; prior-60-minute interval changes were unavailable.
GameStop Corp. gained 3.19% to $18.44 in premarket trading on Monday. The company substituted a portion of its scheduled all-stock debt swap with a…
·3 min read
GameStop investor dashboard
NYSE: GME · preliminary Q2 and premarket repricing
Market: Aug. 31, 2026, 08:00 ET Fundamentals: company update, Aug. 31
Premarket price
$18.44
+3.19%
Friday close
$17.87
−2.08%
Fixed new shares
55.5M
12.4% of current count
Cash settlement
$358.4M
7.1% of projected cash
Why the stock moved
Estimated 20.4 million-share reduction, equal to 4.5% of the existing count.
$1.4B exchange consideration
CashShares at $18.44
Cash
$358.4M
55.5M shares at $18.44
$1.023B
Remaining notes after close
$2.8B
Preliminary Q2: growth versus quality
Metric
Midpoint
YoY
Sales
$790M
−18.7%
Operating income
$160M
+141.0%
Net income
$300M
+77.9%
Cash & securities
$5.06B
−41.8%
Profit bridge
Item
Amount
% of net income
eBay-related gains
+$238M
79.3%
Digital-asset loss
−$75M
−25.0%
Net disclosed investment effect
+$163M
54.3%
Investor read: The amendment reduces dilution, but does not remove it. More than half of preliminary net income comes from disclosed investment marks, while sales contract. Full Q2 results are due September 8.
Risks: Preliminary figures can change; eBay and digital assets remain volatile; 55.5 million new shares expand supply; store closures and the France exit shrink revenue.
PG&E Corporation shares dropped 15% to $14.14 in premarket trade on Monday after California legislators moved forward with Senate Bill 492, which did not…
·3 min read
PG&E investor dashboard
Premarket snapshot: August 31, 2026, 07:26 ET · NYSE: PCG
Premarket price
$14.14
Premarket move
−15.0%
Two-session move
−21.2%
2026 core P/E
8.6×
Repricing timeline
*Thursday price is implied from Friday's $16.61 close and 7.44% decline.
Earnings bridge
Measure
2025
2026
Growth
Q2 GAAP EPS
$0.24
$0.33
+37.5%
Q2 core EPS
$0.31
$0.40
+29.0%
First-half GAAP EPS
$0.51
$0.72
+41.2%
First-half core EPS
$0.64
$0.83
+29.7%
2026 guidance
Core EPS range
$1.64–$1.66
Midpoint earned in H1
50.3%
First-half core EPS: $0.83. Guidance reaffirmed July 23.
Valuation reset
Marker
Price/target
Upside
Core P/E
Premarket
$14.14
—
8.6×
Mizuho revised target
$16.00
+13.2%
9.7×
17-analyst average*
$22.22
+57.1%
13.5×
Consensus range*
$19–$25
+34% to +77%
11.5×–15.2×
*Consensus snapshot may not yet include Mizuho's August 31 downgrade.
Capital and safety signals
Utility debt financing, H1
$4.4bn
Underground lines built, Q2
37 miles
Strengthened/covered lines, Q2
100 miles
Wildfire Fund utility commitments
$10.5bn
What moves the stock next
Policy: insurer subrogation rights and any renewed Sacramento negotiations.
Execution: wildfire mitigation, financing costs and rate recovery.
Tail risk: new claims, penalties or safety-certification setbacks.
Oil futures surged close to 4% on Monday, lifted by fresh U.S.-Iran clashes that put Gulf shipping routes at risk. Front-month West Texas Intermediate…
·3 min read
Oil futures • investor dashboard
Prompt supply risk, discounted later barrels
Brent and NYMEX WTI • Strait of Hormuz risk map
Delayed futures snapshot: August 31, 2026, 06:14 ET Forecasts: EIA August STEO and Reuters August survey Prepared: August 31, 2026, 07:44 ET
WTI front month
$86.56
+$3.16 • +3.79%
Brent continuous
$91.35
+$3.25 • +3.69%
Brent-WTI spread
$4.79
5.5% above WTI
Oct–Jun backwardation
$12.09
16.2% prompt premium
WTI futures curve
A downward-sloping curve concentrates the risk premium in immediately deliverable barrels.
Forecast versus market
Brent now
$91.35
Reuters 2026 avg.
$85.08
EIA 3Q26 avg.
$85
EIA 4Q26 avg.
$78
EIA 2027 avg.
$69
Physical balance
Indicator
Latest estimate
Signal
July production shut-ins
5.5M b/d
Tight
2Q26 inventory change
-4.2M b/d
Tight
3Q26 inventory forecast
-3.8M b/d
Tight
OPEC+ September increase
+188K b/d
Partial offset
China July imports
-24.3% YoY
Demand drag
Transmission map
Key test: physical flows. A lasting tanker blockage or damaged loading terminal widens backwardation. Continued passage through Hormuz removes the premium faster than headlines alone.
Higher oil → inflation pressureHigher oil → airline and freight costsBackwardation → inventory draw incentiveWeak China → capped upside
Scenario watch
Escalation
Tanker or terminal disruption; prompt contracts rise fastest.
Base case
Restricted flows persist; Brent holds around the high $80s.
Further Chinese weakness compresses the curve despite supply risk.
Sources: MarketWatch delayed futures data; Reuters August 31 poll and conflict report; U.S. Energy Information Administration August Short-Term Energy Outlook; The Wall Street Journal. Prices are dollars per barrel. Figures are rounded. Not investment advice.
MARA Holdings, Inc. dropped 10.11% on Friday after Bitcoin dipped under $80,000. The fall wiped around $464 million from the company's market capitalization.
·3 min read
MARA • investor dashboard
Bitcoin sensitivity meets AI capex
NASDAQ: MARA • Stock-move dashboard
Market data: August 28, 2026 close, 16:00 ET Bitcoin reference: August 28, 2026, 16:00 ET Fundamentals: quarter ended June 30, 2026
Friday close
$10.67
-$1.20 • -10.11%
Equity value erased
≈$464M
Estimated from market cap and price change
Trading volume
41.86M
89.5% of 46.79M average
Market cap
$4.12B
≈1.45× marked Bitcoin value
Market value versus Bitcoin treasury
Market cap
$4.12B
35,577 BTC
$2.84B
Residual
$1.29B
Residual includes cash, mining and power assets, AI optionality and liabilities; it is not a clean premium.
Price range and analyst targets
WSJ research range; $18 average target. Targets are not guarantees.
Quarterly operating snapshot
Metric
Q2 2026
YoY
Revenue
$174.9M
-27%
Net income
-$611.3M
vs. +$808.2M
Adjusted EBITDA
-$360.9M
vs. +$1.25B
Bitcoin produced
2,422
+3%
Energized hash rate
70.3 EH/s
+22%
Capital bridge
Bitcoin funds the pivot. MARA sold 2,213 BTC during Q2 and pledged 18,750 BTC after quarter-end. The strategy protects upside exposure, but raises collateral and liquidity sensitivity when Bitcoin falls.
Long Ridge: 505 MWDeal value: $1.5B incl. debtExpected annualized adj. earnings: $144MStarwood: ~1 GW near termPathway: >2.5 GW
What matters next
Bitcoin
Stabilization above $80,000 would support treasury value and mining revenue.
AI leasing
Signed tenants would turn power capacity into contracted cash flow.
Long Ridge
Closing, financing and realized earnings determine deal accretion.
Collateral
Lower Bitcoin raises borrowing and liquidity risk.
Sources: Yahoo Finance market data; MARA Q2 2026 results and corporate announcements; The Wall Street Journal analyst research. Calculations use MARA's August 28 close and Bitcoin at $79,741. Figures are rounded. Not investment advice.
SoFi Technologies, Inc. saw its market value drop by roughly $1.45 billion on Friday. The stock declined 5.84% to end at $18.06, marking its…
·2 min read
SoFi Technologies investor dashboard
NASDAQ: SOFI · latest completed session: August 28, 2026, 16:00 ET
Premarket watch · Aug. 31, 07:09 ET
Close
$18.06
−5.84% Friday
Volume
45.5m
62% of 73.3m average
Market value
$23.3bn
≈$1.45bn erased Friday
Earnings multiple
40.4×
Premium requires execution
Recent closes
Friday's decline returned the shares to $18.06 after a three-session climb. The move came without a new SoFi filing, increasing the importance of valuation and macro sensitivity.
Valuation and sentiment
Measure
Reading
2026 guided revenue midpoint
$4.80bn
Market cap / guided revenue
4.9×
Consensus target
$22.42
Implied upside
24.1%
Consensus rating
Hold
Coverage mix: 8 Buy, 10 Hold and 3 Sell ratings. Piper Sandler's recent Overweight initiation carries a $22 target.
Second-quarter operating scorecard
Metric
Q2 2026
YoY
GAAP revenue
$1.219bn
+43%
Net income
$156.6m
+61%
Adjusted EBITDA
$357.8m
+44%
Members
15.8m
+35%
Products
24.4m
+42%
Technology accounts
134.8m
−16%
Investor bridge
Cross-buy
51%
of new products opened by existing members
Fee-based mix
39%
$472.3m of quarterly revenue
What matters next: loan demand, deposit repricing, credit losses and Galileo stabilization. CFO Chris Lapointe is due at Goldman Sachs on September 8.
Sources: SoFi Q2 2026 results and investor relations; Yahoo Finance; MarketBeat; Barron's. Price and volume as of Aug. 28, 2026, 16:00 ET. Analyst data accessed Aug. 31, 2026, 07:09 ET. Estimates and calculated ratios are labeled.
Plug Power shares fell 3.52% on Friday as rising Treasury yields pressured rate-sensitive clean-energy stocks. The stock closed at $2.19 on 46.6 million shares.
·2 min read
NASDAQ: PLUG
Plug Power
Market data: Aug. 28, 2026 close, ET Financial data: quarter ended June 30, 2026
Friday close
$2.19
-3.52%
Volume
46.6M
81% of 3-month average
Market value
$3.06B
Loss-making equity
Analyst target
$3.49
Hold consensus
Cash runway bridge
Quarterly net cash use equaled about 38% of unrestricted quarter-end cash. Asset transactions are expected to add $80 million.
Operating reset
Metric
Q2 2026
Change
Revenue
$178M
+9% sequential
Gross margin
Near 0%
From -31% YoY
Operating expense
$62M
-50% YoY
GAAP EPS
-$0.14
From -$0.20
Net cash use
$61M
-58% sequential
Commercial signals
GenDrive deployments
1,666
+125% YoY
Service revenue
$30M
+82% YoY
Service margin
+27%
Positive
Fuel revenue
$39M
+15% YoY
Fuel gross margin
-48%
Still the drag
What must happen next
Management targets 15%–16% revenue growth and positive Q4 EBITDAS. The market’s harder test is sustained cash generation.
Average analyst target implies roughly 59% upside, but estimates span $0.75 to $7.00.