Nu Holdings Ltd. slipped 3.90% on Friday, placing second among Yahoo Finance’s most-active shares. The stock finished the session at $14.30, after reaching a…
·2 min read
NYSE: NU · credit quality vs growth
Nu’s profit record meets a bad-loan test
Market close: Aug. 28, 2026 · 16:00 EDT Checked: Aug. 29, 2026 · 09:35 EDT
Close
$14.30
▼ 3.90%
Volume
79.14M
103% of 65-day average
Market cap
$69.08B
≈$2.8B erased Friday
Trailing P/E
19.46×
EPS: $0.73
Growth versus credit risk
Early delinquencies improved, but loans overdue more than 90 days rose to 6.9%. The stock’s 3.9% decline shows that investors are pricing the late-stage credit signal.
Customer engine
Customers
139M
Q2 additions
≈4M
Activity rate
83.5%
ARPAC
≈$17
Brazil customers
≈118M
Mexico customers
≈16M
Financial scorecard · Q2 2026
Measure
Latest
Change
Signal
Gross revenue
$5.9B
+39% YoY
Growth
Net income
$1.1B
+49% YoY
Record
ROE
33%
Record
High returns
Net interest margin
22.9%
+180bp QoQ
Pricing power
Risk-adjusted NIM
12.4%
+290bp QoQ
Credit-normalized gain
Credit portfolio
$39.4B
+37% YoY
Faster than deposits
Deposits
$45.3B
+18% YoY
Funding buffer
Asset quality
4.8%
15–90 day NPL · −16bp
6.9%
90+ day NPL · +35bp
Cost of credit
$1.7B
−9% QoQ
Friday tape
Security
Move
Context
SoFi (SOFI)
−5.84%
Digital-lender pressure
Nu Holdings (NU)
−3.90%
Record profit, credit watch
S&P 500
−0.25%
Broad market decline
NU after-hours
+0.14%
$14.32 at 19:59 EDT
Investor bridge: Nu combines 39% revenue growth, 33% ROE and a 19.5× trailing P/E. The key question is whether 37% credit growth can remain profitable as 90-day delinquencies rise.
Risk watch: Mexico’s bank conversion could accelerate deposits and monetization. Currency weakness, unsecured-credit expansion or continued migration into late delinquencies could pressure earnings quality.
Intel Corporation dropped 2.85% on Friday, topping Yahoo Finance’s most-active stocks. Shares finished at $89.47, having reached an intraday peak of $92.21.
·2 min read
NASDAQ: INTC · offering discount
Intel: growth meets dilution
Market close: Aug. 28, 2026 · 16:00 EDT Dashboard checked: Aug. 29, 2026 · 09:04 EDT
Close
$89.47
▼ 2.85% Friday
Volume
86.17M
≈ $7.7B turnover
Offer discount
−5.8%
$95 issue price
Net proceeds
$19.7B
≈ 122% of Q2 revenue
Price versus new-share issue
The market has erased the offering premium. New capital strengthens liquidity, but every project now carries a higher per-share return hurdle.
Capital math
New shares
210.53M
Estimated dilution
≈4.1%
Q2 capex
$2.65B
Proceeds / Q2 capex
7.4×
Est. equity value
≈$476B
Dilution and equity value use an estimated post-offering share count derived from Q2 diluted shares and the announced issuance.
Operating dashboard
Measure
Latest
YoY / guide
Signal
Q2 revenue
$16.1B
+25%
Strong
Data Center & AI
$6.3B
+59%
AI demand
Intel Foundry*
$5.8B
+31%
Includes internal sales
GAAP operating margin
11.1%
+35.8 pts
Major recovery
Operating cash flow
$7.0B
vs. $2.05B
Investment support
Q3 revenue guide
$15.8B–$16.8B
Midpoint +1% QoQ
Slower sequential pace
Implied valuation
≈59×
Price / annualized Q3 non-GAAP EPS guide
≈7.3×
Estimated equity value / annualized Q3 revenue midpoint
These are simple run-rate estimates, not consensus forecasts.
Friday semiconductor tape
Security
Move
Read-through
Marvell (MRVL)
−10.3%
Earnings and margin reset
Nvidia (NVDA)
−4.6%
Broad AI-hardware pressure
Intel (INTC)
−2.85%
Below offering price
Nasdaq Composite
−0.52%
Technology risk-off
S&P 500
−0.25%
Broad market decline
What investors are testing: Intel’s 25% revenue growth and 59% Data Center & AI growth now compete with roughly 4% dilution and heavy foundry investment. A sustained move above $95 would signal confidence that the new capital can earn attractive returns.
Risk watch: Better yields and AI demand could push results above guidance. Execution delays, weaker pricing or lower external foundry utilization could keep the shares below the issue price.
Oil prices recorded their steepest weekly retreat since early August, even as Iran claimed full control of the Strait of Hormuz. Traders focused instead…
·3 min read
Oil prices · physical flows vs risk premium
Hormuz rhetoric stayed hot. Crude cooled.
Futures close: Aug. 28, 2026 · 16:00 EDT Dashboard checked: Aug. 29, 2026 · 08:05 EDT
WTI settle
$83.40
▼ 4.2% this week
October Brent
$89.31
▼ 5.4% this week
Brent-WTI spread
$5.91
Per barrel risk premium
Gulf exports
15–16M
barrels/day estimated
Weekly price reset
Illustrative weekly path anchored to verified Friday settlements and weekly changes. Brent fell faster, but retained a $5.91 global-supply premium.
Physical-flow scoreboard
Current estimated exports
15–16 mb/d
Pre-conflict
22–24 mb/d
March trough
5–6 mb/d
Recovery is substantial, not complete. Shipping visibility remains imperfect.
FanDuel has extended its NFL sportsbook agreement while parent firm Flutter Entertainment plc readies an expensive effort to revive growth in the U.S. The…
·3 min read
NYSE: FLUT · FanDuel / NFL renewal
Access secured. Economics still on trial.
Market close: Aug. 28, 2026 · 16:00 EDT Dashboard checked: Aug. 29, 2026 · 07:05 EDT
FLUT close
$101.78
▲ 7.13% Friday
Volume
3.02M
1.03× 65-day average
2026 U.S. revenue guide
$7.40B
+6% implied year on year
2026 U.S. EBITDA guide
$760M
10.3% implied margin
Quarterly operating bridge
Q2 revenue -6%Q2 adjusted EBITDA -70%
Why the NFL deal matters
Rights retained
Use of NFL marks, retail and online sportsbook promotion, league-owned digital integration, and presence at the Super Bowl and NFL Draft.
Competitive change
Fanatics joins FanDuel and DraftKings as a third official sportsbook operator.
Missing number
Financial terms were not disclosed. Rights cost is therefore the key valuation gap.
FanDuel operating scoreboard
Measure
Q2 2026
YoY
Sportsbook handle
$11.96B
+2%
Net revenue margin
8.7%
-170 bps
Sportsbook revenue
$1.04B
-15%
Total U.S. revenue
$1.68B
-6%
Sales & marketing
$353M
+61%
Adjusted EBITDA
$119M
-70%
Investment and valuation lens
2026 momentum investment
$270M
Adjusted EBITDA cost; associated revenue effect about $385M
Historical FanDuel implied value
$31B
2025 Boyd stake transaction; not directly comparable with group equity value
FLUT market cap ≈ $17.7BMedian target $120Average target $135.26
Analyst expectations
Rating
Count
Buy
23
Overweight
2
Hold
9
Sell
1
FactSet consensus: Overweight. Median target implies about 18% upside from Friday's close. Q3 EPS consensus is $0.34, down from $0.85 one month earlier.
Catalyst calendar and sensitivities
Sep. 9: 2026 NFL season opener. Flutter says the one-week schedule delay trims about $75M revenue and $50M EBITDA.
Q3: Roughly 20% of annual U.S. revenue, with adjusted EBITDA expected near breakeven.
Nov. 18: Expected Q3 earnings date.
Hold ratePromotionsState taxesFanatics entryRights fees
Sources: NFL partnership announcement (Aug. 27, 2026); Flutter Q2 2026 results (Aug. 5, 2026); Flutter/Boyd transaction statement; FactSet/WSJ market data through Aug. 28, 2026. All company guidance is non-GAAP where stated and remains subject to sports outcomes, regulation and execution.
DraftKings Inc. rose 4.29% on Friday following a federal appeals court decision that reinforced the rights of states to regulate sports prediction markets. The…
·3 min read
NASDAQ: DKNG · legal moat vs promotion cost
DraftKings: the ruling rally meets a margin test
Market close: Aug. 28, 2026 · 16:00 EDT | Dashboard checked: Aug. 29, 2026 · 06:00 EDT
Ninth Circuit · 3–0
Close
$25.26
+4.29% · +$1.04
Volume
19.90M
1.64× listed average
Equity value added
≈$516M
496.45M shares × $1.04
Welcome offer
$200
40× qualifying $5 wager
Second-quarter operating bridge
Sports volume
$13.14B
Sports revenue
$891.9M
Marketing
+38.3%
Adj. EBITDA
$114.6M
Investor read: volume grew 14.5%, but sports revenue fell 10.6%. The legal ruling may protect distribution economics; it does not solve promotional intensity or customer-friendly results.
Promotion math$200 exceeds quarterly ARPMUP by 52%; retention must recover the subsidy.
Next markerNew Jersey appeal deadline: Sept. 3, 2026.
Sources: Ninth U.S. Circuit Court of Appeals opinion filed Aug. 28, 2026; DraftKings Q2 2026 SEC exhibit filed Aug. 6; Google Finance closing data; current offer terms reported by CBS Sports Aug. 28; Reuters legal reporting Aug. 28. Market figures are closing data, not live weekend quotes.
A U.S. judge permanently blocked the Pentagon's designation of Anthropic as a supply-chain risk. The ruling removes a major procurement threat as the private…
·2 min read
OTHER TREND · Anthropic v. Pentagon
Blacklist removed; procurement risk narrows
Federal ruling · August 28, 2026
14:45 PDT Court and company data snapshot
Contract at dispute
$200M
military AI award
Private valuation
$380B
February 2026
Funding round
$30B
Series G
Court result
Blocked
permanently
Decision map
Question
Result
Supply-chain designation
Unlawful, arbitrary
First Amendment
Retaliation found
Fifth Amendment
Due process denied
Government remedy
Rescind label and notices
Pentagon vendor choice
Still discretionary
Investor bridge
The $200 million contract is small relative to valuation. The material channel is distribution: a supply-chain label could have reached contractors, civilian agencies and enterprise partners.
Government accessEnterprise trustIPO riskModel policy
Transmission
Court rescinds blacklist
→
Partner eligibility improves
→
Revenue tail risk falls
→
Private valuation support
Watch: government appeal, the separate Washington case, Pentagon vendor substitutions and any revised federal AI-use terms.
Sources: Reuters and Associated Press ruling reports; public court record; EFF contract background. Figures current August 28, 2026, 14:45 PDT.
Search interest in “fool” rose as Motley Fool’s Stock Advisor performance claim approached a tenfold average return. The service’s official page showed 987% on…
·3 min read
Google trend: fool · performance-claim audit
Motley Fool Stock Advisor
Checked Aug. 29, 2026 · 04:11 ET Official returns through Aug. 29
Advertised average
+987%
All recommendations since 2002
Matched S&P 500
+215%
Same recommendation dates
Performance gap
772 pp
4.59× benchmark return
Annual list price
$199
$99 introductory offer
What the headline compares
The earlier trend snapshot cited 964%. The official page displayed 987% at 04:11 ET, showing how marked historical winners can move the headline.
Product economics
New recommendations2 monthly
Suggested portfolio$25K+
Suggested breadth50+ picks
List fee / $25K0.80%
Intro fee / $25K0.40%
Refund window30 days
Methodology: headline versus lived portfolio
Element
Published calculation
Investor account
Return unit
Each recommendation
Funded positions
Aggregation
Arithmetic average
Capital-weighted result
Start date
Each pick's close
Subscriber's trade
Dividends
Reinvested
Depends on execution
Friction
Headline omits personal taxes
Taxes and trading costs apply
Outlier effect
Nvidia recommendation+139,827%
Netflix recommendation+42,957%
Extraordinary early winners are genuine historical observations. They also exert disproportionate influence on the average and cannot be bought today at 2004–2005 prices.
Investor bridge
The 987% figure is evidence of a strong recommendation history, not a promise to a new subscriber. The decision test is whether a buyer can fund two picks monthly, maintain 50-plus positions and outperform a low-cost benchmark after fees, taxes and execution.
Best-case readPersistent selection skill survives a new market regime
Base disciplineMeasure the subscriber's funded portfolio, not the marketing average
Main risksOutlier dependence · growth concentration · future underperformance
Sources: Motley Fool Stock Advisor product page and support methodology, checked Aug. 29, 2026 at 04:11 ET; 2017 peer-reviewed Stock Advisor performance study. Prices, terms and return claims can change.
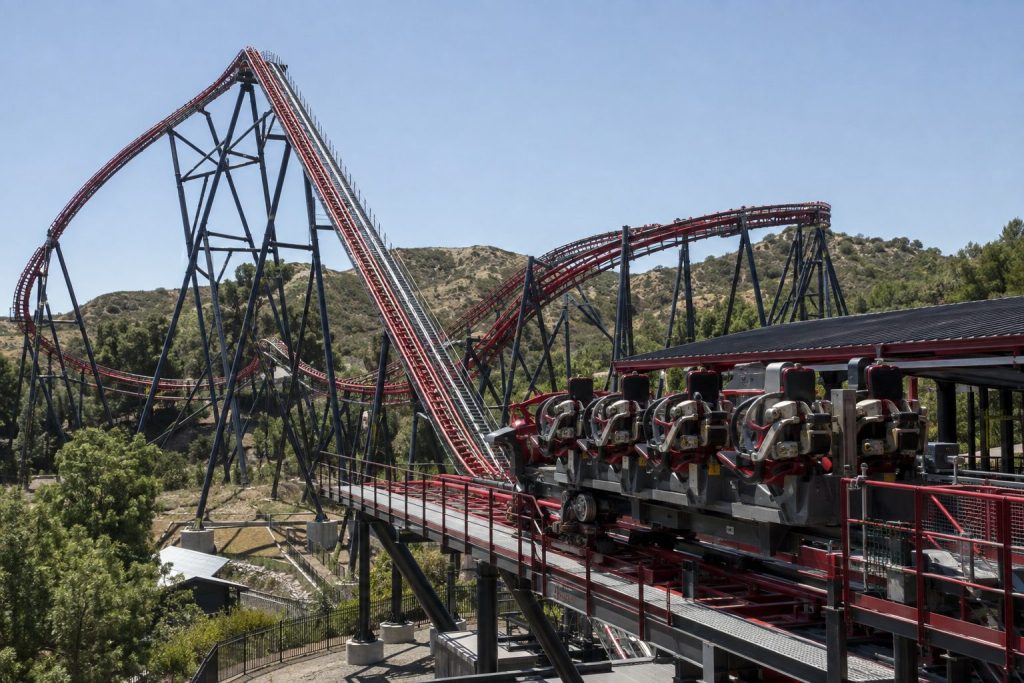
Six Flags Entertainment Corporation shares rose 1.75% on Friday even as scrutiny intensified around X2, the closed roller coaster linked to two severe brain…
·3 min read
FUN · X2 safety and leverage watch
Six Flags investor dashboard
Updated Aug. 29, 2026 · 04:03 ET Market data: Aug. 28 close
FUN close
$16.22
+1.75%
Market value
$1.65B
≈+$28M Friday
Net debt
$4.9B
3.0× equity value
X2 status
Closed
Since July 12
Operating recovery versus financial cushion
Reported Q2 figures for the period ended June 28, 2026. Net debt and liquidity as of that date.
Same-park signals
Revenue$864M · +2.4%
Adjusted EBITDA$249M · +7%
Attendance13.1M · +4%
Per-cap spending$62.88 · -1%
The recovery is real, but ride-level revenue is not disclosed. X2's direct financial contribution cannot be isolated.
X2 event line
July 5First rider suffered a subdural hematoma after riding X2, according to current reporting.July 11Second rider lost consciousness and remains in a coma.July 12X2 closed. Six Flags still listed the ride as closed at 04:03 ET on Aug. 29.Aug. 27Six Flags settled a separate wrongful-death case tied to a 2022 ride; terms were confidential.Aug. 28New reporting intensified scrutiny; FUN nevertheless closed 1.75% higher.
Analyst expectations
ConsensusOutperform
Average target$21.38
Implied upside31.8%
Target range$10–$30
Analysts14
Consensus checked Aug. 29, 2026 at 04:03 ET. Targets are opinions, not forecasts of guaranteed returns.
Investor bridge
Friday's gain added roughly $28 million to Six Flags' market capitalization. That is small beside $4.9 billion of net debt and a $203 million quarterly net loss. The key question is whether X2 remains an isolated operational issue or becomes a broader cost, inspection and attendance problem.
Contained caseLimited claims; ride reopens; park demand holds
Pressure caseLong closure; more claims; higher inspections and capex
What to watchX2 status · regulatory findings · Magic Mountain attendance
Sources: Six Flags X2 page and scheduled-closure page (status checked Aug. 29, 2026, 04:03 ET); Six Flags Q2 release (Aug. 6); Yahoo Finance historical data (Aug. 28 close and 1.65M volume); The Guardian (Aug. 28); MarketScreener consensus (checked Aug. 29). Stock figures reflect the latest completed U.S. session.
Nokia Oyj slipped 3.59% on Friday, wiping out roughly $2.1 billion in market capitalization. The stock ended the session at $10.21, breaking a three-day…
·3 min read
Nokia Oyj · NYSE: NOK
AI orders versus the cash-flow test
Market data: Aug. 28, 2026, 4:00 p.m. ET Fundamentals and consensus: Aug. 29, 2026, 3:00 a.m. ET
Close
$10.21
−3.59% Friday
Volume
50.6M
58% of 50-day average
Estimated value lost
$2.1B
Friday session
Analyst target
$15.02
47% implied upside
Order conversion bridge
Orders equal 58% of Q2 sales; management expects roughly half to convert within 12 months.
Profit quality
Comparable operating profit
€434M
+18% YoY
Comparable operating margin
9.0%
+70 bps
Reported operating result
−€50M
€390M restructuring charge
Free cash flow
−€732M
Q2 2026
Net cash
€2.78B
−€1.01B QoQ
Growth and valuation snapshot
Metric
Latest
Comparison
Investor read-through
Group sales
€4.82B
+9% constant currency
Broad growth returned
Network Infrastructure sales
€2.04B
+12% constant currency
Optical and IP led
AI & Cloud sales
€446M
+105% constant currency
9.3% of group sales
2026 comparable operating profit
€2.1B–€2.6B
Midpoint €2.35B
Orders equal 1.19× midpoint
Analyst mix
8 Buy / 2 Hold / 1 Sell
Targets $8.50–$21
Wide execution range
Friday peer tape
Company
Ticker
Move
Nokia
NOK
−3.59%
BlackBerry
BB
−5.66%
Motorola Solutions
MSI
−0.11%
Apple
AAPL
+1.63%
What changes the thesis
Oct. 22, 2026 Confirmed Q3 reporting date.
Upside: Faster order conversion, sustained Optical/IP growth and positive free cash flow.
Downside: Supply delays, continued restructuring outflows, customer concentration or currency pressure.
Sources: Nokia Q2 2026 earnings release and IR calendar; MarketWatch close and volume; Investing.com analyst consensus.
American Airlines Group generated roughly $866 million of stock turnover on Friday. Yet the shares moved only eight cents. The contrast shows investors rotating…
·2 min read
NASDAQ: AAL · turnover without conviction
American Airlines investor dashboard
Market close: Aug. 28, 2026 · 16:00 EDT Checked: Aug. 29, 2026 · 01:57 EDT
Close$13.64−0.58%
Volume63.51M61% of 65-day average
Dollar turnover$866M≈9.6% of market value
Market value$9.03B661.97M shares
Friday peer tape
Carrier
Move
Market cap
American
−0.58%
$9.03B
Southwest
−0.30%
$19.45B
Delta
−1.32%
$53.36B
United
−1.59%
$36.48B
Prices reflect the Aug. 28 close. American changed less than Delta and United despite unusually prominent share activity.
Q2 operating bridge
Revenue +16.3%
Premium PRASM +13.4%
Corporate revenue +26%
Capacity +5.4%
Revenue: $16.7B. GAAP net income: $71M. Adjusted EPS: $0.15.
Fuel and earnings test
Full-year adjusted EPS: −$0.65 to +$0.65. The range leaves valuation highly sensitive to fuel and pricing.
What comes next
Aug. 31 route salesViennaPortoReykjavikA321XLR
Seven new international routes go on sale Monday. Management expects third-quarter revenue growth of 16%–19%, but another $1.7B year-over-year fuel increase.
PayPal Holdings fell $7.81 on Friday, wiping out the takeover premium linked to speculation about a $53 billion offer.
·2 min read
NASDAQ: PYPL · takeover premium reset
PayPal: bid value versus standalone cash flow
Market close: Aug. 28, 2026 · 16:00 EDT Dashboard checked: Aug. 29, 2026 · 00:58 EDT
Close
$53.66
−12.71% · −$7.81
Volume
36.21M
Aug. 28 session
Reported bid
$60.50
12.7% above close
Forward P/E
10.85×
Industry median ≈15×
Price markers
Q2 operating scorecard
Revenue$8.682B · +5%
Total payment volume$486.4B · +10%
Active accounts439M · +0.3%
GAAP operating margin16.4% · −171bp
Adjusted free cash flow$1.832B · +179%
FY2026 guide
≈$5.38
Non-GAAP EPS
Close / guide ≈ 10.0×
Capital return
$1.5B
Q2 repurchases · ≈33M shares
TTM buybacks: $6.0B
Analyst view
Hold
47 ratings
34 Hold · 8 positive · 5 negative
Target range
$36–$72
Average $56.16
Only 4.7% above close
What matters next
Sep. 4$0.14 dividend record date
Sep. 25Dividend payment
Oct. 27Expected Q3 earnings
Investor bridge: the 12.7% selloff removed roughly the same premium that the abandoned $60.50 bid would now offer. Standalone support depends on converting 10% payment-volume growth into margin recovery.
Shares of FuboTV Inc. climbed 2.0% on Friday as an announced upgrade shifted ESPN and Fox Sports channels to 1080p resolution. This adjustment increases…
Market close: Aug. 28, 2026 · 16:00 EDT Dashboard checked: Aug. 28, 2026 · 21:58 EDT
Close
$10.30
+1.98%
Volume
813K
52% of 1.55M average
Market value
$1.12B
Google Finance
Analyst view
4 Buy
1 Hold · $17 mean target
Picture-quality jump
720p → 1080p
Reported for ESPN, ESPN2, FS1 and FS2.
Retention sensitivity
$7.4M
Estimated quarterly revenue preserved if 0.5% of 5.75M NA subscribers remain one extra quarter.
Operating bridge
Metric
Latest
Comparison
NA subscribers
5.75M
+2% YoY
NA revenue
$1.474B
~flat pro forma
Adjusted EBITDA
$19.1M
1.3% margin
Net loss
$(25.7)M
Improved from $(72.0)M pro forma
Cash and targets
Measure
Reading
Cash + restricted cash
$236.4M
FY2026 ending cash guide
≥$200M
Positive free cash flow
Expected FY2027
FY2028 adjusted EBITDA target
≥$300M
Sources: Fubo Q3 FY2026 release and SEC exhibit; Fubo pricing and 4K support; Google Finance; Cord Cutters News. The 0.5% retention case is an illustrative estimate, not company guidance. Monthly revenue run-rate uses quarter-end subscribers and includes advertising.






![UK Stock Market Today 29/08/2026 [UPDATE: 08:49 BST] [Weekly Recap + Week Ahead: Midcaps Lead Before Bailey and Gilt Auction]](https://ts2.tech/wp-content/uploads/2026/08/UK-market-dashboard-2026-08-29-0843-1024x683.jpg "UK Stock Market Today 29/08/2026 [UPDATE: 08:49 BST] [Weekly Recap + Week Ahead: Midcaps Lead Before Bailey and Gilt Auction]")