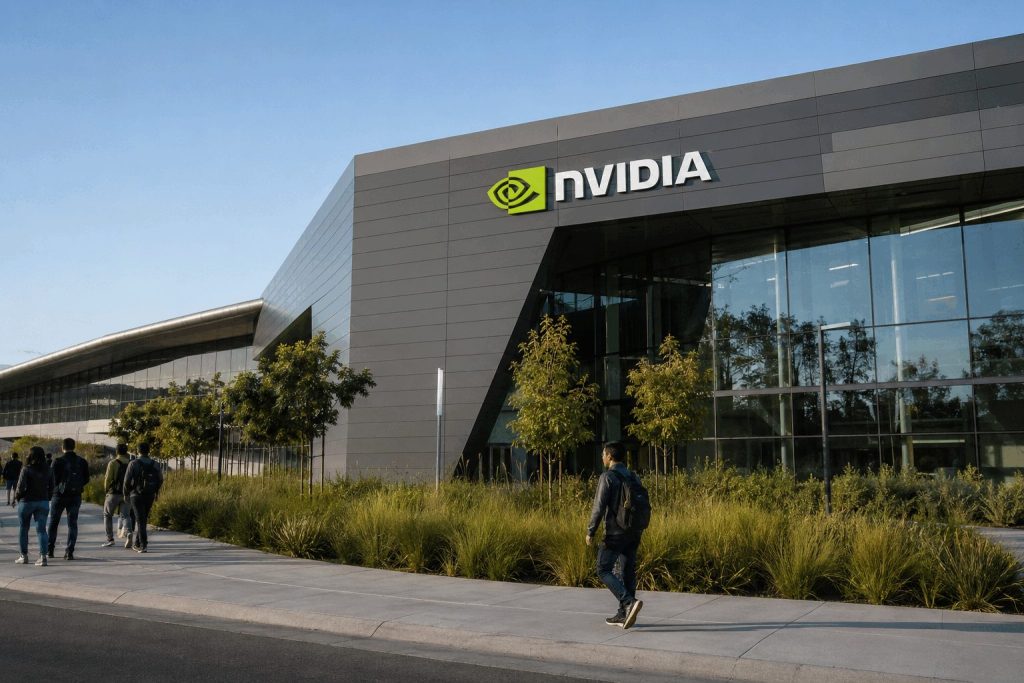
Nvidia Shares Fall 4.6%, Wiping Out $253 Billion as Margin Concerns Eclipse $108 Billion Forecast
SANTA CLARA, August 28, 2026, 17:50. Nvidia shares closed down 4.6%, losing $253 billion in market value, as investors focused on margin risks despite…
Market intelligence
Fast, evidence-led coverage of the companies and events moving global markets.
All coverage
SANTA CLARA, August 28, 2026, 17:50. Nvidia shares closed down 4.6%, losing $253 billion in market value, as investors focused on margin risks despite…

| Metric | Q1 FY27 | Q2 FY27 | Q3 guide |
|---|---|---|---|
| Revenue | $81.6B | $96.2B | $108.0B ±2% |
| Seq. growth | 20.0% | 17.9% | 12.2% |
| Gross margin | 74.9% | 75.0% | 74.0% ±0.5 pt |
| Data center | $75.2B | $89.0B | Not guided |
| Consensus | Buy |
| Ratings mix | 57 Buy · 7 Overweight · 2 Hold · 1 Sell |
| Median target | $316.60 · 45.5% above close |
| Q2 capital returned | $26.0B |
| Remaining repurchase authority | $99.0B |
Sources: NVIDIA Q2 FY2027 release; Reuters, Aug. 27–28, 2026; FactSet via WSJ/MarketWatch. Market figures are time-sensitive and stated as of the timestamps above.
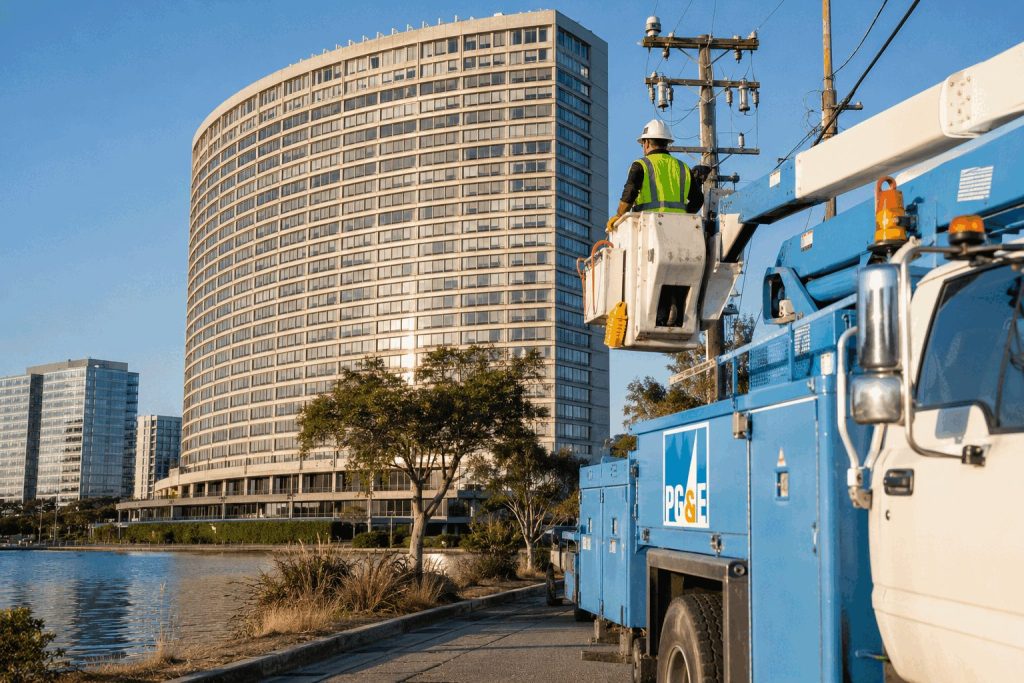
PG&E Corporation shares fell 7.52% on Friday, following news that California legislators rejected crucial wildfire-liability protections requested by utilities. The stock ended the session…
Market data: August 28, 2026, 16:55 EDT · Financials: Q2 2026 / trailing twelve months
California-focused utilities underperformed as liability protection weakened.
| Metric | Figure | Investor signal |
|---|---|---|
| Q2 revenue | $5.90B | Regulated scale |
| Q2 net income | $733M | 12.42% margin |
| Trailing revenue | $25.84B | +5.3% reported |
| Trailing net income | $3.06B | 11.83% margin |
| Levered free cash flow | −$6.15B | Capital intensity |
| Cash | $972M | Limited versus system needs |
| Proposal | Legislative response | Investor channel |
|---|---|---|
| End insurer subrogation | Opposed | Claim exposure preserved |
| Cap some pain-and-suffering awards | Opposed | Future damages remain broader |
| Limit local-government recovery | Opposed | Infrastructure claims remain |
| Restrict CEO bonuses / raise safety fines | Broad agreement | Governance and cost pressure |
| Wildfire fund | $21B original size | Half shareholder-funded |
Average target implies 36.9% upside from Friday's close. Latest displayed rating: Morgan Stanley Equal-Weight, $22 target, August 21, 2026.
| Legislative session deadline | August 31, 2026 |
| Next estimated earnings date | October 22, 2026 |
| Forward dividend | $0.20 / 1.11% |
| Debt-to-equity | 189.45% |
| One-year stock return | +11.91% |
Amazon.com Inc. gained 3.97% on Friday. The move added roughly $109.8 billion to its equity value.
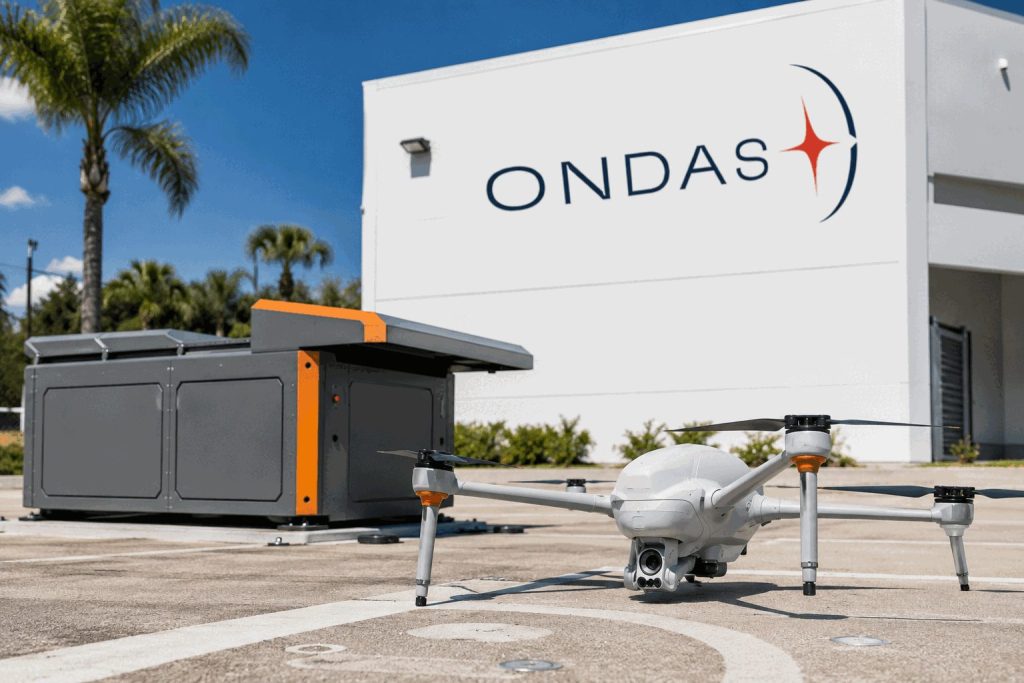
WEST PALM BEACH, Florida, August 28, 2026, 16:55. Ondas shares slid 9.6% after a prospectus outlined plans to resell up to 6.07 million shares,…
Market data: August 28, 2026, 16:30 EDT · Financials: Q2 ended June 30, 2026
The registered block is only 8.7% of Friday's volume, but sales may occur over time.
| Metric | Q2 / outlook | Signal |
|---|---|---|
| Revenue | $83.8M | +1,236% YoY |
| Backlog | $757M | 9.0× Q2 revenue |
| Q3 guidance | $140M–$155M | 67%–85% above Q2 |
| FY2026 guidance | $525M–$550M | Acquisition-led scale |
| Adjusted EBITDA | −$50.6M | Loss widened |
| Transaction | Consideration | Resale control |
|---|---|---|
| Omnisys | ≈$196.6M, largely stock | 15% of recent average daily volume |
| Indo | $5.66M cash + 5.493M shares | 10% of recent average daily volume |
| Indo earn-out | Up to $140M in stock | Future dilution exposure |
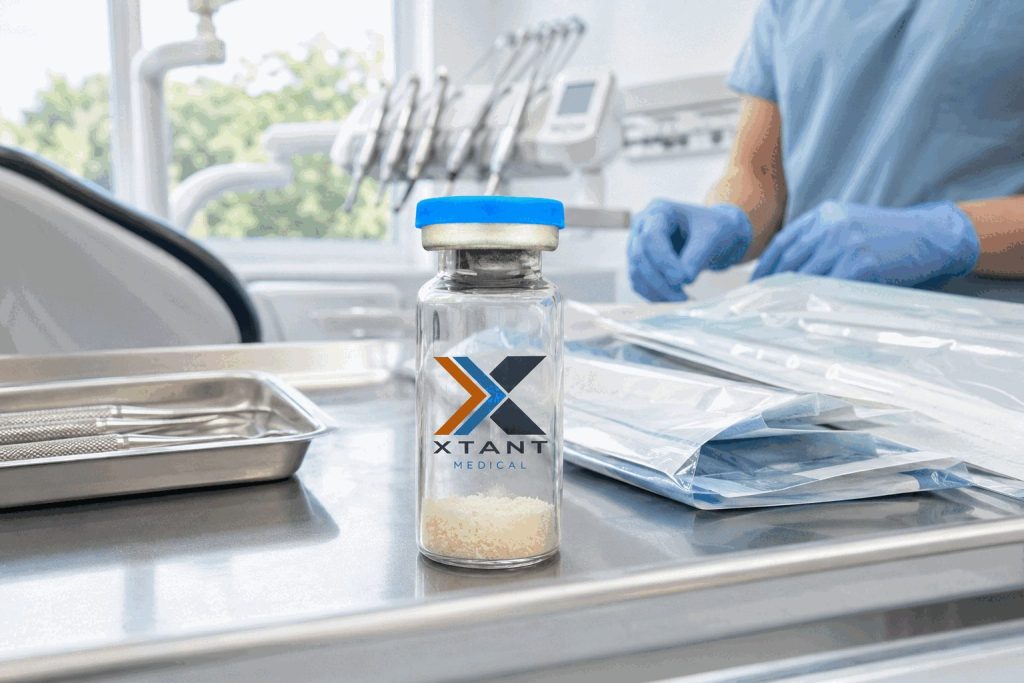
BELGRADE, Montana, August 28, 2026, 14:45. Xtant Medical stock advanced 16% after BioHorizons agreed to introduce the Prolifica line to its dental sales channel,…
BioHorizons opens a new channel. Contract economics remain private.
Xtant: developer, processor and manufacturer. BioHorizons: exclusive U.S./Canada dental and oral-maxillofacial distributor. Brand: Prolifica. Status: available now.
Price, royalties, minimum orders and initial stocking volumes were not disclosed.
| Metric | Q2 2026 | YoY |
|---|---|---|
| Revenue | $23.0m | −35% |
| Gross margin | 57.9% | −10.7 pts |
| Net result | −$9.4m | vs +$3.6m |
| Adjusted EBITDA | −$2.7m | vs +$6.9m |
| Company | Price | Day | Market value | Read-through |
|---|---|---|---|---|
| Xtant (XTNT) | $0.384 | +16.36% | $53.9m | Direct product upside |
| Henry Schein (HSIC) | $89.52 | −0.85% | $10.24bn | BioHorizons parent |
| Orthofix (OFIX) | $9.70 | +0.73% | $396.8m | Orthobiologics peer |
| Globus Medical (GMED) | $82.97 | +0.52% | $11.40bn | Device peer |
Initial purchase orders; recognized Prolifica revenue; repeat clinician orders; disclosed gross-margin contribution; evidence that dental demand offsets weaker core biologics sales.
Economics: private terms. Adoption: no volume forecast. Liquidity: debt exceeds cash. Trading: micro-cap volatility and exceptional turnover.
The BioHorizons partnership can extend Xtant into a new clinical market without duplicating a dental sales network. The $7.6 million equity-value gain is smaller than one quarter of revenue but large beside available liquidity. Investors now need orders and margin data to convert channel access into a cash-flow case.
Sources: Xtant partnership announcement; Xtant Q2 results; StockAnalysis; Google Finance. Historical data and management guidance, not investment advice.
DraftKings Inc. shares climbed 4.23% on Friday after the NFL renewed its official sportsbook partnership. The stock closed at $25.26 on 19.82 million shares.
League access is preserved. Fanatics raises the customer-acquisition stakes.
NFL deal value was not disclosed. Bars compare scale, not identical accounting measures.
| Metric | Result | YoY |
|---|---|---|
| Revenue | $1.443bn | −4.6% |
| Sports volume | $13.1bn | +15% |
| Monthly unique payers | 3.6m | +9% |
| Revenue per payer | $132 | −13% |
| Adjusted EBITDA | $114.6m | −61.9% |
| Company | Price | Day | Volume | New NFL role |
|---|---|---|---|---|
| DraftKings (NASDAQ: DKNG) | $25.26 | +4.23% | 19.82m | Sportsbook + DFS |
| Flutter/FanDuel (NYSE: FLUT) | $101.78 | +7.12% | 3.01m | Sportsbook |
| PENN Entertainment (NASDAQ: PENN) | $17.36 | +0.12% | 2.18m | None |
Multi-year official sportsbook status; NFL trademarks and official data; integrations across league digital properties; event presence; continued official daily-fantasy status.
Margin: contract pricing is undisclosed. Competition: Fanatics joins DraftKings and FanDuel. Hold: bettor-friendly outcomes can cut revenue quickly. Policy: taxes and regulation remain state-specific.
The stock's 4.2% gain treats NFL continuity as valuable, but the business test is sharper: convert football visibility into payer growth while reversing the 13% decline in revenue per payer. A stable promotional ratio and improving sportsbook hold would strengthen the bridge from the renewal to DraftKings' $700–$900 million Adjusted EBITDA target.
Sources: NFL partnership announcement; Reuters, Aug. 27; DraftKings Q2 results; Google Finance. Figures are historical or management guidance, not investment advice.
NEW YORK, August 28, 2026, 15:20 – Shares of Fangdd rose sharply by 51.9% as the company managed to trim its losses through cost-cutting…
The market rewarded a faster cost reset than revenue decline. The operating improvement is real, but it came while the transaction base contracted.
Open: $0.676 · Prior close: $0.698. The stock traded above the prior close after opening below it.
| Metric | H1 2025 | H1 2026 | Change |
|---|---|---|---|
| Revenue | RMB203.4m | RMB115.7m | −43.1% |
| Closed-loop GMV | RMB8.0bn | RMB5.5bn | −30.8% |
| Gross profit | RMB18.5m | RMB15.3m | −17.1% |
| Gross margin | 9.1% | 13.2% | +410bp |
| Operating expenses | RMB90.2m | RMB41.2m | −54.3% |
| Net loss | RMB39.2m | RMB34.5m | −12.0% |
| Cash + restricted cash + investments | RMB107.2m |
| Six-month operating cash use | RMB36.7m |
| Liquidity / six-month cash use | 2.92× |
| Current liabilities | RMB177.6m |
| Market cap / H1 revenue | 2.39× |
| Market cap / annualized H1 revenue | 1.20× |
Market capitalization uses $1.06 and 38.55 million weighted-average shares. Multiples are arithmetic indicators, not analyst estimates.
The core debate: Fangdd removed RMB49.0 million of operating expense while revenue fell RMB87.6 million. That narrowed the operating loss by RMB45.8 million, but cash use and property-market exposure remain.
Weighted-average ordinary shares rose from 3.01 million to 38.55 million year over year.
That expansion dilutes each legacy share’s claim on any operating recovery. It also makes per-share comparisons less informative without a share-count adjustment.
Netcapital Inc. stock jumped on Friday, despite the company revealing a second compliance issue with Nasdaq. The stock remained under the exchange's $1 minimum…
| Metric | Value | YoY |
|---|---|---|
| Revenue | $0.461M | −47.0% |
| Operating loss | $9.295M | +11.7% |
| Net loss | $9.229M | −67.4% |
| Loss/share | $2.08 | preliminary |
The net loss is about 20× revenue and 2.3× current equity value.
The rally reflects trading demand, not a disclosed improvement in audited fundamentals. The central test is whether the company can complete its audit, meet both Nasdaq timetables and finance operations while the SEC case proceeds.
Netcapital Form 8-K · Nasdaq announcement · Form NT 10-K · Reuters SEC-case report
Shares of Wellchange Holdings Company Limited jumped 33.2% on Friday, even as the company launched a heavily discounted equity sale. The rise increased the…
The stock climbed even as Wellchange priced 50 million new shares at $0.15, far below the live market quote.
A full sale makes new shares 94.5% of the post-offering Class A count. Existing Class A ownership falls to 5.5% on a simple share-count basis.
The market price is 6.65 times the financing price. Settlement risk remains high until the shares close.
| FY2025 metric | Value |
|---|---|
| Revenue | $1.35M |
| Revenue growth | −41.6% |
| Gross profit | $0.58M |
| Net loss | −$7.32M |
| Operating cash flow | −$6.32M |
| Cash and investments | $2.81M |
Gross proceeds exceed year-end cash by $4.69 million. The raise is material to liquidity, but per-share value depends on execution.
| Checkpoint | Why it matters | Status |
|---|---|---|
| Offering close | Confirms actual shares sold and net cash received | Expected Aug. 31 |
| Share settlement | Tests whether the $0.15 supply compresses the market quote | Pending |
| Revenue recovery | 2025 revenue fell 41.6% | Unproven |
| Cash burn | 2025 operating outflow equaled 84% of gross proceeds | High |
| Analyst coverage | No current recommendations or price targets in WSJ data | None |
| Voting control | CEO expected to retain about 75.6% of combined votes | Concentrated |
Sources: Wellchange Aug. 28 offering announcement; SEC Form F-1 post-effective amendment; StockAnalysis financials and market data; WSJ market data. Figures are time-stamped above and may change after the offering closes.
Cyabra, Inc. shares surged 48.6% on Friday following news that the narrative-intelligence firm secured a six-figure yearly gaming agreement.
The contract can be material to revenue, but the undisclosed value leaves a tenfold range. The market-value gain of about $2.06 million equals 2.1×–20.6× that annual range.
Open $0.37 · Prior close $0.3073. The 93.5% low-to-high span shows unusually unstable price discovery.
| Metric | Q2 2025 | Q2 2026 | Change |
|---|---|---|---|
| Revenue | $1.3m | $1.9m | +39% |
| Gross profit | $1.1m | $1.5m | +39% |
| Gross margin | ≈84% | ≈84% | Flat |
| Operating loss | $3.4m | $3.1m | Improved |
| Net loss | $2.4m | $3.4m | Wider |
| Cash at June 30 | $0.794m |
| H1 operating cash use | $4.995m |
| Q2 operating cash use | $2.397m |
| Private placement | $6.0m |
| Accumulated deficit | $61.6m |
| Going-concern disclosure | Present |
Management said existing liquidity was insufficient for at least one year. Contract wins must be weighed against continuing financing needs.
Commercial proof versus cash burn: The unnamed publisher validates private-sector demand. Yet Q2 operating loss was 1.6 times revenue, and first-half operating cash use exceeded June cash by more than sixfold.
Friday volume equaled about 41 times the reported 5.02 million-share public float.
Volume also exceeded total shares outstanding by roughly 13 times. A reversal can be as violent as the initial move.
Shares of Bath & Body Works climbed on Friday, as investors focused on the core earnings outperformance rather than the headline gains boosted by…
| Metric | Prior | Current | Change |
|---|---|---|---|
| FY adjusted EPS | $2.40–$2.65 | $2.60–$2.80 | Midpoint +6.9% |
| FY net sales | −4.5% to −2.5% | −4% to −2.5% | Range narrowed |
| Q3 adjusted EPS | — | $0.07–$0.12 | Below $0.26 consensus |
NEW YORK, August 28, 2026, 14:50 EDT - Gold mining stocks slid 4.6% after a surprise move on interest rates by Warsh pressured the…
| Q2 metric | Value |
|---|---|
| Realized gold price | $4,414/oz |
| By-product AISC | $1,621/oz |
| Pre-overhead spread | $2,793/oz |
| Free cash flow | $2.2bn |
| Net cash | $3.4bn |
U.S. commercial staffing shares jumped 39% in August as companies leaned toward using temporary workers. The sector has climbed almost 80% so far this…
| ASA measure | Reading |
|---|---|
| Four-week index | 92 |
| Latest weekly index | 93 |
| Weekly change | −0.1% |
| Same-week YoY | +5.5% |
| New starts WoW | +5.0% |
| Firms reporting assignment gains | 49% |
| Company | Price | Day | Market cap |
|---|---|---|---|
| Kelly Services | $17.33 | +1.40% | $610M |
| TrueBlue | $10.64 | −0.19% | $324M |
| AMN Healthcare | $34.63 | −1.28% | $1.38B |
| ManpowerGroup | $62.80 | +0.95% | $2.98B |
| Staffing segment | 2026 change | Investor channel |
|---|---|---|
| Commercial / industrial | +11% | Flexible manufacturing and logistics labor |
| Professional | +8% | IT, healthcare and skilled placements |
| Clerical | Declined | Higher exposure to automation |
| Date | Event | What matters |
|---|---|---|
| Sep. 4 | August U.S. jobs report | Temporary-help payrolls and unemployment |
| Weekly | ASA Staffing Index | New starts and assignment breadth |
| Next earnings | KELYA, TBI, AMN, MAN | Revenue growth, gross margin and guidance |
Staffing shares have moved much faster than staffing employment. The sector's 39% August gain compares with 3.3% monthly employment growth. That gap prices in continued placement demand, operating leverage and better recruiter productivity. The September jobs report must now confirm that flexible hiring remains more than a short-lived response to uncertainty.
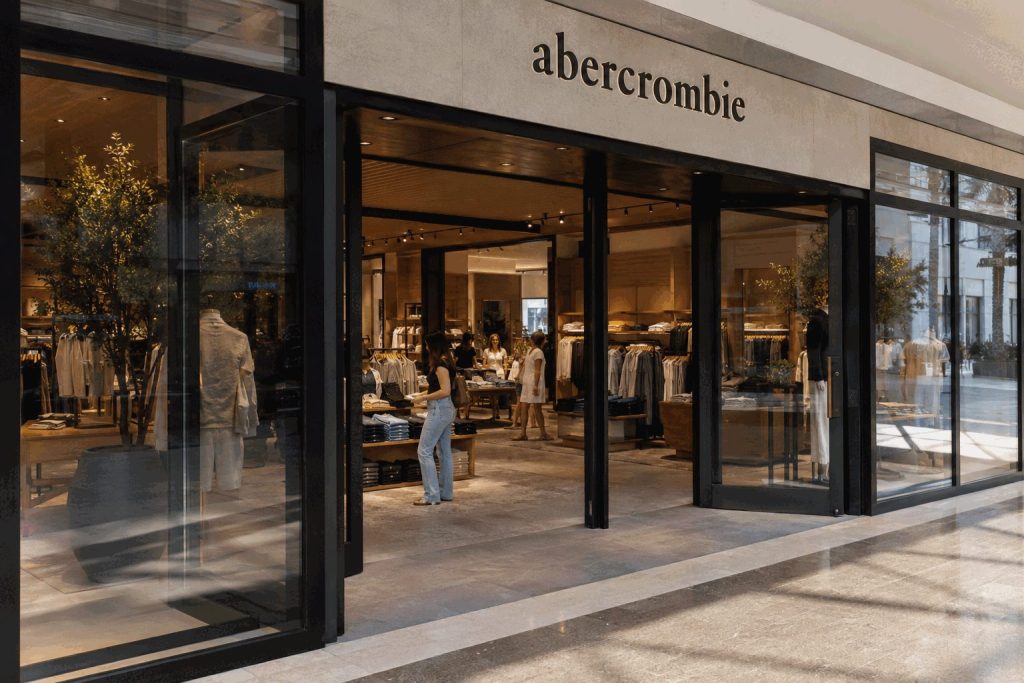
NEW ALBANY, Ohio, August 28, 2026, 14:35 EDT — Abercrombie & Fitch shares gained 36% following a $500 million stock repurchase that lowered the…
| Metric | Q2 result |
|---|---|
| Net sales | $1.267B, +5% |
| Comparable sales | Flat |
| Operating income | $253M |
| Operating margin | 19.9% |
| Reported diluted EPS | $4.17 |
| Approx. EPS ex-refund | $2.42 |
| Brand | Sales growth | Comp |
|---|---|---|
| Abercrombie | +8% | +4% |
| Hollister | +2% | −3% |
| Total company | +5% | 0% |
| Reported lift | Magnitude |
|---|---|
| Operating-margin benefit | 790 basis points |
| Diluted EPS benefit | $1.75 |
| Implied margin without benefit | ≈12.0% |
| Measure | Value |
|---|---|
| Q2 repurchases | $177M / 2.0M shares |
| Year-to-date repurchases | $282M / 3.2M shares |
| YTD share-count reduction | 7% of beginning shares |
| Remaining authorization | $568M |
| Cash | $628M |
| Total liquidity | $1.1B |
| First-half operating cash flow | $313M |
| Period | Guidance |
|---|---|
| Fiscal 2026 sales growth | ≈5% |
| Fiscal 2026 EPS | $13.10–$13.60 |
| Q3 sales growth | 5%–6% |
| Q3 EPS | $2.90–$3.20 |
| Q3 repurchases | At least $100M |
| FactSet view | Count / price |
|---|---|
| Buy | 8 |
| Hold | 7 |
| Average target | $162.90 |
| Median target | $162.50 |
| Range | $134–$185 |
The durable part of the story is the shrinking denominator: management plans at least $500 million of 2026 repurchases, equal to about 7.4% of market value. The less durable part is the margin headline. Removing the refund implies roughly a 12% operating margin, while flat total comps leave future gains dependent on brand execution and disciplined capital returns.
The yield on the two-year Treasury rose to its highest level in a month on Friday, following an inflation warning from Federal Reserve Chair…
The two-year yield led the selloff. The curve flattened as traders moved a September rate increase from a minority outcome to the most likely one.
Market snapshots: August 28, 2026 · 10:40–14:18 EDTBefore-speech levels: WSJ snapshot. Post-speech two-year: Reuters. Latest 10-year: 14:18 EDT market snapshot.
| Channel | Signal |
|---|---|
| Floating-rate credit | More expensive |
| Short Treasury income | More attractive |
| Long-duration equities | Higher discount rate |
| U.S. dollar | Stronger |
| Gold | −0.8% to $4,563.05 |
Gold and dollar reaction: Reuters, August 28, 2026.
Futures-implied probabilities reported by Reuters at 10:40 EDT. CME FedWatch probabilities change continuously.
The market did not price a broad inflation panic. It priced a more immediate Fed response. The 6.7-basis-point excess move in the two-year yield versus the 10-year is the cleanest evidence.
Warsh did not pre-commit to a hike. Market levels and probabilities are snapshots, not forecasts.
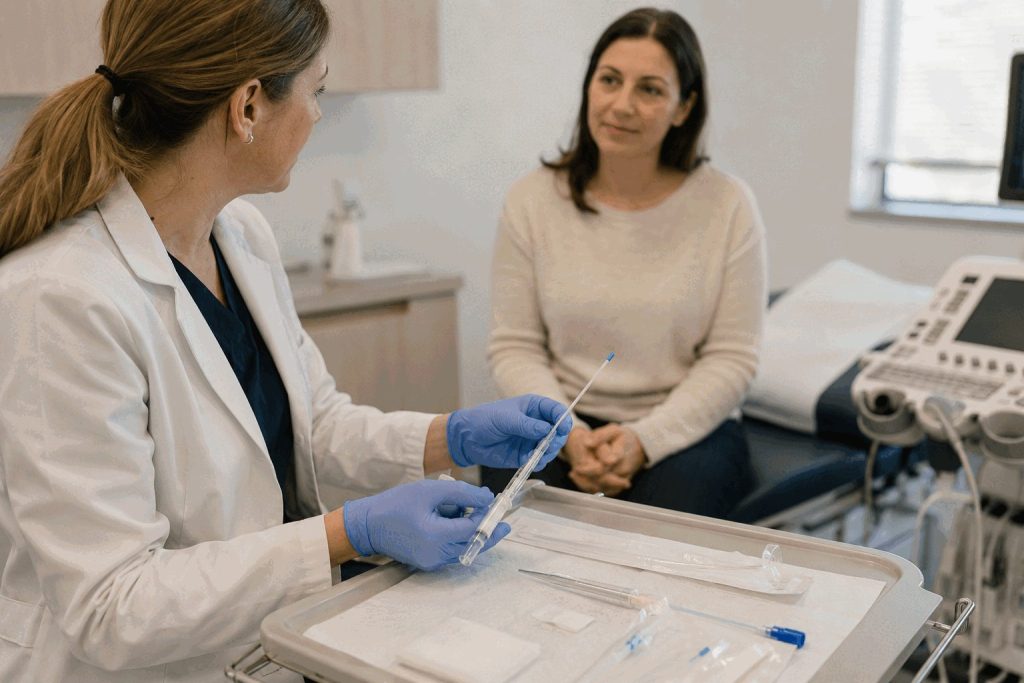
Femasys stock climbed 15.05% on Friday following an agreement with UNC Health to roll out the FemaSeed fertility portfolio in its OB/GYN clinics.
| Measure | Latest |
|---|---|
| Q2 sales | $331,827 |
| Year-over-year change | −18.9% |
| Q2 net loss | $4.47M |
| Loss / sales | 13.5× |
| June 30 cash | $1.4M |
| Subsequent placement | $30M |
| Potential total with warrants | Up to $90M |