N-able Shares Climb 9.1% After $95 Million Buyback Equals 11.7% of Market Value
BURLINGTON, Massachusetts, August 28, 2026, 11:25 – N-able shares jumped 9.1% after the software company announced a $95 million share buyback, an amount representing…

Market intelligence
Fast, evidence-led coverage of the companies and events moving global markets.
All coverage
BURLINGTON, Massachusetts, August 28, 2026, 11:25 – N-able shares jumped 9.1% after the software company announced a $95 million share buyback, an amount representing…

| Cash | $115.8M |
| Total debt | $392.3M |
| Net debt | $276.5M |
| Q2 unlevered FCF | $23M |
| Shares outstanding | 188.9M |
Financial position at June 30, 2026; share count at Aug. 5.
| Metric | Value | Change / margin |
|---|---|---|
| Revenue | $138.2M | +5.9% |
| ARR | $544.5M | +6.0% |
| GAAP gross margin | 76.8% | Core economics |
| Adjusted EBITDA | $39.9M | 28.9% margin |
| GAAP operating income | $16.5M | +76.8% |
| Metric | Range | Midpoint |
|---|---|---|
| ARR | $562M–$565M | $563.5M |
| Revenue | $539M–$542M | $540.5M |
| Adjusted EBITDA | $158M–$161M | $159.5M |
| EBITDA margin | 29%–30% | 29.5% |
Company outlook issued Aug. 10, 2026.
| Company | Ticker | Price | Friday move | Market cap |
|---|---|---|---|---|
| N-able | NABL | $4.31 | +9.11% | $0.82B |
| Qualys | QLYS | $185.35 | −1.72% | $6.49B |
| Tenable | TENB | $37.55 | −0.19% | $4.27B |
| Rapid7 | RPD | $13.37 | −0.96% | $0.91B |
Peer market data around 11:09 EDT on Aug. 28, 2026.
Authorization is optional. The strongest signal would be sustained repurchases funded by recurring cash generation.
NEW YORK, August 28, 2026, 11:13 – SharonAI shares slid 4.2% as uncertainty grew over its $4.88 billion deal with Nvidia, following Nvidia's decision…
Reuters reported Nvidia paused some credit-support deals that exchanged financing help for cloud-revenue participation.
Nvidia said the broader compute-access model remains in place and continues to evolve.
| Metric | Value | Signal |
|---|---|---|
| Revenue | $1.93M | +412% YoY |
| Adjusted EBITDA | $0.59M | Positive |
| Net loss | −$430.4M | Mostly non-cash |
| Cash | $1.861B | Build-out buffer |
| Current note liabilities | $1.007B | Financing weight |
| Checkpoint | Why it matters |
|---|---|
| Financing terms | Determines deployment cost and equity dilution |
| GPU acceptance | Triggers capacity availability and revenue |
| Customer utilization | Turns reserved capacity into billed sales |
| Contract amendments | Tests whether Nvidia's pause reaches SharonAI |
| Cash burn | Measures runway during infrastructure ramp |
The stock move values implementation risk, not simply demand. SharonAI's SEC filing already says deployments need additional debt or equity financing and face phased acceptance tests.
Key question: can $8.8 billion of contracted value convert into revenue without costly new capital?
Workday Inc. stock climbed 2.9% on Friday, lifting its market capitalization by roughly $1.4 billion following quarterly results that indicated notable demand for AI…
At $199.26, the stock sits near Citi’s target. The range shows disagreement over whether AI demand can offset slower subscription growth and weaker cash conversion.
Bull case: AI is already attached to customer wins, subscription backlog growth exceeds total backlog growth, and a $4 billion authorization can support per-share results.
Bear case: Q3 subscription growth slows to 12%, free cash flow contracted, trailing P/E remains about 40×, and takeover reports remain unconfirmed.
Veeva Systems held onto most of its post-earnings gains on Friday, as higher subscription growth and expanding operating margins contributed to a valuation boost…
| Metric | Q2 FY27 | Q2 FY26 | Change |
|---|---|---|---|
| Total revenue | $928.0M | $789.1M | +18% |
| Subscription revenue | $766.8M | $659.2M | +16% |
| GAAP operating income | $275.0M | $195.9M | +40% |
| GAAP net income | $273.4M | $200.3M | +37% |
| Adjusted EPS | $2.35 | $1.99 | +18% |
Recurring subscription growth and restrained cost expansion drove the earnings leverage.
Vault CRM conversions and Falcon deployments are the clearest operating tests behind the AI narrative.
Cytokinetics shares fell after reporting the first positive Phase 3 trial results in non-obstructive hypertrophic cardiomyopathy. The market response indicates investors were looking for…
| Endpoint | MYQORZO | Placebo | Net effect | p-value |
|---|---|---|---|---|
| KCCQ-CSS | +11.4 | +8.4 | +3.0 pts | 0.021 |
| Peak VO2 | +0.64 | −0.03 | +0.67 ml/kg/min | 0.003 |
| NYHA class improvement | 41.9% | 27.8% | +14.1 pts | <0.001 |
| NT-proBNP ratio | 0.43 | 1.00 | 0.43 | <0.001 |
Left-atrial volume and time to first cardiovascular event did not reach significance. Two treated patients had serious heart-failure events associated with LVEF below 50%.
Q2 product cost was $2.7M. Early inventory and launch timing limit direct run-rate comparisons.
Investor lens: the Phase 3 win expands MYQORZO's possible revenue base, but Friday's decline prices in questions about clinical magnitude, monitoring burden and launch spending.
BioNTech SE American depositary shares dropped 6.6% on Friday following the company’s decision to halt a Phase 2 study of autogene cevumeran. The individualized…
The ADSs opened at $102.34, traded as low as $98.80, then recovered part of the decline.
The monitoring board found a numerical overall-survival imbalance between arms and judged further continuation unlikely to change efficacy.
Stage II high-riskStage IIIctDNA-positivePost-surgery| Measure | Latest | Investor signal |
|---|---|---|
| Q2 revenue | €105.6m | Down 59.5% year over year |
| Q2 R&D expense | €551.0m | Heavy oncology investment continues |
| Q2 net loss | €820.8m | Up 112% year over year |
| 2026 revenue guide | €1.6–€1.9bn | Already reduced in August |
| 2026 adjusted R&D guide | €2.0–€2.3bn | Capital allocation becomes more important |
| Share repurchase authorization | Up to $1.0bn | Potential downside buffer, market-dependent |
Liquidity can absorb program failure, but repeated negative readouts would compress pipeline valuation.
| Consensus | Buy |
| Average target | $121.51 |
| Median target | $129.75 |
| Low / high | $76.14 / $145.26 |
| Coverage | 20 analysts |
Snapshot checked Aug. 28; ratings predate the trial termination.
Bull case: the stop saves future study spending and cash is redirected to stronger assets. Bear case: the survival signal weakens confidence in personalized mRNA oncology and raises scrutiny across partnered programs.
CAMBRIDGE, Massachusetts, August 28, 2026, 09:47 - Moderna shares declined by 3.4% as the company launched a $2.6 billion convertible bond offering, putting its…
Reference points: $137.25 open, $147.77 high, $134.07 low, $137.86 latest.
Initial conversion equals roughly 3.1% of the June share base. The capped call is designed to offset dilution, but only up to its cap.
2032 maturityRule 144ASenior unsecured| Measure | Term | What it changes |
|---|---|---|
| Initial conversion | $210.58 | 47.5% premium to Thursday close |
| Capped-call ceiling | $392.6175 | Hedge protection to 175% premium |
| Expected net proceeds | $2.563bn | About 37% of June liquidity |
| Capped-call cost | $285m | About 11% of base net proceeds |
| Buyer option | Up to $400m | Could lift net proceeds near $2.96bn |
The financing replenishes flexibility after the settlement payment and ongoing research spending.
| Q2 revenue | $145m |
| Q2 EPS | −$1.97 |
| 2026 revenue plan | Up to +10% |
| Year-end cash guide | $4.7–$5.2bn |
| Analyst consensus | Hold |
| Average target | $106.63 |
Bull case: zero-coupon funding protects oncology momentum and the hedge limits dilution. Bear case: the stock remains above consensus value while cash burn and vaccine demand stay uncertain.
Eli Lilly and Company dropped 0.9% on Friday following the news that Mounjaro received a significant cardiovascular indication. The drop wiped out approximately $9.8…
Eli Lilly · NYSE: LLY · Market data at August 28, 2026, 09:44:26 EDT
| New indication | CV risk reduction in high-risk adults with type 2 diabetes |
| Comparator | Trulicity |
| MACE-3 hazard ratio | 0.92 (95.3% CI: 0.83–1.01) |
| Relative event rate | 8% lower |
| All-cause mortality | 16% lower |
| Statistical result | Noninferior; not superior |
| Product | Q2 2026 sales | Growth |
|---|---|---|
| Mounjaro worldwide | $9.9B | +91% |
| Mounjaro U.S. | $4.8B | +45% |
| Mounjaro ex-U.S. | $5.2B | +172% |
| Zepbound U.S. | $4.9B | +44% |
| Lilly total | $22.97B | Quarter ended June |
Mounjaro as a share of Lilly revenue
43.3%
Mounjaro plus Zepbound as a share of Lilly revenue
64.4%
The label expansion is material because tirzepatide already supplies nearly two-thirds of quarterly revenue.
| Friday open | $1,172.66 |
| Early range | $1,164.32–$1,174.00 |
| 52-week range | $712.05–$1,292.65 |
| P/E ratio | 39.22× |
| Average volume | 2.65M shares |
| Analyst ratings | 18 Buy · 2 Hold · 0 Sell |
Lower realized prices already offset part of U.S. volume growth. Rebate pressure, supply tightness and Novo Nordisk competition can limit incremental revenue. The medicine carries warnings including thyroid C-cell tumors and pancreatitis.
Sources: Lilly, Reuters, PubMed, Lilly Pricing Information and Google Finance. Market data are timestamped above.
Shares in Roivant Sciences Ltd. lost 2.7% on Friday, despite receiving U.S. regulatory approval for LISRAYA. The decline wiped out roughly $720 million in…
Roivant Sciences (NASDAQ: ROIV) · Market data at August 28, 2026, 09:39:23 EDT
| Previous close | $37.58 |
| Friday open | $37.01 |
| Early range | $36.49–$37.13 |
| 52-week range | $11.85–$37.95 |
| Average volume | 5.36M shares |
| Measure | LISRAYA 30mg | Placebo |
|---|---|---|
| Mean TIS, week 52 | 46.5 | 31.2 |
| Advantage | +15.3 points | — |
| Treatment discontinuation | 6% | 11% |
| Trial size | 241 adults; 52 weeks | |
Peak-sales estimate as a share of current equity value
7.6% · $2.0B / $26.42B
| Cash and securities, June 30 | $3.9B |
| Quarterly net loss | $290.6M |
| Quarterly R&D | $202.0M |
| Quarterly revenue | $1.4M |
| Share repurchases | $208.7M |
| Event | Status | Investor test |
|---|---|---|
| FDA approval | Completed Aug. 27 | Regulatory risk removed |
| Specialty-pharmacy launch | Immediate | Prescription conversion |
| Pricing disclosure | Pending | Gross-to-net revenue |
| Payer coverage | Developing | Launch velocity and access |
Pricing remains undisclosed. Payer restrictions could slow uptake in a small patient population. LISRAYA carries boxed warnings for serious infections, malignancy, major cardiovascular events and thrombosis.
Sources: FDA, Roivant, Reuters, Roivant quarterly results and Google Finance. Trial and financial data are company-reported unless noted.
Kazia Therapeutics Limited dropped 7.34% to $15.66 ahead of Friday's session. The cancer drug company announced a $40 million equity sale following a significant…
| Layer | Count | Price | Cash |
|---|---|---|---|
| New ADSs | 2.580M | $15.50 package | $40M |
| Series A | 2.243M | $17.825 | ≈$40M |
| Series B | 2.064M | $19.375 | ≈$40M |
Warrant cash is contingent on exercise. Figures are gross and exclude fees.
evaluable Stage IV TNBC patients showed clinical benefit.
Phase 1b, small and preliminary; not powered for statistical significance.
| Cash, Dec. 31, 2025 | A$69.46M |
| Half-year operating cash use | A$9.54M |
| Half-year net loss | A$12.55M |
| Average target | $28.60 |
| Low / high | $18 / $34 |
Google Finance, August 28. Most targets predate this financing.
Aug. 31, 2026
Expected offering close
July 2027
Expected TNBC enrollment completion
H2 2027
Stage IV TNBC readout / Series A trigger
H1 2028
HR+/HER2− readout / Series B trigger
The $40 million primary sale equals roughly 22% of Thursday's $181.38 million reported market value. It improves funding capacity, but the full security stack can expand the simplified ADS count sharply. The decisive questions are whether larger cohorts confirm the six-patient signal and whether the shares exceed both warrant strikes.
Sources: Kazia offering release and half-year report; Kazia paxalisib update; Google Finance. Share-count analysis is simplified and may differ from legal fully diluted capitalization because pre-funded and legacy instruments are not fully reconciled.
Shares of SentinelOne declined 5.94% in premarket trading on Friday following a mixed earnings forecast. Robust growth in recurring revenue did not counterbalance the…
Recurring growth versus weaker per-share profit expectations
Premarket: August 28, 2026, 09:30 EDT · Results: fiscal Q2 ended July 31, 2026| Metric | New | Previous / consensus |
|---|---|---|
| Q3 revenue | $309M–$311M | $310M consensus |
| Q3 adjusted EPS | $0.08–$0.09 | $0.10 consensus |
| FY revenue | $1.202B–$1.207B | $1.195B–$1.205B |
| FY operating income | $124M–$128M | $115M–$125M |
| FY adjusted EPS | $0.30–$0.32 | $0.32–$0.38 |
| FY diluted shares | 361M | 350M |
Bar lengths normalize the displayed growth rates to a 25% scale.
| Non-GAAP operating margin | 10% | 2% year ago |
| Non-GAAP net margin | 10% | 5% year ago |
| GAAP gross margin | 72% | 75% year ago |
| Non-GAAP gross margin | 77% | 79% year ago |
| GAAP net margin | −32% | −30% year ago |
Change in guidance midpoints versus the prior company outlook.
The selloff reflects a quality-of-earnings question. ARR and revenue still grow above 20%, and adjusted operating margin reached a record 10%. Yet a larger diluted share count and lower EPS range mean that improved operations are not translating cleanly into per-share earnings.
| Cash and investments | $813M |
| Q2 free cash flow | −$13.2M |
| Six-month operating cash flow | $31.9M |
| Six-month free cash flow | $17.5M |
| GAAP Q2 net loss | $93.4M |
| Consensus | Overweight |
| Buy / Overweight | 22 |
| Hold | 16 |
| Average target | $22.98 |
| Target range | $15.50–$28.00 |
Average target implies roughly 8% upside from the 09:30 EDT premarket price.
Sources: SentinelOne fiscal Q2 2027 release and filings; MarketWatch; Public premarket data; Investor’s Business Daily; WSJ/FactSet. Extended-hours prices can be thin and volatile.
Shares of Hormel Foods Corporation posted their largest drop in months on Thursday, sliding 10.25% to close at $21.28 after the company lowered its…
Demand pressure versus improving adjusted profitability
Market data: August 28, 2026, 09:00 EDT · Results: fiscal Q3 ended July 26, 2026| Metric | New / Q3 | Prior / consensus |
|---|---|---|
| FY sales | $12.1B–$12.2B | $12.2B–$12.5B |
| FY organic growth | 1%–2% | 1%–4% |
| FY adjusted EPS | $1.45–$1.51 | $1.43–$1.51 |
| Q3 revenue | $2.96B | $3.04B consensus |
| Q3 adjusted EPS | $0.37 | $0.35 consensus |
| Adjusted operating margin | 9.0% | 8.4% year ago |
| GAAP operating margin | 3.7% | 7.9% year ago |
| Operating cash flow | $241M | +54% |
| Capital spending | $68M | $72M year ago |
| Quarterly dividends | $161M | returned to holders |
GAAP results absorbed $56M from the Brazil divestiture, $48M from an Indonesia impairment and $38M from litigation.
FactSet consensus: Hold. Nine Hold ratings, four positive ratings. Average target $26.13, about 23% above the August 27 close.
The share reaction says volume matters more than the two-cent EPS beat. A 1.6% reduction in the sales-guidance midpoint triggered a 10.25% equity decline because retail volume fell 9%. Margin gains and cash generation provide support, but valuation recovery likely requires evidence that retail demand has stabilized.
| Adjusted margin | +60 bps year over year |
| Adjusted EPS guide floor | Raised by $0.02 |
| Foodservice | Sales and profit grew |
| Cash generation | Operating cash flow +54% |
| Retail demand | Volume −9% |
| Revenue outlook | Midpoint −1.6% |
| Logistics | Higher expense pressure |
| Execution | Portfolio changes distort GAAP results |
Sources: Hormel Foods fiscal Q3 2026 release; Reuters; WSJ/FactSet; Google Finance; Public premarket data. Market figures reflect the August 27 close unless stated otherwise. Extended-hours prices may be thin and volatile.
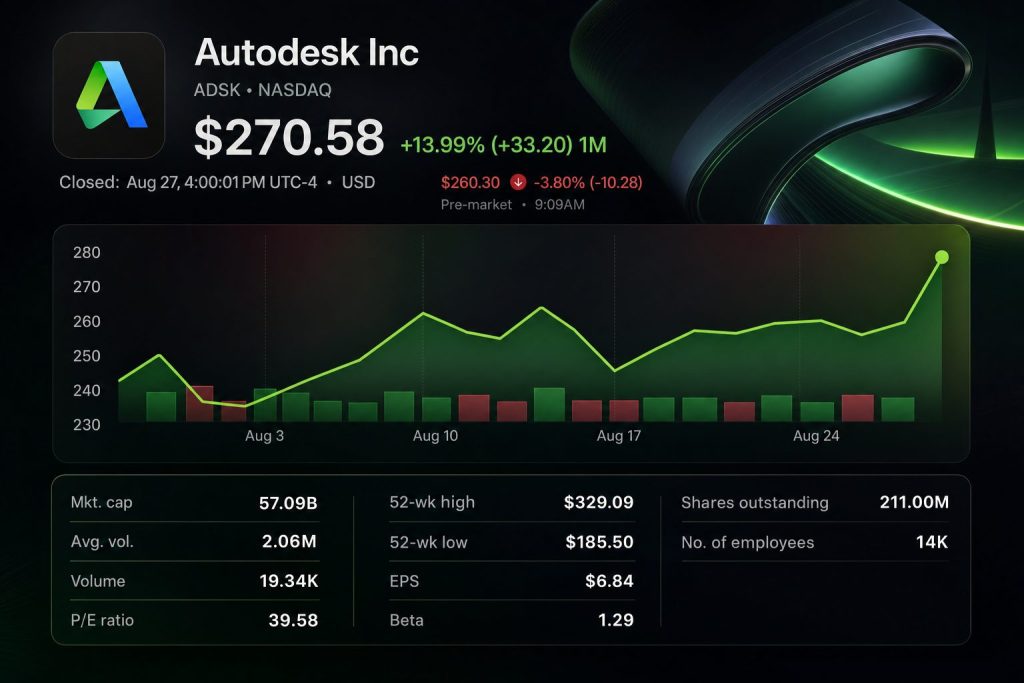
Autodesk, Inc. dropped 4.1% after reporting a robust quarter but issuing a weaker short-term profit outlook. Shares changed hands at $259.50 as of 07:15…
| Metric | Q2 FY27 | YoY |
|---|---|---|
| Billings | $1.854B | +10% |
| Revenue | $2.046B | +16% |
| GAAP operating margin | 29% | +4 pts |
| Adjusted margin | 41% | +2 pts |
| Adjusted EPS | $3.30 | +$0.68 |
| Current RPO | $5.245B | +12% |
| Total RPO | $7.433B | +2% |
| Deferred revenue | $4.258B | +11% |
| Unbilled deferred revenue | $3.175B | -8% |
Lower multi-year discounts support pricing but temporarily weigh on long-duration RPO.
| Revenue | $8.295B–$8.345B |
| Billings | $8.575B–$8.650B |
| Adjusted margin | ≈39% |
| Adjusted EPS | $12.52–$12.60 |
| Free cash flow | $2.725B–$2.750B |
Free cash flow includes about $45M of MaintainX transaction expenses.
Autodesk is expanding revenue, current backlog and margins. The selloff says the market wants that strength to reach per-share profit faster. MaintainX can deepen the platform, but its integration now sets the next execution hurdle.
Sources: Autodesk Aug. 27, 2026 earnings release and opening commentary; MarketWatch; Barron’s; MarketBeat. Market figures may be delayed. Informational only.
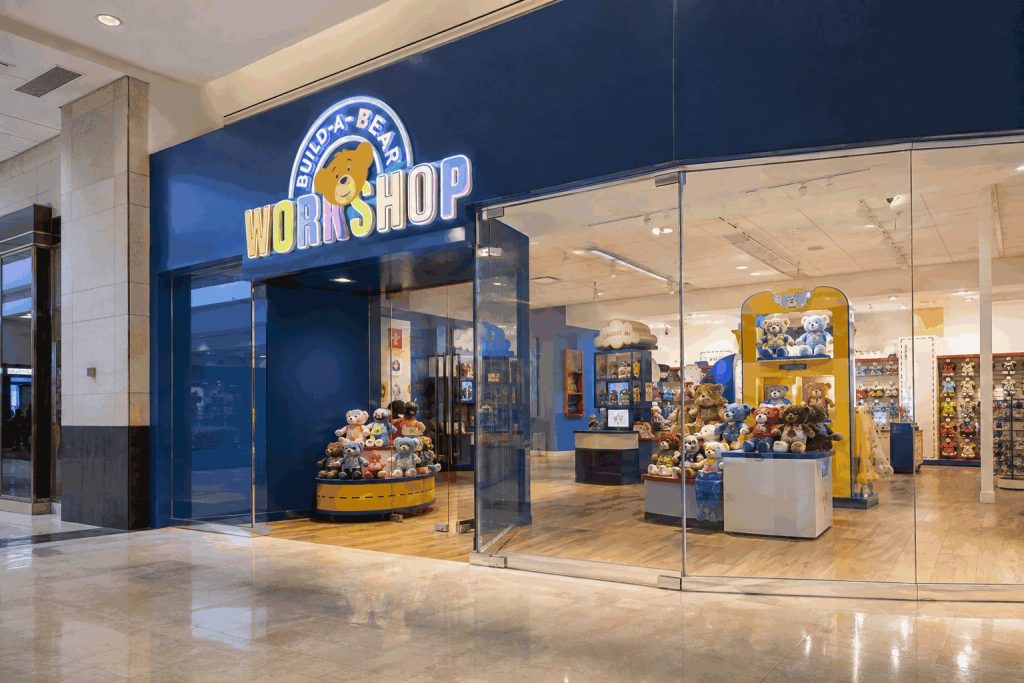
Build-A-Bear Workshop, Inc. shares suffered a record 27.3% fall after the retailer cut its annual outlook. The stock closed Thursday at $28.44, its lowest…
| Metric | Q2 2026 | YoY |
|---|---|---|
| Revenue | $115.3M | -7.2% |
| Pre-tax income | $11.6M | -24.1% |
| Pre-tax margin | 10.1% | -220 bps |
| EPS | $0.70 | -25.5% |
| EBITDA margin | 13.2% | -190 bps |
Bars scale the absolute decline against the largest channel drop.
| Cash | $14.0M |
| Cash change YoY | -$25.1M |
| Inventory | $81.1M |
| Revolver borrowings | $0 |
| 1H buybacks + dividends | $22.7M |
| Locations | 674 |
| P/E | 7.1× |
| Dividend yield | 3.16% |
| Analyst coverage | 4 |
| Consensus | Strong Buy |
| Average target | $51.75 |
| Target gap | +82% |
The consensus and targets may not yet reflect Thursday’s guidance cut.
The share-price collapse was larger than the revenue reset because the profit range fell nearly three times as fast. A lower cash balance also reduces flexibility after $22.7 million of first-half capital returns. The next test is whether Halloween assortments stabilize traffic without deeper promotions.
Sources: Build-A-Bear Aug. 27, 2026 Form 8-K and earnings release; Reuters; MarketWatch; StockAnalysis. Figures may be delayed. This dashboard is informational, not investment advice.
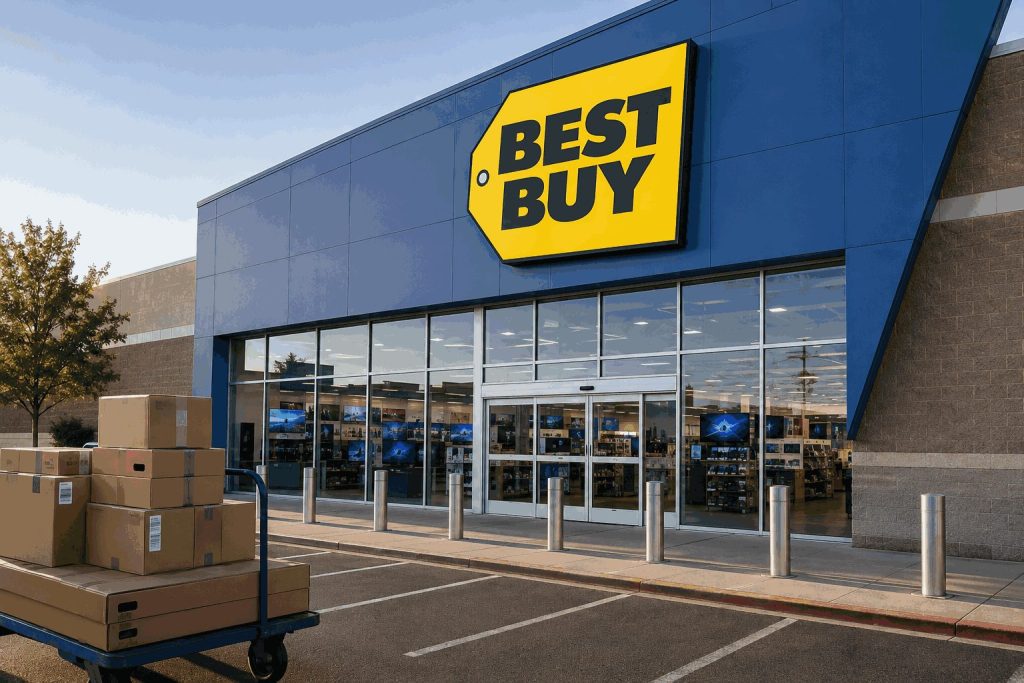
MINNEAPOLIS, August 28, 2026, 08:48 EDT – Best Buy shares fell 4.4% after the electronics retailer reported quarterly earnings above expectations but saw increased…
Revenue and earnings grew, but adjusted domestic SG&A rose to 19.6% of revenue from 19.3%.
The earnings beat arrived after a strong run and relied partly on a $34 million tariff refund. Compensation, advertising and growth initiatives lifted costs.
Higher SG&ARefund benefitGaming declineExecution barThursday volume reached 8.97 million shares, 219% of the 65-day average.
| Fiscal 2027 | Prior | Updated |
|---|---|---|
| Revenue | $41.2B–$42.1B | $42.3B–$42.8B |
| Comparable sales | −1.0%–+1.0% | +1.9%–+3.0% |
| Adj. operating margin | 4.3%–4.4% | 4.4%–4.5% |
| Adj. diluted EPS | $6.30–$6.60 | $6.70–$6.90 |
| Capital spending | ≈$750M | Unchanged |
Computing, home theater, AI glasses and trading cards led. International revenue fell 4.2%.
| Firm | Rating signal | New target | Previous |
|---|---|---|---|
| Guggenheim | Positive | $95 | $90 |
| Morgan Stanley | Target raised | $90 | $80 |
| UBS | Hold | $90 | $86 |
| Barclays | Hold | $85 | $77 |
| Goldman Sachs | Target raised | $71 | $62 |
Actions reported Aug. 28, 2026; 29 ratings are tracked by MarketWatch/FactSet.
4.60% yield7.1% short float
Best Buy results
Wall Street Journal
MarketWatch quote
Google Finance listing
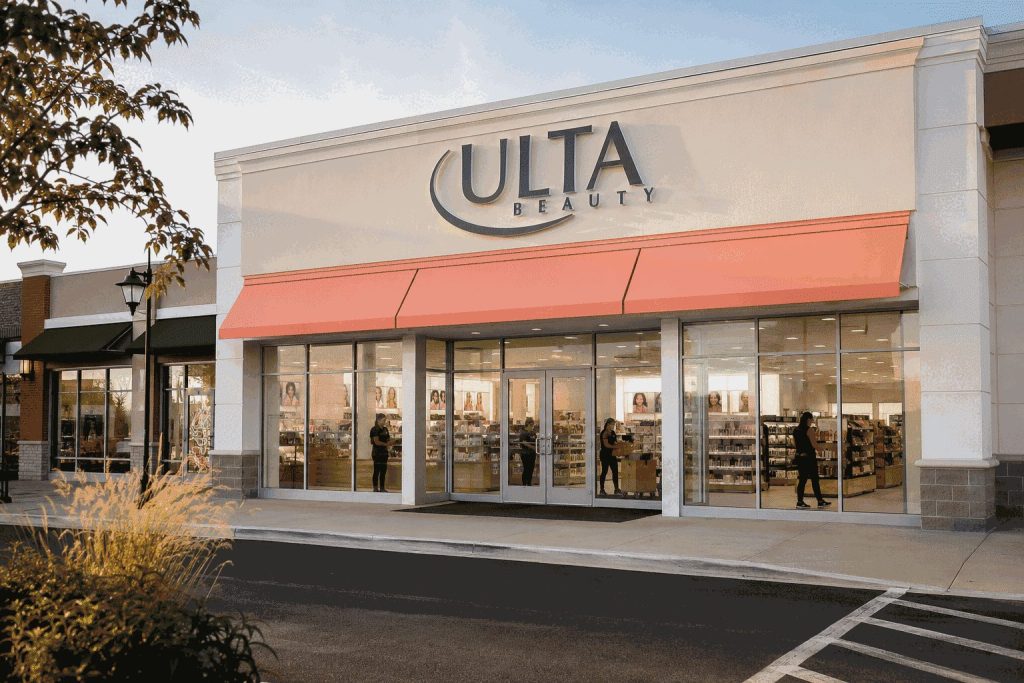
Ulta Beauty stock fell on Friday, even after the company surpassed quarterly expectations and raised its full-year outlook. The 1.5% drop before the market…
The quarter beat consensus, but comparable growth slowed from 6.7% a year earlier and gross margin eased 10 basis points.
The one-month gain was 5.32% through Aug. 27, leaving less room for a merely good print.
| Fiscal 2026 | Prior | Updated |
|---|---|---|
| Net sales growth | 6.0%–7.0% | 6.7%–7.2% |
| Comparable sales | 2.5%–3.5% | 3.2%–3.7% |
| Operating income growth | 6.5%–9.0% | 8.3%–9.3% |
| Diluted EPS | $28.36–$28.80 | $28.70–$29.00 |
| Fiscal-year repurchases | $1.5B | $1.8B |
Bars share a $2.4 billion scale. Repurchases can support per-share earnings, but debt exceeds cash plus short-term investments.
| Signal | Current read | What changes the view |
|---|---|---|
| Demand | 3.8% comps; no reported trade-down | Holiday traffic and prestige mix |
| Margin | 39.1% gross; 12.5% operating | Space NK mix and markdowns |
| Inventory | $2.4B, roughly flat YoY | Sell-through versus new launches |
| Capital returns | $1.8B fiscal-year plan | Execution against $1.0B authorization remaining |
| Valuation | 20.24× trailing EPS | Evidence that raised guidance is conservative |
Ulta Beauty results
Reuters earnings report
MarketWatch quote
Google Finance listing
All figures are company-reported or cited to the timestamped market sources above. Rounded totals may not sum exactly.