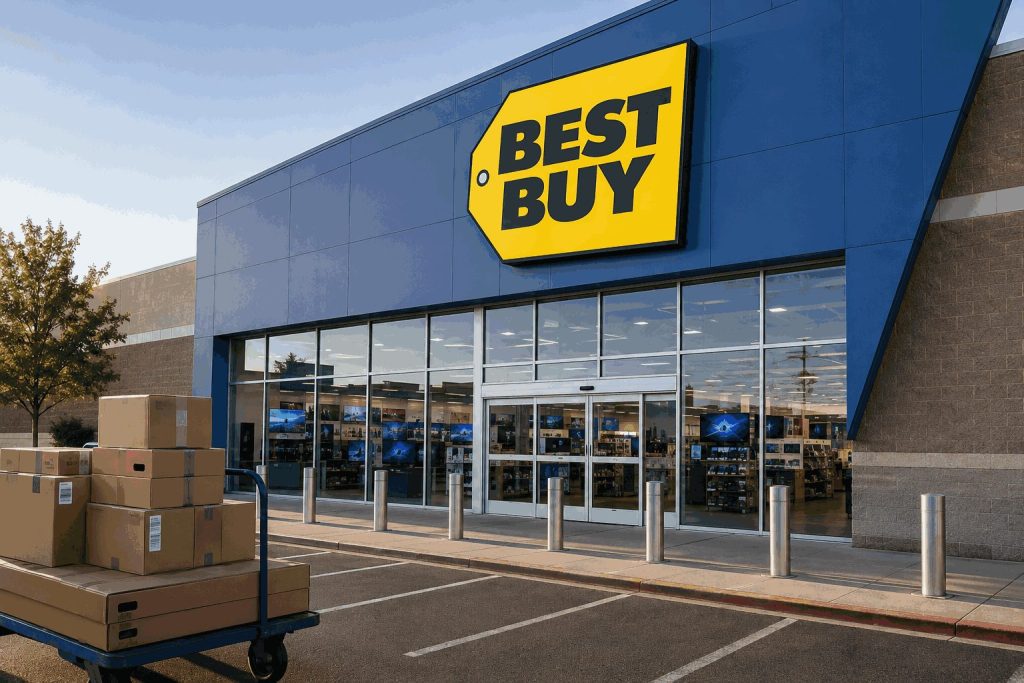
MINNEAPOLIS, August 28, 2026, 08:48 EDT – Best Buy shares fell 4.4% after the electronics retailer reported quarterly earnings above expectations but saw increased…
·3 min read
NYSE: BBY
Sales rebound, costs keep the bar high
Best Buy fiscal Q2 2027 results and market reaction
Market data: Aug. 28, 2026, 08:05 EDT Financial data: Aug. 27, 2026, 07:00 EDT
Thursday close
$83.56
−4.44%
$3.88 per share
Premarket
$84.00
+0.53%
2,940 shares at 08:05 EDT
Q2 revenue
$9.779B
+3.6% YoY
Comps +4.1%
Value erased
≈$780M
Thursday
4.44% × $17.61B market cap
One quarter, two signals
Revenue and earnings grew, but adjusted domestic SG&A rose to 19.6% of revenue from 19.3%.
Why investors sold
The earnings beat arrived after a strong run and relied partly on a $34 million tariff refund. Compensation, advertising and growth initiatives lifted costs.
Higher SG&ARefund benefitGaming declineExecution bar
Thursday volume reached 8.97 million shares, 219% of the 65-day average.
Guidance reset
Fiscal 2027
Prior
Updated
Revenue
$41.2B–$42.1B
$42.3B–$42.8B
Comparable sales
−1.0%–+1.0%
+1.9%–+3.0%
Adj. operating margin
4.3%–4.4%
4.4%–4.5%
Adj. diluted EPS
$6.30–$6.60
$6.70–$6.90
Capital spending
≈$750M
Unchanged
Where growth came from
Domestic revenue
$9.07B
Online revenue
$3.00B
International
$709M
Computing, home theater, AI glasses and trading cards led. International revenue fell 4.2%.
Post-results analyst actions
Firm
Rating signal
New target
Previous
Guggenheim
Positive
$95
$90
Morgan Stanley
Target raised
$90
$80
UBS
Hold
$90
$86
Barclays
Hold
$85
$77
Goldman Sachs
Target raised
$71
$62
Actions reported Aug. 28, 2026; 29 ratings are tracked by MarketWatch/FactSet.
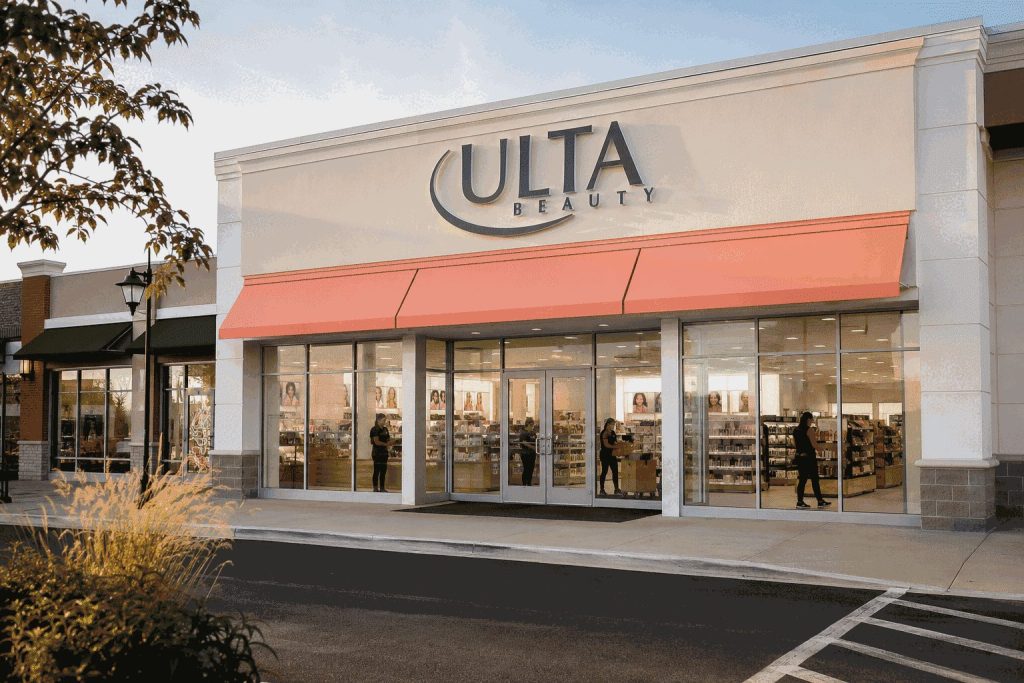
Ulta Beauty stock fell on Friday, even after the company surpassed quarterly expectations and raised its full-year outlook. The 1.5% drop before the market…
·2 min read
Ulta Beauty · NASDAQ: ULTA
Beat, raise — then a cautious tape
Fiscal Q2 2026 results versus the prior-year quarter and previous company outlook
Market data: Aug. 28, 2026, 08:06 EDT Financial data: Aug. 27, 2026, 16:05 EDT
Premarket price
$531.86
−1.52%
12,750 shares before hours
Quarterly sales
$3.036B
+8.9% YoY
Comparable sales +3.8%
Diluted EPS
$6.55
+13.3% YoY
LSEG consensus: $6.19
Market value
$23.22B
≈−$350M
Implied by the 1.52% move
Quarter: growth outran margin expansion
GrowthMarginValues reported Aug. 27, 2026
Why shares hesitated
The quarter beat consensus, but comparable growth slowed from 6.7% a year earlier and gross margin eased 10 basis points.
High expectations
Space NK mix
Comp deceleration
Marketing intensity
The one-month gain was 5.32% through Aug. 27, leaving less room for a merely good print.
Guidance: every major line moved higher
Fiscal 2026
Prior
Updated
Net sales growth
6.0%–7.0%
6.7%–7.2%
Comparable sales
2.5%–3.5%
3.2%–3.7%
Operating income growth
6.5%–9.0%
8.3%–9.3%
Diluted EPS
$28.36–$28.80
$28.70–$29.00
Fiscal-year repurchases
$1.5B
$1.8B
Capital allocation and balance sheet
Inventory
$2.4B
H1 repurchases
$791M
Short-term debt
$340M
Cash + ST investments
$214M
Bars share a $2.4 billion scale. Repurchases can support per-share earnings, but debt exceeds cash plus short-term investments.
BioLineRx stock dropped 20.3% after a new funding deal widened the potential dilution pool, exceeding what the cash raised would indicate. The ADSs changed…
·2 min read
BioLineRx financing dashboard
Cash extension versus warrant dilution
28 Aug 2026 · 08:19 EDT
Premarket price
$2.20
Prior close: $2.76
Premarket move
−20.29%
Observed premarket
Gross proceeds
$3.75M
Before placement fees
Offer price
$2.78
Per ADS / warrant strike
Potential ADS-equivalent pool
March base
4.35M
New ADSs
1.35M
New warrants
2.02M
Amended warrants
0.28M
Cash bridge
Investor metric
Value
Read-through
Warrants per new ADS
1.5×
Large embedded dilution incentive
Simplified fully diluted pool
≈8.0M ADS equivalents
Existing base becomes ≈54%
Raise / March cash
≈22%
Meaningful but not transformative
Raise / Q1 operating cash use
≈1.6×
About 1.6 quarters before fees
Expected close / Q2 report
Aug. 31, 2026
Financing and updated cash meet
Funding benefit
The raise supports GLIX1 development and working capital. It supplements a cash balance previously guided into the first half of 2027.
Dilution test
New and amended warrants cluster at $2.78. Exercises can add capital, but they may cap upside and reduce each existing holder’s ownership.
Sources: BioLineRx offering release and Q1 2026 results; StockAnalysis premarket quote. Market figures timestamped 28 Aug 2026, 08:19 EDT. Dilution figures are simplified estimates and exclude other securities or later share-count changes.
Shares of Elastic N.V. rose 17.4% in premarket trade after the company reported its contract backlog expanding more quickly than revenue. The stock climbed…
·2 min read
Elastic investor dashboard
Fiscal Q1 2027 results and premarket repricing
28 Aug 2026 · 08:03 EDT
Premarket price
$98.28
Prior close: $83.74
Premarket move
+17.36%
+$14.54 per share
Implied value gain
≈$1.5B
Estimate from quoted market value
Premarket volume
100,194
Shares observed at 08:03 EDT
Growth comparison
Revenue
15%
Sales-led sub.
18%
Current RPO
21%
Total RPO
27%
Contract visibility
Operating measure
Reported
Investor read-through
Adjusted EPS
$0.70 vs $0.58 consensus
Beat supports the rally
Q2 revenue midpoint
$486.5M vs $483M consensus
Modest upside to expectations
>$100K ACV customers
1,800 vs 1,550 year ago
Enterprise cohort grew 16%
Non-GAAP operating margin
16.2%
Positive adjusted leverage
GAAP operating margin
-5.0%
Profit-quality gap remains
Why investors care
Current RPO grew six points faster than revenue. That expands near-term contracted visibility if deployments and renewals convert as planned.
What can break the thesis
A slower backlog conversion, rising AI infrastructure costs or stronger cloud competition could expose the gap between adjusted profit and the GAAP loss.
Sources: Elastic fiscal Q1 2027 release; FactSet estimates cited by Investors.com; StockAnalysis premarket quote. Market figures timestamped 28 Aug 2026, 08:03 EDT. Implied value change is an estimate, not a reported company figure.
ASHBURN, Virginia, August 28, 2026, 07:51 — Shares in Quoin rose 41.8% after the company reported QRX003 achieved its primary endpoint, while a $50…
·3 min read
Quoin: endpoint signal, financing reset
QRX003 Phase 2/3 interim data · Market data at 07:34 EDT, August 28, 2026
Premarket price
$7.31
+41.8%
Premarket volume
6.87M
vs. 2.01M ADSs outstanding
Implied value added
~$4.3M
$2.15 × 2.01M ADSs
Interim responders
4 of 6
66.7%
Clinical signal: promising, not conclusive
Four patients achieved at least a one-grade IGA improvement. The study is open-label and plans about 20 evaluable participants.
Clinical timeline
Interim cutoff
6 patients
Treatment duration
12 weeks
Recruitment completion
End-2026
Full topline data
Q2 2027
Regulatory status
Investigational
QRX003 has U.S. Orphan Drug, Rare Pediatric Disease and Fast Track designations. None guarantees approval.
Financing mechanics
Security
Count
Price
ADSs / pre-funded equivalents
6.31M
$4.88
Ordinary warrants
3.15M
$6.10
Existing ADSs
2.01M
—
$30.8M upfront; another $19.2M depends on investors exercising warrants.
Ownership dilution map
Existing holders before placement
Existing holders after initial securities
Existing holders after full warrant exercise
Simplified ADS-equivalent calculation; excludes other outstanding options and warrants.
Why the stock moved
The trial crossed its adjusted statistical hurdle and reported no treatment-related serious adverse events. That improved the perceived probability of clinical success.
The financing simultaneously removed a near-term cash constraint. Yet the new ADS equivalents can make existing holders a much smaller share of the company.
Pricing tension
Premarket quote $7.31
Placement price $4.88 · 33.2% discount
Warrant exercise $6.10 · 16.6% below quote
Balance-sheet bridge
June cash + investments: $10.8MQ2 net loss: $5.37MUpfront raise: $30.8M
Management expects full financing proceeds to fund operations into the second half of 2029.
A positive interim endpoint can weaken or disappear as enrollment grows.
Sources: Quoin August 28 clinical and financing releases; June-quarter results; StockAnalysis premarket quote. Calculations use ADS equivalents and may differ due to rounding.
Affirm Holdings shares rose 12.9% in premarket trading on Friday, driven by robust transaction growth and an optimistic annual forecast.
·2 min read
Affirm: volume growth meets a cleaner profit profile
Fiscal Q4 2026 investor dashboard · Market data at 06:32 EDT, August 28, 2026
Premarket price
$87.51
+12.9%
Implied value added
~$3.36B
$10.02 × 334.9M shares
Quarterly GMV
$14.06B
+36% year over year
Active consumers
27.8M
+21% year over year
Growth outpaced the cost base
RLTC means revenue less transaction costs, Affirm's closest operating measure of transaction economics.
Fiscal 2027 demand bridge
Fiscal 2026 GMV
$50.17B
Fiscal 2027 management floor
>$64B
At the $64 billion floor, annual GMV would grow at least 27.6%.
The outlook still requires strong merchant distribution and consumer engagement.
Fiscal Q4 scorecard
Metric
Result
YoY
GMV
$14.06B
+36%
Revenue
$1.17B
+33%
Revenue less transaction costs
$589M
+39%
Active consumers
27.8M
+21%
GAAP operating income
$147.3M
Positive
Unit-economics snapshot
Revenue / GMV 8.3%
RLTC / GMV 4.2%
GAAP operating margin 12.6%, up six percentage points
Calculated from reported quarterly figures; rounded. Direct merchant integrations contributed about half of GMV growth.
Why investors paid up
The rally reflects three simultaneous improvements: 36% payment-volume growth, 39% growth in revenue less transaction costs and a positive 12.6% GAAP operating margin.
The market is rewarding evidence that merchant scale can lift transaction profit faster than volume. The next test is sustaining that spread while fiscal 2027 GMV moves above $64 billion.
Street expectations
$92.47
Average analyst target
25 Buy · 9 Hold · 0 Sell
34-analyst consensus. The average target implies about 5.7% upside from the $87.51 premarket quote.
GAAP EPS of $4.62 included a $1.45 billion tax benefit. That boost is not a recurring operating result.
Sources: Affirm fiscal Q4 2026 earnings release and supplement; StockAnalysis premarket quote and analyst consensus; Barron's. U.S. dollars. Calculations may differ due to rounding.
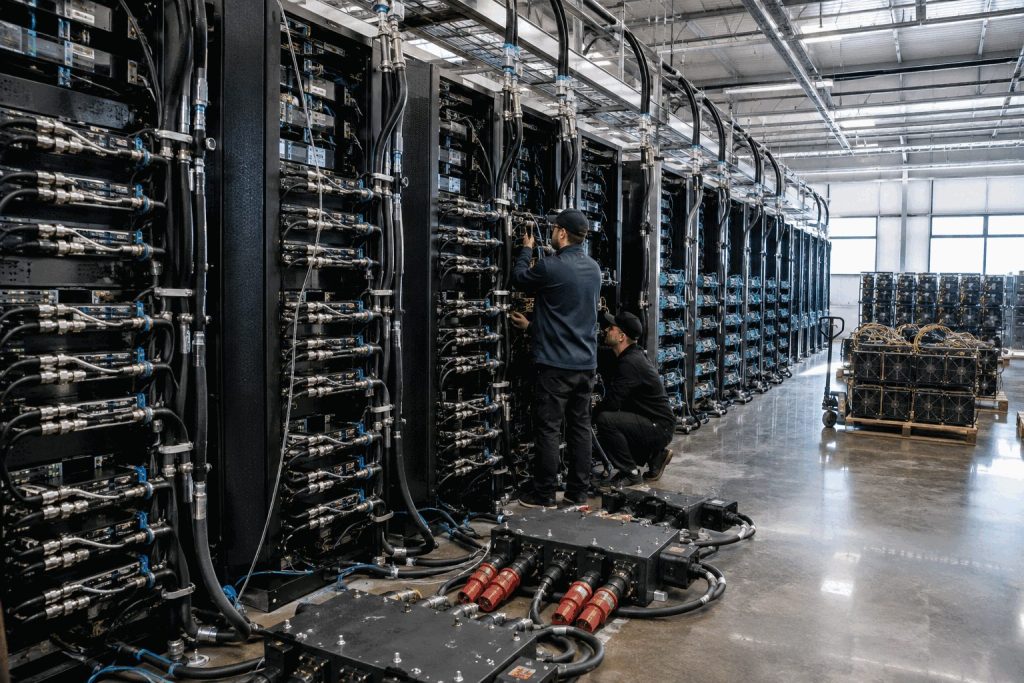
IREN Limited shares declined by 5.75% ahead of the market open on Friday, cutting approximately $833 million from its implied equity valuation.
·3 min read
IREN: AI Cloud crosses the revenue midpoint
FY2026 results and premarket reset · Market data at 07:14 EDT, August 28, 2026
Premarket price
$38.20
−5.75%
Implied value lost
~$833M
357.38M shares × $2.33
Premarket volume
1.25M
as of 07:14 EDT
Market value
$14.46B
prior-close basis
Quarterly revenue mix flipped
51.4% of Q4 revenue came from AI Cloud; Bitcoin mining supplied 48.6%.
ARR conversion ladder
Contracted ARR
$4.0B
Operating today
$1.0B
Q4 GAAP AI Cloud revenue
$70.5M
ARR is a non-GAAP operating metric. IREN warns recognized revenue may be materially lower. Commissioning and customer acceptance govern conversion.
Operating scorecard
US$ millions
Q4
Q3
Change
Total revenue
137.2
144.8
−5.2%
AI Cloud
70.5
33.6
+109.8%
Bitcoin mining
66.7
111.2
−40.0%
Adjusted EBITDA
19.2
59.5
−67.7%
Net loss
(684.0)
(247.8)
Wider
Capital architecture
$14B liquidity + commitments
$2.8B GPU financing
90% GPU capex financed
45–55% customer prepayments
Quarter-end cash and restricted cash: $7.62B.
Q4 operating cash flow: $1.81B, including a $1.72B increase in deferred revenue.
Deferred revenue supports cash flow before revenue recognition. It also creates delivery obligations.
Why the shares moved
The market is weighing a fast mix shift against its accounting cost. AI Cloud more than doubled sequentially, but adjusted EBITDA fell 68% and the quarter carried a $450.4M mining-hardware impairment.
The key question is no longer demand alone. It is how quickly contracted ARR becomes recognized revenue without further impairments, delays or financing strain.
The $4B contracted ARR figure is not recognized revenue. Timing, utilization, uptime and customer acceptance remain decisive.
Sources: IREN FY2026 results; MarketWatch quote and ownership data; Investors.com market report. Financial figures in U.S. dollars. Calculations may differ due to rounding.
Rubrik, Inc. stock dropped 6.7% in premarket trade on Friday, even after the company surpassed quarterly expectations. The slide wiped about $1.5 billion in…
·3 min read
NYSE: RBRK · Fiscal Q2 2027
Strong quarter, tougher expectations
Rubrik beat revenue and earnings estimates, then sold off before the open.
Market data: Aug. 28, 2026, 06:44 EDT Financials: quarter ended July 31, 2026
Premarket price
$99.84
−6.71% vs. $107.02 close
Implied value erased
≈$1.5B
Based on $22.03B market value
Quarterly revenue
$427.3M
+38% year over year
Subscription ARR
$1.66B
+33% year over year
Why the stock moved
The selloff reversed part of Thursday’s 11.3% surge. Premarket price remained 3.9% above Wednesday’s close, supporting an expectations-reset reading.
Operating scorecard
Metric
Q2 FY27
Signal
Revenue
$427.3M
+38%
Subscription revenue
$407.2M
+37%
Cloud ARR
$1.48B
+39%
$100K+ ARR customers
3,084
+23%
Free cash flow
$65.7M
15% margin
Guidance reset
Fiscal 2027
New range
Prior range
Revenue
$1.685B–$1.693B
$1.638B–$1.648B
Adjusted EPS
$0.47–$0.53
$0.25–$0.35
Subscription ARR
$1.880B–$1.885B
Raised
Free cash flow
$323M–$333M
Raised
Analyst expectations
Premarket
$99.84
Average target
$109.81
High target
$135
Twenty-eight analysts tracked by StockAnalysis rate the shares Buy or Strong Buy. New post-results targets included $115, $120 and $130.
SAN JOSE, California, August 28, 2026, 07:02 — PayPal Holdings Inc shares slumped 15.4% after the company called off its pursuit of a $53…
·2 min read
PayPal · NASDAQ: PYPL
Bid premium disappears; execution takes over
Premarket takeover-reset dashboard
$52.00▼ 15.41%
Aug. 28, 2026 · 06:52 EDT
Value erased*
≈$8.1B
Reported bid
$53B
TTM revenue
$34.13B
TTM net income
$4.90B
Price markers
Reported offer$60.50
Prior close$61.47
Premarket$52.00
Premarket price equals 86% of the reported offer. Shares had gained nearly 30% since the pursuit was reported.
Core question: can PayPal's turnaround deliver growth and margin expansion without merger optionality?
Operating and valuation signals
Shares outstanding855.46M
Forward P/E11.08×
2025 revenue growth4.3%
2025 earnings growth26.2%
Analyst consensusHold
Average target$60.57
Main risksCompetition · execution
Sources: Reuters, PayPal investor relations and StockAnalysis. *Estimated from the $9.47 premarket decline and 855.46 million shares outstanding. Market data is time-sensitive.
SELANGOR, August 28, 2026, 05:53 – Shares of Founder Group dropped 22.7% in premarket trading after the company carried out its second 100-for-1 stock…
·3 min read
Founder Group · NASDAQ: FGL
A second 100-for-1 split resets price, not value
Premarket and corporate-action dashboard
$0.14▼ 22.7% premarket
Aug. 28, 2026 · 05:53 EDT
Premarket volume
779,324
New ratio
100:1
Effective date
Sep. 1
FY2025 revenue
RM120.7M
Mechanical effect
Before10,000 sharesat $0.14 = $1,400
→
After100 sharesat $14.00 = $1,400
The split alone adds no cash, revenue or enterprise value. Market trading, fees and fractional-share treatment can change an investor's realized outcome.
Financial and listing signals
FY2025 revenue growth+33.6%
FY2025 net result≈RM7.3M loss
Displayed market cap≈$204K*
Published analyst consensusNone reliable
Immediate checkpointAdjusted open
Next verificationPost-split shares
Listing issueMinimum bid
Risk focus: thin dollar liquidity, wider spreads, dilution, financing needs and another Nasdaq compliance failure.
Sources: Founder Group announcement, fiscal 2025 annual report, investor FAQ and StockAnalysis premarket screen. *Displayed capitalization can be distorted around corporate actions; verify the post-combination share count. All market data is timestamped above.
Gap Inc. rose 13.8% to $23.66 ahead of Friday's session. The increase boosted implied equity value by roughly $1.03 billion compared to Thursday’s close.
·3 min read
NYSE: GAP · Fiscal Q2 2026
One strong brand, one much larger repair job
The Gap banner’s double-digit comp growth lifted profit expectations. Old Navy still controls the larger revenue pool.
Market snapshot: Aug. 28, 2026, 06:06 EDT Results released: Aug. 27, 2026, 16:15 EDT
Premarket price
$23.66
+13.80% from $20.79 close
Implied value added
≈$1.03B
$2.87 × 359.98M shares
Adjusted Q2 EPS
$0.52
$0.48 consensus · 8.3% beat
FY adjusted EPS
$2.35–$2.45
Raised $0.05 at both ends
Brand divergence: comparable sales
Gap
+10%
Banana Rep.
+3%
Old Navy
−4%
Athleta
−12%
Why Old Navy matters
Quarterly sales
$2.1B
About 2.5× the Gap banner’s $844M. A one-point Old Navy sales change carries more revenue weight.
Leadership catalyst
Michael Francis
Old Navy CEO effective Nov. 2, 2026
Quarter and outlook
Metric
Q2 / Current
Prior / Compare
Net sales
$3.65B
−2% YoY
Adjusted operating margin
7.1%
Profit beat
FY sales growth
+1.0%–1.5%
+1.0%–2.0%
FY adjusted margin
7.4%–7.6%
7.3%–7.5%
Q3 sales growth
+1.5%–2.5%
$3.9B base
Balance sheet and capital return
Cash + short-term investments
$2.5B
YTD operating cash flow
$550M
YTD free cash flow
$261M
YTD shareholder returns
$726M
Remaining buyback authority
$399M
Reported Q2 figures include a $417M tariff-recovery adjustment; adjusted measures exclude it.
Analyst expectations
$25.97
Average 12-month target across 20 analysts
Strong Buy
7
Buy
1
Hold
12
No Sell or Strong Sell ratings in the August snapshot.
Investor watchlist
NowCan the premarket premium hold after the open?Fall 2026Old Navy assortment and traffic are the main earnings swing factors.Nov. 2Francis formally takes charge of Old Navy.Q3 reportTest the 1.5%–2.5% sales-growth and 25–75 bps gross-margin guides.
Risk: Old Navy and Athleta remain negative; tariff and consumer-spending volatility can reverse the margin improvement.
E-Power Inc. soared 23.2% in premarket trading Friday, following the battery materials firm's announcement of its biggest technology contract to date. Shares changed hands…
·2 min read
NASDAQ: EPOW · PREMARKET
A contract larger than last year’s revenue
E-Power’s $51.1 million turnkey award opens a technology-services revenue stream. The market now needs payment milestones and margin disclosure.
Market data: Aug. 28, 2026, 06:30 EDT Contract announced: Aug. 27, 2026, 08:30 EDT
Premarket price
$0.55
Prior close: $0.448
Premarket move
+23.2%
Extended-hours quote
Premarket volume
15.7M
Shares by 06:30 EDT
Contract value
$51.1M
RMB343.473 million
Scale bridge
Measure
Value
Read-through
Turnkey award
$51.1M
Largest technology and equipment contract
FY2025 revenue
$46.4M
Contract equals roughly 110%
FY2025 revenue change
-28.6%
Base business contracted
FY2025 gross result
-$5.85M
Pricing and execution remain the hurdle
Year-end cash
$21.84M
Plus $6.31M restricted cash
Contract versus revenue
Contract value is not revenue. Recognition depends on delivery and acceptance.
Production-line scope
Artificial graphite
20,000 tons per year · automated line
Silicon-carbon
1,000 tons per year · CVD and carbonization
Delivery package
Design · equipment · installation · commissioning · training
What the share move is pricing
Positive signal
Open question
Technology-services entry broadens the model
No disclosed delivery schedule
Work is already underway
No payment milestones disclosed
Contract exceeds the prior-year revenue base
No expected gross margin disclosed
Industrial-scale silicon-carbon capability
Fixed-price cost-overrun exposure
Risk monitor
Execution: Fixed-price industrial work can suffer equipment inflation, commissioning delays and customer-acceptance disputes.
Economics: E-Power reported a negative 12.6% gross margin in 2025. The services margin is unknown.
Financing: An August private placement priced shares at $1.01, above the current quote, while increasing the share count.
Structure: E-Power is a Cayman holding company with Chinese subsidiaries, joint ventures and contractual arrangements.
Sources: E-Power contract announcement dated Aug. 27, 2026; E-Power 2025 Form 20-F filed May 15, 2026; Public.com extended-hours quote at 06:30 EDT on Aug. 28, 2026; SEC prospectus and Aug. 6 private-placement release. Values are rounded. No independent analyst consensus was available.
Propanc Biopharma declined 19.3% to $1.80 ahead of Friday’s session. Premarket trading volume totaled 438,319 shares at 06:09 EDT, data from StockAnalysis showed.
·3 min read
NASDAQ: PPCB · PRECLINICAL BIOTECH
Animal efficacy meets a financing reality check
Premarket snapshot: August 28, 2026, 06:09 EDT · PRP data released August 27, 2026
Premarket price
$1.80
Prior close: $2.23
Premarket move
−19.28%
438,319 shares
Thursday move
+108.41%
97.32M shares
Market value
$5.08M
Premarket screen
The two-day repricing
The premarket quote remains about 68% above Wednesday’s close.
Attention and liquidity
Thursday volume: 97.32M shares.
Recent average: about 9.76M.
Volume multiple: roughly 10×.
Small market value and float can amplify price gaps.
Evidence ladder
Claim
Reported result
Stage
What investors still need
Tumor control
>90% mean inhibition
Orthotopic and PDX animal models
Human dose-response evidence
Survival
>2.5× median extension
Animal models
Clinical survival data
Combination potential
Improved chemotherapy sensitivity
Preclinical
Safety and efficacy in patients
Regulatory path
CTA expected in coming months
Preparation
Filed and accepted application
Phase 1b
About 40–45 patients planned
Not started
Site activation and enrollment
Financial runway
Revenue, March quarter
$0
Quarterly net loss
$6.36M
Cash at March 31
$443,702
Subsequent financing tranche
$500,000
Loss / current market value
1.25×
Analyst coverage
1 Sell · no target
Financial figures are the latest disclosed quarterly data, not a current cash balance.
Investor bridge
PRP data can justify advancing into human testing.
It does not establish clinical efficacy or approval odds.
Manufacturing, assays and trial sites require cash.
Additional financing may dilute existing shareholders.
The next durable catalyst is execution, not another animal-model headline.
Sources: Propanc Biopharma releases dated August 27 and May 15, 2026; StockAnalysis premarket screen; MarketBeat analyst summary. Figures may change after the regular-session open.
MORRIS PLAINS, New Jersey, August 28, 2026, 05:58 - Shares in Solstice jumped 17.2% in early trade after the company announced its $14.5 billion…
·2 min read
NASDAQ: SOLS · PREMARKET
Solstice replaces deal risk with capital returns
Market snapshot: August 28, 2026, 05:58 EDT · Corporate announcement: August 27, 2026
Premarket price
$66.00
Prior close: about $56.34
Premarket move
+17.15%
64,488 shares traded
Market value
$8.95B
At 05:58 EDT
Buyback ceiling
$500M
About 5.6% of market value
What the market repriced
Merger: no termination feeBuyback: discretionary, not guaranteed spending
Investor bridge
The cancellation removes acquisition financing and integration risk.
The buyback could retire roughly 7.6 million shares at $66 if fully deployed at one price.
That arithmetic equals about 5.6% of the current equity value.
Management retains capacity for organic nuclear, electronics and refrigerant projects.
Operating scorecard
Metric
Latest / guidance
Read-through
Q2 2026 sales
$1.148B · +11% YoY
Broad demand growth
Q2 net income
$119M
Profitable operating base
Q2 adjusted EPS
$0.88
Above $0.77 consensus
FY2026 sales guide
$4.125B–$4.185B
Reaffirmed after merger exit
FY2026 adjusted EBITDA
$1.035B–$1.055B
24.8%–25.6% implied margin
FY2026 adjusted EPS
$2.75–$2.95
Unchanged
FY2026 capex
$420M–$440M
Heavy investment continues
Valuation and expectations
Premarket price / FY2026 EPS midpoint
23.2×
Analyst consensus
Buy · 7 analysts
Average 12-month target
$80.43
Target upside from $66 premarket
21.9%
52-week range
$40.43–$90.80
Analyst data checked August 28, 2026. Targets are estimates, not guarantees.
Next catalysts and risks
September–quarter results: sales guidance is $990M–$1.03B.
Buyback execution: filings will show whether authorization becomes actual demand.
Margins: plant outages and refrigerant transitions remain swing factors.
Cash conversion: $420M–$440M capex competes with repurchases.
Premarket liquidity: 64,488 shares is modest; the opening move may differ.
Sources: Solstice Advanced Materials’ August 27 merger-termination release and July 30 results; StockAnalysis premarket screen and analyst summary; Reuters transaction report. Market figures are time-stamped and may change after the open.