Shares of Toyota Motor Corporation declined 3.1% by mid-morning Wednesday after a Tacoma recall in the U.S. received renewed focus. However, the stock's fall…
·3 min read
Toyota Motor · TYO:7203
Recall headline, sector-sized move
Market snapshot: August 19, 2026, 11:10 JST Tokyo market open · TradingView data delayed 20 minutes
Relative move remains contained
Share price
¥2,929
-3.1% intraday
Vs. peer average
+0.5 pp
Toyota fell less
Vehicles recalled
48,280
Selected U.S. Tacomas
Consensus upside
24.5%
Target ¥3,647.1
Tokyo automakers — intraday move
Percent change
Signal: Toyota underperformed in absolute terms but outperformed the equal-weight Honda–Nissan–Suzuki average of -3.6%. The recall had not produced a clear company-specific discount in this snapshot.
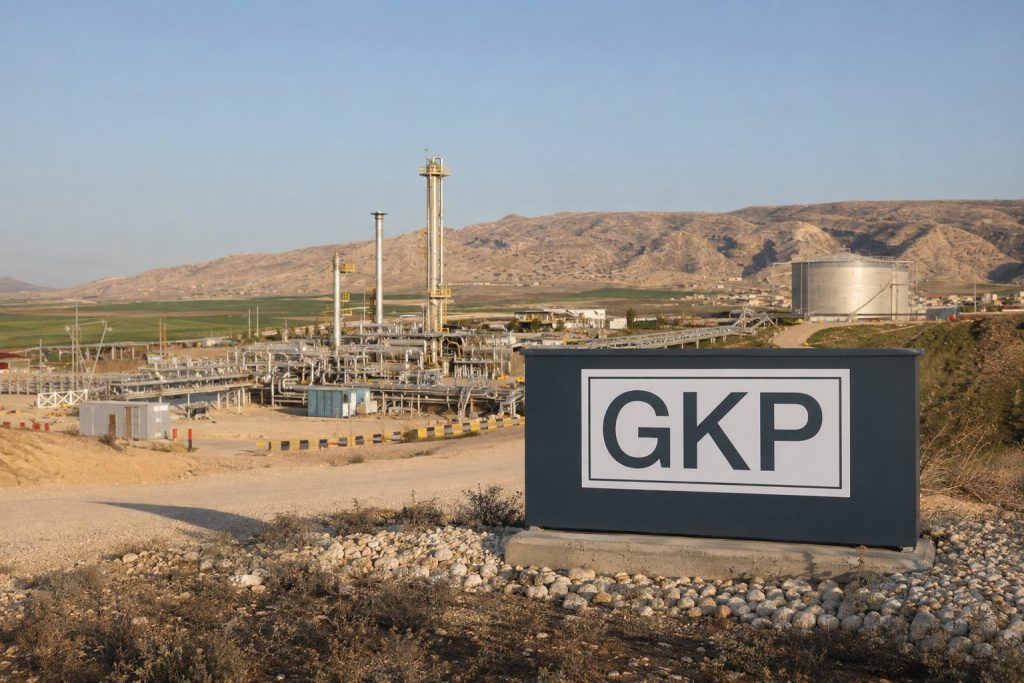
Shares in Gulf Keystone Petroleum Limited rose 1.24% on Tuesday, ending the session at 179.6 pence with the London market active. The market was…
·3 min read
Gulf Keystone Petroleum
LON:GKP · Shaikan field exposure
London market closed
Market data as of London close on 18 August 2026; snapshot taken at 02:25 BST, 19 August 2026.
Closing price179.6p▲ 1.24% on the day
Consensus target253.16p+41.0% implied upside
Market value£385.9mVolume 1.09× 30-day average
Price in relation to the recovery scenario
Shares continue to trade close to the bottom of the 52-week range, as stated targets are based on improved operational results.
Peel Hunt · 13 JulBuy · 277p
Canaccord · 20 MarBuy · 280p
Five-analyst poll4 Buy · 1 Hold · 0 Sell
The hinge mechanism
The stock’s potential gains hinge on the speed at which security allows Shaikan to restart production and exports.
Investor read-through: Tuesday’s 1.24% rise suggests investors still price a restart. The discount remains large because production, export timing and regional security are binary variables.
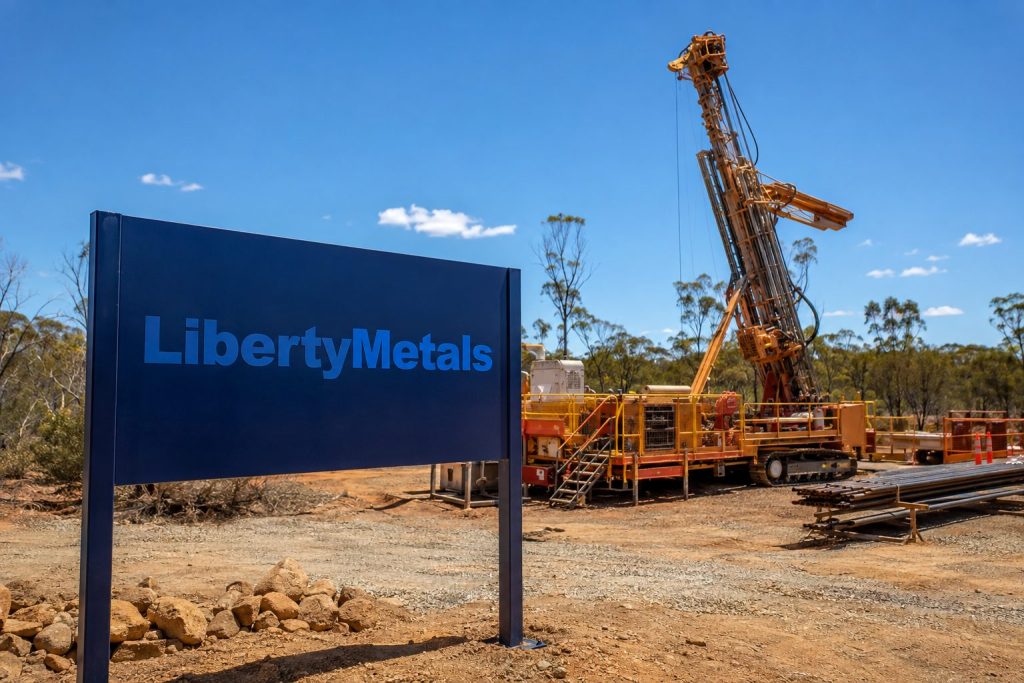
Liberty Metals Ltd led Australia’s most-active stocks on Wednesday. A 20-minute delayed TradingView snapshot showed 78.4 million shares changing hands at A$0.004. The price…
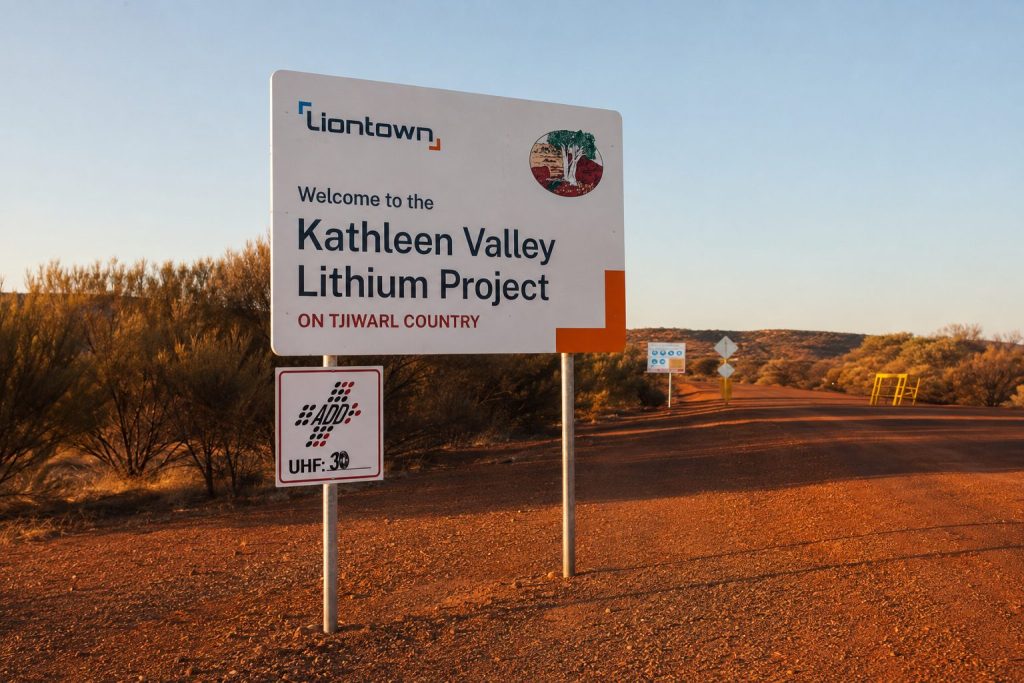
PERTH, August 19, 2026, 10:06 AEST — Shares of Liontown Limited opened Wednesday after sliding 7.3%, closing at A$1.205 on Tuesday with trading volume…
·3 min read
ASX:LTR · Liontown Limited
Strong cash position contrasts with significant peer discount
Market data: Official close at 4:10 p.m. AEST on August 18, 2026
Close price
A$1.205
August 18 saw a decrease of 7.31%
Volume traded
46.64 million
1.22 times the average over 30 sessions
Position within 52-week range
23.5 percent
Low of A$0.76 · High of A$2.65
Cash / maximum capital expenditure for FY2027
1.52 times
A$561 million in cash · Guidance at A$320–370 million
Tesla shares ended Tuesday down 0.72% at $336.87. The stock’s decline continued despite reports of an August Cybercab rollout. Scaling remains the main challenge:…
·4 min read
Investor dashboard · NASDAQ:TSLA
Tesla Robotaxi scale test
Market closed August 18, 2026 · 4:00 PM ET Prices in U.S. dollars
Closing price
$336.87
▼ 0.72% · $2.43 below Monday
52-week: $297.38–$498.83
Seven-session price path
Autonomous-mile scale
10.5× gap
Tesla paid unsupervised miles, cumulative0.38M
9.5%Waymo rider-only miles, weekly4.0M
100%
Tesla’s cumulative disclosed unsupervised total equals about 0.67 day of Waymo’s weekly pace.
Service footprint
6 vs 10
Cities with Tesla unsupervised miles versus Waymo paid rides.
First-half cash bridge
Operating cash flow$8.63B
Capital spending$8.28B
Residual after capex$0.35B
Derived from Tesla’s six-month cash-flow statement; before other investing uses.
Q2 earnings base
$28.24B
Revenue, up 26% year over year.
$1.11B
Net income attributable to common holders.
Analyst target map
The $402.24 consensus implies 19.4% upside; published targets span $25.28 to $600.
What changes the thesis
Watch weekly unsupervised miles, rides per vehicle and revenue per mile—not only the number of Cybercabs produced.
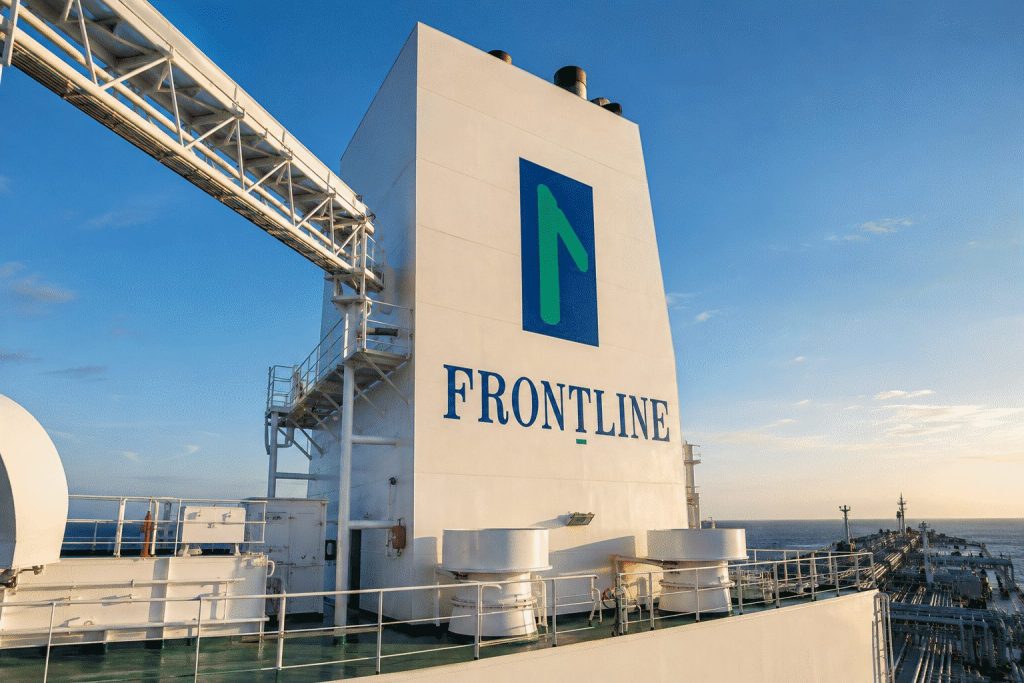
Shares of Frontline plc are approaching analysts' price target, with persistently sluggish tanker movement through the Strait of Hormuz supporting strong freight market conditions.…
·3 min read
Investor dashboard · NYSE:FRO
Frontline: rate surge already closely reflected in valuation
Market data at 16:00 EDT, August 18, 2026 · USD unless stated
MARKET CLOSED
Close
$43.50
+3.13% Tuesday
Since Aug. 11
+14.1%
$38.14 → $43.50
Consensus upside
+1.7%
$44.25 average target
Special dividend
$0.80
Planned after VLCC sale
Prices advance for six straight sessions
Q2 spot TCE booked compared to cash breakeven
Overview of peer valuations
CompanyCloseP/ETarget upside
Frontline · FRO$43.5010.70x+1.7%
DHT Holdings · DHT$19.316.56x+6.3%
Scorpio Tankers · STNG$79.344.91x+21.0%
Teekay Tankers · TNK$89.105.25x+1.0%
Analyst estimates
Upside caseDownside case
Key points to watch
Hormuz trafficSix commodity crossings Monday; no recorded VLCCs.
August 31Q2 results, realized rates and Q3 booking update.
Capital return$179M expected net proceeds; $0.80 special dividend planned.
Verizon Communications closed 1.00% higher at $48.54 on Tuesday as a fresh Downdetector search spike drew attention to customer outage reports. The reports were…
·3 min read
VZ✓
Verizon investor dashboard
NYSE:VZ · cash returns outweigh an unverified report spike
Official close August 18, 2026 · 4:00 p.m. EDT
Close
$48.54
+1.00% on August 18
YTD price return
+19.79%
Excludes dividends
Gross capital return
≈8.04%
Dividend + buyback target
Relative to SPY
+1.67 pts
August 18 session
30-session price path
Jul 8–Aug 18 · +14.35%
Capital-return stack
Dividend5.83%
Buyback target≈2.21%
Annual dividend$2.83
Buyback yield uses the $4.5B maximum target and about 4.2B shares. It is not guaranteed.
Operating momentum · Q2 2026
Adjusted EBITDA$13.7B · +7.2%
Free cash flow$6.4B · +24.4%
Service revenue$23.4B · +2.8%
184K phone net adds348K broadband adds
Analyst target range
26 analysts · Buy
$44 low$51.56 consensus$71 high
Consensus price upside+6.22%
Targets exclude the 5.83% dividend yield.
Peer scorecard · August 18 close
Security
Close
Move
Verizon VZ
$48.54
+1.00%
AT&T T
$24.90
+0.89%
T-Mobile TMUS
$182.75
+1.46%
S&P 500 ETF SPY
$767.45
-0.68%
VZ volume: 14.4M, about 0.60× its 30-session average.
Outage-report context
Jan 14>1.5M cumulative reports; 10+ hoursVZ +2.10%
Aug 8>13K reports; voice service restoredNext session -0.06%
Aug 18Search spike; scope and cause unverifiedVZ +1.00%
Investor read: report volume has not produced a consistent stock response. Verified duration, credits and churn matter more.
Australian stocks were poised to begin Wednesday’s session weaker. The S&P/ASX 200 closed Tuesday at 9,070.0, down 3.2 points, or 0.04%. At this update,…
·4 min read
Australia · pre-open investor brief
Cash market pre-open
The index remains flat, but volatility among individual stocks is high.
Healthcare climbed, but lingering weakness in banks kept the benchmark unchanged. As financials and materials make up 59.23% of the index, sector leadership outweighs market breadth.
Snapshot taken at 19 Aug 2026, 08:55:36 AEST (UTC+10). Regular ASX trade starts at 09:59:45 AEST, followed by a randomised 15-second opening window. ASX hours
S&P/ASX 200 close9,070.0−3.2 · −0.04% 18 Aug 2026 close; reported 16:29 AEST (UTC+10) by ABCFive-session move−1.95%11 Aug close to 18 Aug close; daily closes available after the ≈16:11 AEST CSPABelow record high−2.44%9,296.7 intraday high on 6 Aug vs 9,070.0 on 18 Aug, both AEST sessionsRBA cash rate4.35%Current at 19 Aug 2026, 08:55:36 AEST (UTC+10); held on 11 Aug. RBA
Five consecutive declines wiped out the early-August gains
S&P/ASX 200 daily closing values from 4 to 18 Aug 2026; AEST trading sessions (UTC+10)
Momentum: defensive
9,145.84 Aug close
9,271.66 Aug closing high
9,070.018 Aug close
Series: Investing.com historical data. Closing prices are provided after the ASX closing auction, typically finishing at around 16:11 Sydney time.
Why an ≈+8.1% rise in healthcare failed to boost the index
Index weights as of 18 Aug 2026 close; source does not specify clock time or time zone
Investor read-through: The session lacked widespread calm, with only a niche segment posting a sharp recovery. Banking-heavy core areas continued to act as a drag on the index.
Shares to be paid a fully franked dividend of A$2.70 each. The ex-date starts at the ASX opening phase on 19 Aug 2026 at 09:59:45 AEST (UTC+10). This may exert automatic downward pressure on the price index, all other factors being unchanged. CBA dividend
19 Aug · 11:30 AESTJune-quarter wage data
The Wage Price Index will be released at 11:30 AEST (UTC+10). The previous quarter climbed 0.8%, with annual growth at 3.3%. This data has the potential to shift rate forecasts for the banking, property, and retail sectors. ABS schedule
19 Aug 2026 · AESTReporting-season dispersion
Santos, Evolution Mining, Temple & Webster, Breville, Mirvac and Whitehaven Coal are listed as companies due to release reports. The source did not specify exact release times. Morningstar/AAP
Primary sources:
ABC market closeRBA decisionASX trading hoursData-quality note: there was no verified, time-stamped official SPI 200 pre-open quote at 08:55:36 AEST, so the futures figure is omitted. The calculated values are 59.23% (32.61% plus 26.62%), −1.95% (from 9,250.6 down to 9,070.0), and −2.44% (from 9,296.7 to 9,070.0).
Shares of Aurora Innovation dropped 11.8% on Tuesday to close at $6.15, wiping out roughly $1.64 billion in implied market value in a single…
·4 min read
Aurora Innovation · NASDAQ:AUR
Scale promise meets a cash-flow test
Market snapshot: August 18, 2026, 16:00:01 EDT · U.S. market closed
▼ 11.8% session
Closing tape
$6.15
−$0.82
Day range$5.92–$6.50
Five sessions−11.5%
52-week range$3.60–$8.57
Market cap$12.33B
Eight-session price and volume
CloseVolume77.1M shares · 2.83× three-month average
One-day repricing versus financial capacity
$1.64BImplied value erased Tuesday
$1.22BCash + short-term investments
$384MFirst-half operating cash use
Tuesday's implied value loss was 1.35× liquidity and 4.28× first-half operating cash burn.
Operating bridge
Q2 revenue$2M
Q2 operating loss$266M
Year-end fleet target200 trucks
October production run-rate1,000/year
Driverless miles at June 30≈440,000
August 18 autonomy-exposure moves
Aurora
−11.8%
Tesla
−0.7%
Amazon
−0.7%
Alphabet
+0.1%
Different business models; shown as public-market autonomy exposure, not operating equivalents.
Analyst map
8Buy / strong buy
5Hold
0Sell
$3.59 low$6.15 close$11.22 avg$18 high
The fivefold target range signals wide uncertainty around timing, utilization and eventual margins.
Next decision points
AUG 19
Federal Reserve minutes, 14:00 EDT. Higher yields can weigh on long-duration growth valuations.
AUG 20
Retail investor town hall, 12:00–12:30 EDT. Watch utilization, paid loads, revenue per truck and hardware cost.
OCT
Roush production milestone. Targeted annual run-rate reaches 1,000 Aurora-equipped trucks.
Risk frame
Upside: faster deployment or better unit economics. Downside: delays, weak pricing, safety events or further dilution.
vs. 200-day average+17.1%
vs. 52-week high−28.2%
Sources: Aurora Innovation Q2 2026 Form 10-Q and company releases; Yahoo Finance market data; StockAnalysis/S&P Global analyst compilation; Reuters market report. Calculations use approximately 2.004 billion shares outstanding. Figures may be rounded.
Shares of The Clorox Company edged down 0.37% to $105.55 on Tuesday. Hidden Valley Ranch sales have started to feel the effects of a…
·3 min read
NYSE: CLX · Investor dashboard
Clorox: salad concerns and slim organic growth margin
As of 4:00 p.m. EDT on August 18, 2026, the U.S. market had closed, with market data reflecting this time.
Outbreak data checked Aug. 18, 2026
Close
$105.55
−0.37% Tuesday
Year to date+5.3%
52-week range$84.70–$128.90
Hidden Valley signal
−5%
Four-week dressing sales
Share of U.S. retail sales11%
Implied drag*−0.55%
Preliminary estimate
FDA outbreak scope
9,481
Confirmed illnesses
Since August 5+49.1%
Hospitalizations398
States17
Company exposure: minor brand decline, greater projected impact
Budget structure
FY26 net-sales growth−5%
FY27 sales outlook+13% to +14%
FY27 organic outlook+3.5% to +4.5%
FY27 adjusted EPS$5.70–$6.00
GOJO contributes roughly 9.5 percentage points to the projected sales growth, while the ERP comparison adds over 3.5 points to organic growth.
Highlighted analyst targets following earnings
Firm
View
Target
Vs. close
RBC Capital
Sector Perform
$110
up 4.2%
UBS
Neutral
$105
down 0.5%
Wells Fargo
Equal-Weight
$102
off 3.4%
Evercore ISI
Underperform
$99
lower by 6.2%
JPMorgan
Underweight
$95
down 10.0%
Selected targets published August 4, 2026. Five-target average: $102.20, or 3.2% below the August 18 close. *Implied drag equals 11% category exposure multiplied by a 5% sales decline; it is not company guidance. Sources: MarketWatch/TD Cowen/Nielsen, FDA, Clorox, FactSet and published broker notes.
Shares of Weyerhaeuser Company declined 1.95%, closing at $23.61 on Tuesday. The decline followed moves by the Trump administration to push ahead with plans…
·4 min read
WY
Weyerhaeuser investor dashboard
NYSE: WY · Timberlands, wood products and U.S. forest policy
Market data as of August 18, 2026, 4:00 PM EDT Policy and analyst data checked August 18, 2026
Close
$23.61
NYSE close · USD
Daily move
−1.95%
Third straight decline
52-week position
$21.16–$27.75
14.9% below the high
Forward income
3.56%
Indicated yield at $0.84 annualized
Four-session price path
Closing prices · August 12–18, 2026
−4.64% across the plotted period
The acreage scale
Millions of acres; area is policy scope, not forecast harvest
Full roadless rule
59.0m
Proposed scope
44.7m
WY U.S. base
>10.0m
4.4×+ · Proposed federal acreage versus Weyerhaeuser's owned or controlled U.S. timberlands.
The proposal returns decisions to local managers. It does not mandate roads or logging.
Q2 2026 earnings mix
Adjusted EBITDA · $ millions
Total company
$310m
Wood Products
$129m
Strategic Land
$129m
Timberlands
$123m
Wood Products rose $58m sequentially as lumber realizations improved 15%. Segment values do not sum to consolidated EBITDA.
Analyst setup
Consensus available August 18, 2026
Buy / strong buy
7
Hold
4
Sell0
Low$26
Average$29
High$31
Avg. upside22.8%
Published targets predate the August 18 forest proposal.
↔
Investor read-through
More federal timber could eventually pressure private log realizations, especially in the West. Cheaper fiber may help company mills. The net effect depends on local sales, road funding and housing demand—not the headline acreage alone.
The iShares MSCI Mexico ETF slipped 0.60% on Tuesday, but Mexico's robust peso shielded the fund from the sharper declines seen in broader emerging…
·4 min read
iShares MSCI Mexico ETF · NYSE Arca: EWW
Peso cushion, equity test
Market close: August 18, 2026, 4:00 p.m. EDT · FX observation: August 18, 2026, 6:07 p.m. EDT
U.S. market closed
EWW close
$74.46
▼ 0.60% Tuesday
Range: $74.32–$75.28
2026 price return
+6.89%
Distributions excluded
252-session return: +21.57%
USD / MXN
17.055
Peso ▼ 0.15% on day
Dollar −1.99% over 20 sessions
Relative defense
+2.34 pts
EWW vs. EEM Tuesday
EWW −0.60% · EEM −2.94%
EWW: last 30 sessions July 2–August 18, 2026
Tuesday peer scorecard
Vehicle
Close
Move
EWW · Mexico
$74.46
−0.60%
SPY · U.S.
$767.45
−0.68%
ILF · LatAm
$33.23
−1.22%
EEM · Emerging
$65.34
−2.94%
Fund fundamentals latest issuer data
Metric
Reading
As of
Holdings
39
Jul. 30
Price / earnings
13.65×
Jul. 30
Expense ratio
0.50%
Prospectus
30-day SEC yield
2.62%
Jun. 30
Sector concentration share of market value
Materials25.45%
Consumer staples24.83%
Financials17.38%
Industrials11.83%
Communication10.46%
Top five sectors: 89.95% of assets · BlackRock data as of July 17, 2026
Policy and forecast gap
Banxico policy rate6.50%Hold
Reuters poll34 / 35Expected hold
UBS Q4 USD/MXN18.20Spot 6.3% lower
Old Reuters 12m median18.92Spot 9.9% lower
Lower USD/MXN means a stronger peso. Dated forecasts are benchmarks, not live recommendations.
Investor read-through
The peso cushion limited EWW's loss during a broad emerging-market selloff. The setup weakens if USD/MXN moves decisively away from 17 or if EWW breaks Tuesday's $74.32 low.
Banco Santander, S.A. ADRs fell 2.4% to $14.24 on Tuesday. Volume reached 50.8 million shares, almost five times the three-month average. The NYSE cash…
·3 min read
Banco Santander · NYSE:SAN
High volumes, broader repricing
The ADR’s implied value drop of $5.0 billion amounted to almost 58 times the settlement reached by all six banks. Santander’s specific share was not made public and is less than the combined amount.
Market snapshot: August 18, 2026 · 16:04:33 EDT (U.S. ADR data) · 17:44:00 CEST (Madrid share data)
CLOSED
$14.24
−2.40% · −$0.35
NYSE ADR · 52-week range $9.31–$15.00
Price and volume across six sessions
Adjusted closing prices from August 11 to August 18, 2026. The last trading session saw a decline accompanied by a surge in trading volume.
50.8mshares traded
4.94×3-month average
−3.20%five sessions
$202.9bnclosing market cap
Settlement compared to value loss
Scale comparison in U.S. dollars, using the same currency basis.
57.7×
implied value loss / full six-bank settlement
Value lost$4.99bn
Settlement$86.4m
Comparison reflects the upper bound only. Santander's portion of the settlement remains confidential; the movement in the market cannot be attributed to a single factor.
Competitor tape
U.S. ADR movements for August 18, 2026, captured at 16:04:33 EDT.
Santander trailed all peers by no less than 2.0 percentage points. The bank's 20-day volume multiple stood at 3.94×, compared to every peer's figure of under 0.85×.
Most recent operating base
Published July 2026; where available, growth rates shown in constant euros.
€3.77bnQ2 underlying profit · +17%
€7.33bnH1 underlying profit · +15%
14.0%CET1 capital ratio
15.6%return on tangible equity
42.8%Q2 efficiency ratio
182mcustomers · +12m year on year
Analyst consensus
S&P Global's consensus from 20 analysts on Madrid shares.
Strong buy11
Buy6
Hold2
Sell1
Map of target
Madrid settled at €12.454 as of 17:44:00 CEST on August 18, 2026.
What investors are monitoring next
Fed minutesAugust 19 · 14:00 EDT / 20:00 CEST. Yield and dollar moves can dominate ADR trading.
Settlement approvalThe $86.4 million preliminary agreement requires Manhattan federal-court approval.
Capital executionBrazil minority exchange and the Webster acquisition shape 2028 earnings and capital targets.
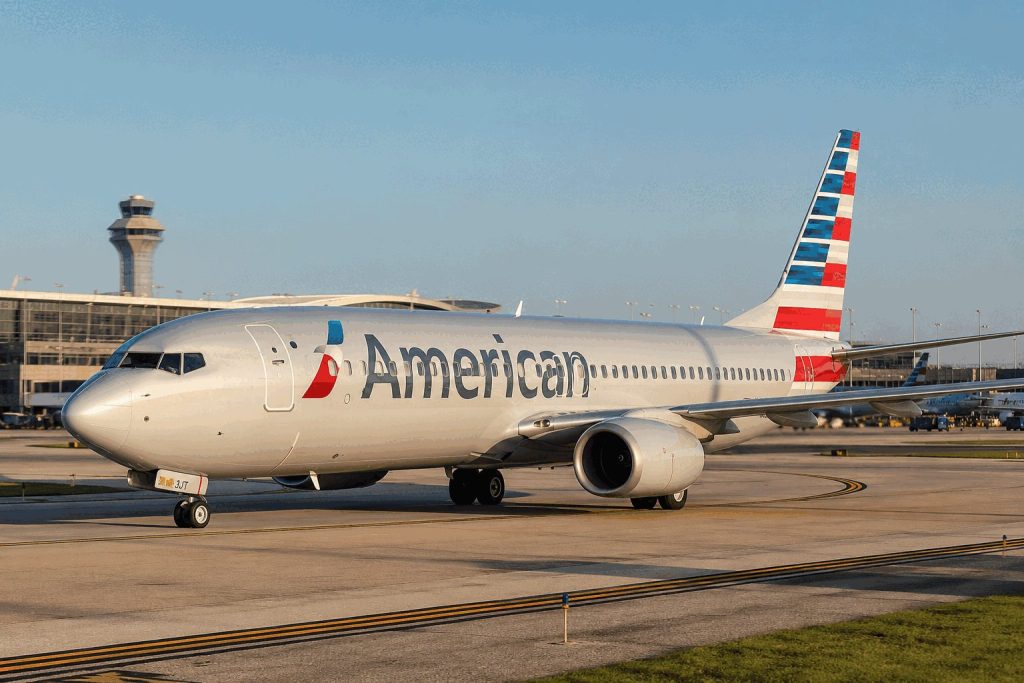
American Airlines Group Inc. fell 2.6% on Tuesday after an O’Hare tire incident drew national attention. Yet the stock’s move looked sector-wide, not company-specific.…
·4 min read
Investor dashboard · NASDAQ:AAL
American Airlines
Premium growth is the thesis. Margin conversion is the test.
$14.05
▼ 2.63% · Aug. 18 close
4:00:01 p.m. EDT · USD
Market cap
$9.30B
661.97M shares
Q2 revenue
$16.74B
+16.3% year over year
Q2 operating margin
2.8%
Calculated from $471M income
Consensus target
$19.36
37.8% above the close
Profitability gap · Q2 2026
American
2.8%
United
5.5%
Delta
7.9%
American needs roughly 5.1 percentage points of operating-margin improvement to match Delta’s Q2 level.
Premium-capacity reset
Premium travelers: ~30% of seats, nearly 50% of Q2 ticket revenue. Implied revenue per seat: about 2.3× nonpremium.
Aug. 18 airline tape
Analyst map
View
Count
Range / marker
Buy
8
High target $25
Hold
6
BofA $17 · Aug. 17
Sell
1
Low target $13
Average
15 analysts
$19.36
Target spread: $13–$25. Wide dispersion signals execution and fuel uncertainty.
What matters next
FAA investigationFlight 386 landed safely after two blown tires. No injuries were reported; the aircraft entered inspection.
Cabin retrofit starts in 2028More than 800 narrowbody jets are slated for seatback screens; program cost remains undisclosed.
Margin evidenceInvestors need premium revenue to convert into profit, not just record sales.