Investor Dashboard

Anthropic's cloud commitments now total $175 billion following a recent Lambda deal. The $35 billion agreement raises its funding requirements, positioning the company ahead of a potential initial public offering.
Category hubBreaking
Follow the latest TechStock² reporting, investor analysis and material developments for Breaking in one continuously updated topic hub.
Source: Bloomberg reporting via Yahoo Finance, published August 31, 2026. Amounts are reported contract values, not present-value debt.
Illustrative cost index. Fable 5 equals 100.
Source: Anthropic, September 1, 2026. The company estimates 25% typical savings and up to 45% for highly agentic work.
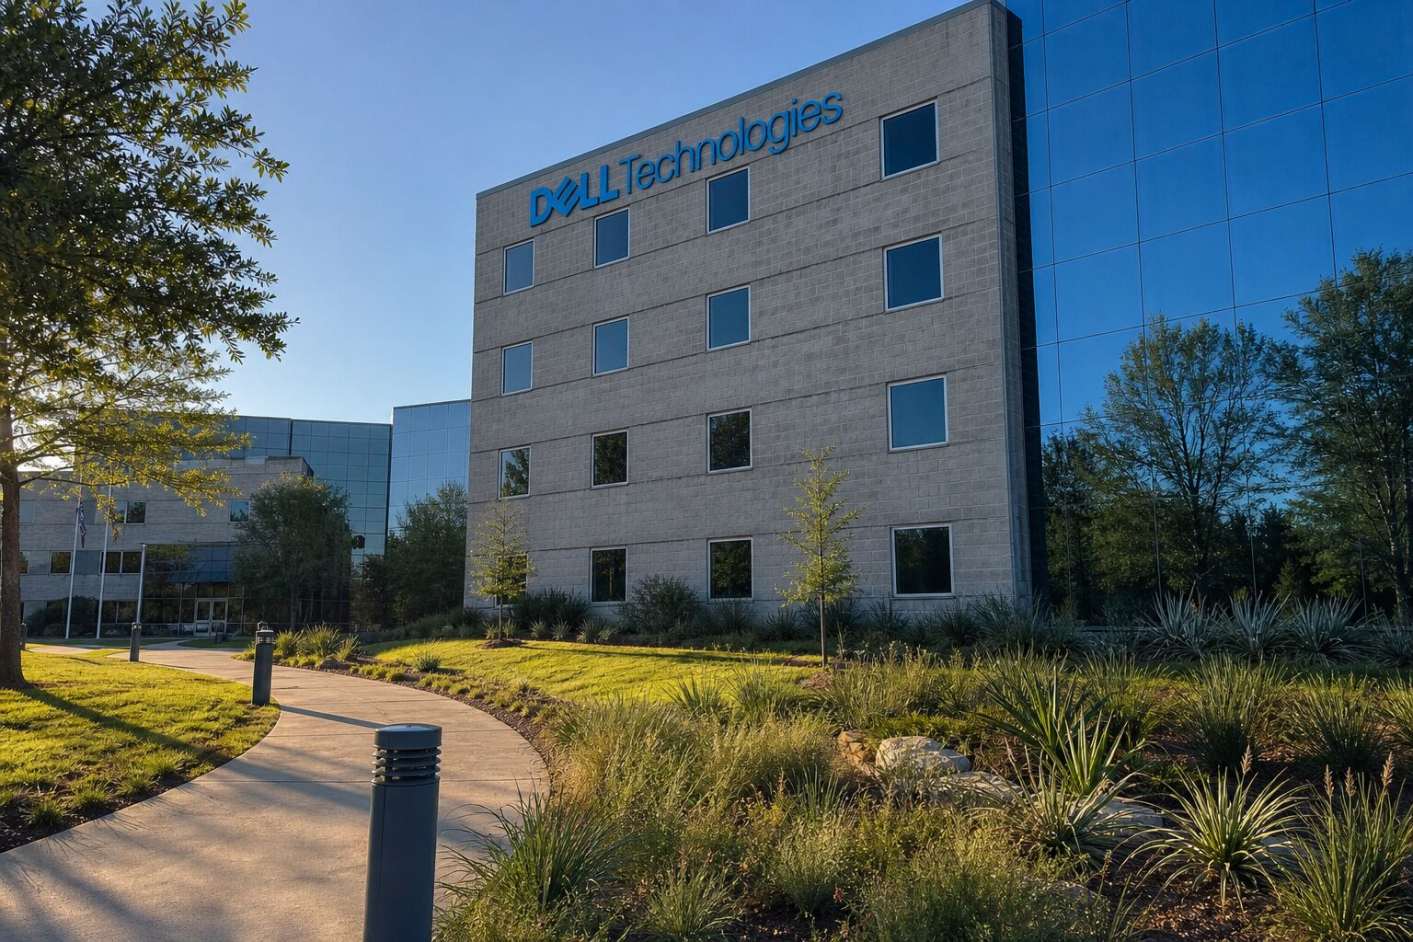
Company guidance issued September 1, 2026. Percentages calculated from reported midpoints. Source: Dell Technologies
Ratios calculated from company figures reported September 1, 2026. Source: Dell Technologies
Fifteen named target actions compiled September 2, 2026; median calculated from the listed targets. Source: Benzinga
U.S. dollars per share, selected one-minute observations
As of . Source: Yahoo Finance one-minute quote history. Extended-hours prices can be thin. Values are rounded.
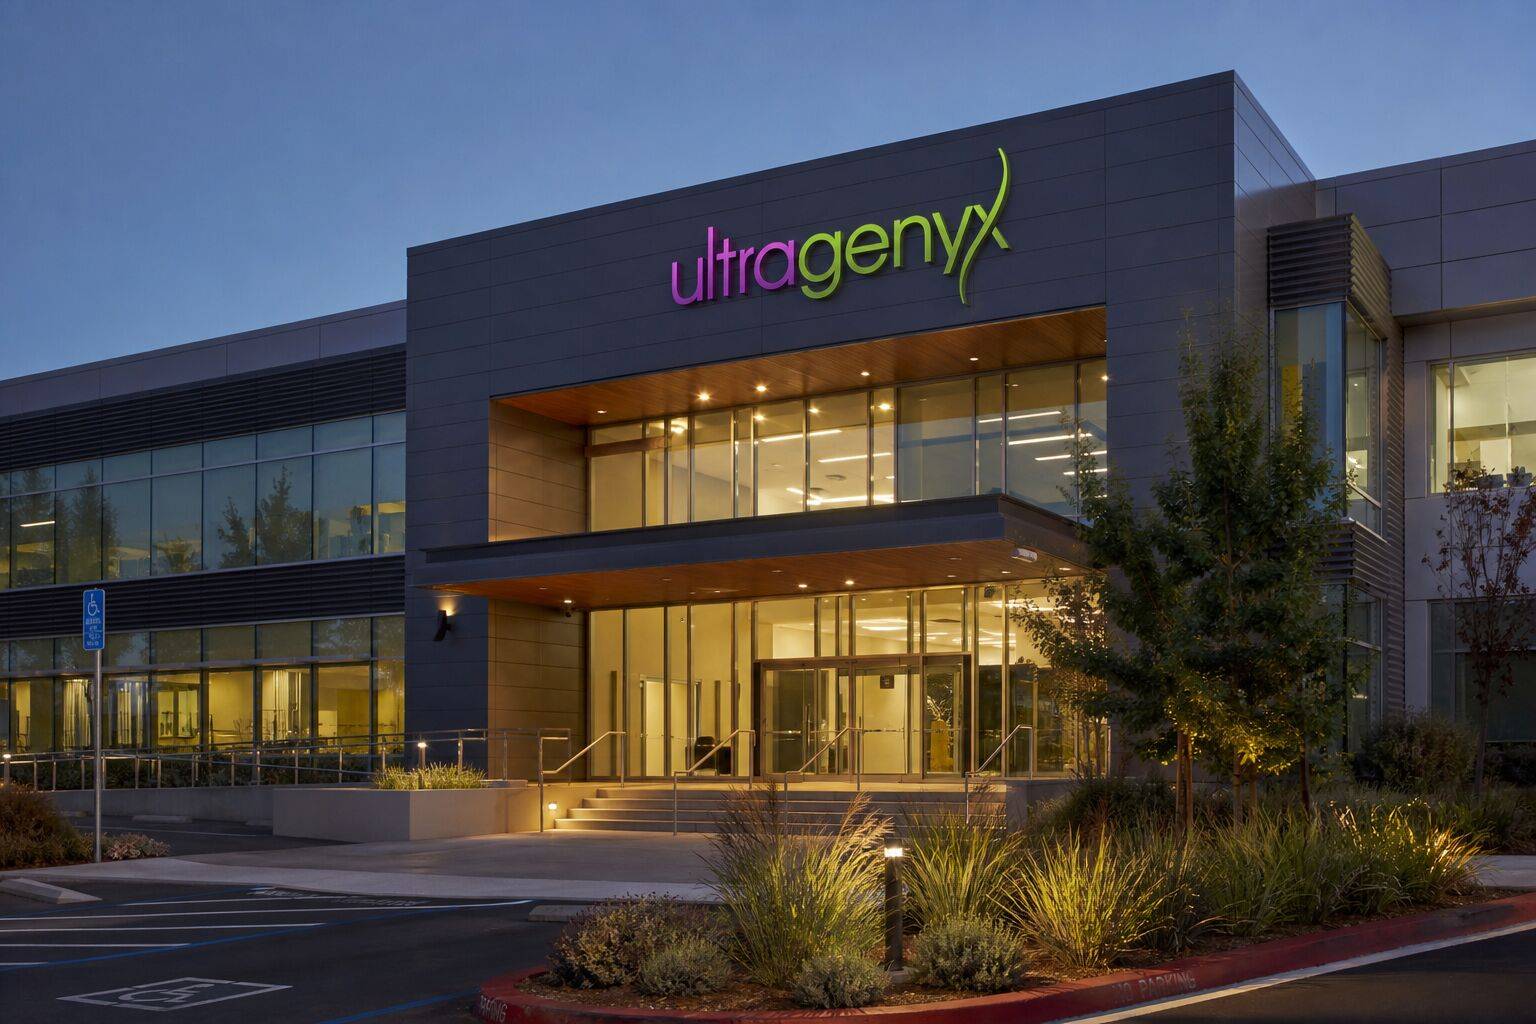
Second-quarter 2026 revenue mix; total revenue was $214 million
Rounded shares may not sum to 100%. Source: Ultragenyx Q2 2026 results, August 4, 2026.
Sources: FDA, Aspire release and Ultragenyx catalyst guidance.
. Solid line: regular session; dashed blue line: after hours.
Source: Yahoo Finance quote and five-minute data. Prices in U.S. dollars.
Monthly vehicles; bars use a 45,000-unit scale.
Investor read-through: the high end of September's implied range remains 3.4% below June.
Sources: NIO's June delivery update, Q2 results and Q3 outlook, and August delivery update.
Nine ratings issued or maintained within the past three months.
Source: Google Finance, viewed September 2, 2026, 19:32 EDT. Targets are analyst estimates, not guarantees.
Regular-session return and change from 18:00 to 19:00 ET
Regular-session change and official closing level, 16:00 ET
Source: Associated Press closing data, September 2, 2026.
Regular-session return; each half spans 2 percentage points
As of the September 2 close. Source: Yahoo Finance delayed close data for XLB, XLF, XLV, XLE, XLK and XLRE.
Change from the 16:00 close to the latest quote at or before 19:00 ET
As of . Source: Yahoo Finance delayed quotes for SNOW, FIVE, AVGO, HPE and NTAP. Percentages are calculated and rounded.
U.S. dollars per share. As of .
Source: Yahoo Finance historical market data. Values are regular-session closes.
Regular-session change on September 2, 2026.
Source: Yahoo Finance. Changes use September 1 and September 2 closes.
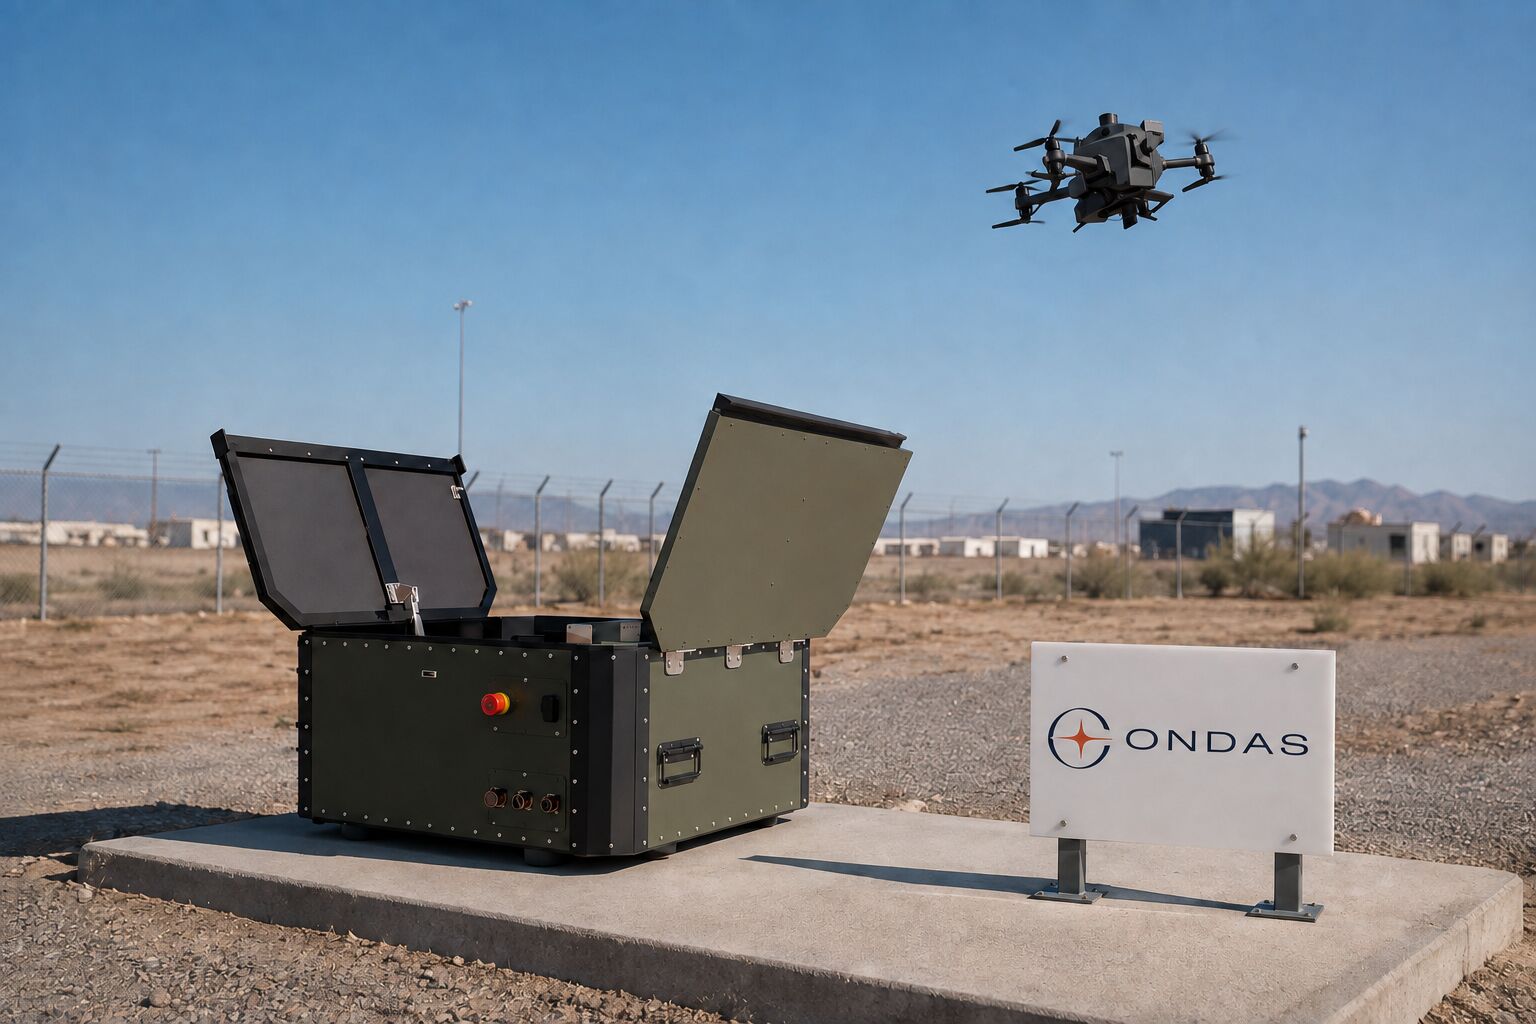
U.S. dollars; Q3 and Q4 figures are estimates based on management guidance.
Bridge: $537.5m full-year midpoint − $133.9m H1 actual − $147.5m Q3 midpoint = $256.1m implied Q4 revenue. Endpoint combinations imply a $236.1m-$276.1m range.
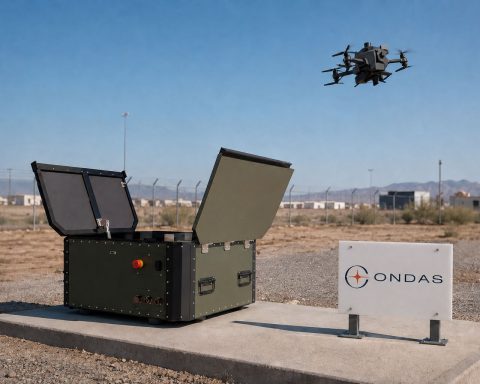
Source: Ondas second-quarter results and guidance. Calculations by TS2.
Dollars per share; premarket through aftermarket
As of . Source: Nasdaq. Extended-hours prices can be thin.Second-quarter 2026 adjusted operating income margin
Q2 2026 year-over-year change
Ratings issued during the past three months
U.S. dollars; regular close shown as a dashed line.
As of .
Fiscal third-quarter revenue growth from a year earlier.
Source: HPE fiscal Q3 2026 results, reported September 2.
Source: HPE fiscal Q3 2026 results.
Nasdaq price in U.S. dollars; previous close was $179.92.
As of . Source: Yahoo Finance. Five-minute observations are sampled hourly for display.
Quarter ended June 30, 2026. Bar scale tops at 160%. Source: Palantir's SEC-filed results.
Based on 23 analysts over the prior three months; price at . Source: Google Finance.
U.S. dollars; regular session
As of . Source: Yahoo Finance. Delayed market data.
Publicly disclosed terms; confidential provisions are excluded.
Sources: Pfizer and its annual report.
Year-over-year operational revenue change; bar length shows absolute change.
Quarter ended June 28, 2026. Source: Pfizer.
Session change at about 15:15 EDT; bar height is scaled to percentage gain.
As of September 2, 2026, about 15:15 EDT. Source: Yahoo Finance quote data for PFE, JNJ, MRK, LLY and ABBV.
Change from each asset's first regular-session five-minute close.
As of . Source: Yahoo Finance intraday data. Five-minute closes; not live streaming.
Sources: BitMine August 31 release and May 31 Form 10-Q. Estimate uses 603.23 million shares, the $280 million preferred liquidation claim and $30.1 million of May 31 liabilities. Rounded figures may not add.
Per-share estimates hold all non-Ether marks, liabilities and share count constant. Sources: company filings, Nasdaq and Yahoo Finance. Values are scenarios, not forecasts.
Source: Yahoo Finance five-minute data. Labels show observed prices, not a live stream.
Year-over-year change; common scale runs from 0% to 200%
Source: Grab Q2 2026 results, reported August 4. Measures have different bases.
Q2 2026, USD millions; bars share a $320 million scale
Source: Grab Q2 2026 results. These are reported measures, not a reconciliation.
Source: S&P Global consensus via StockAnalysis, retrieved September 2. Targets are estimates, not outcomes.
NYSE price in U.S. dollars; previous close $413.58
Second-quarter 2026 year-on-year change; bars share a 0%–12% scale
HCA’s revised 2026 assumptions; midpoint arithmetic in U.S. dollars
Closing price, Australian dollars. Latest verified quote: .
Source: Yahoo Finance delayed ASX data. Values are completed-session closes, not live prices.
Source: Technology Audit Partners findings report, released September 2, 2026. Times are AEST.
Sources: ABC News and Telstra FY26 results. Percentages are calculated from disclosed figures.
U.S. dollars; five-minute closes selected from the regular session
As of . Day range: $364.65–$370.39. Source: Yahoo Finance; prices are not live-streaming.
Broadcom-reported revenue and management guidance, in billions of dollars
Sources: Broadcom fiscal Q3 2025 and fiscal Q2 2026. The $16.0 billion figure is guidance, not a reported result.
Reported quarter ended May 3, 2026
Source: Broadcom fiscal Q2 2026 results and Form 10-Q. Margins use company definitions.
49 analysts · consensus Strong Buy
The target implies about 43% upside but is not a forecast of near-term results. Sources: Kiplinger citing S&P Global Market Intelligence; current price from Yahoo Finance as of September 2, 2026, 11:00:42 EDT.
Dollars per share, late premarket through the first 13 regular-session minutes
As of . Source: Yahoo Finance. Premarket quotes may show zero volume.
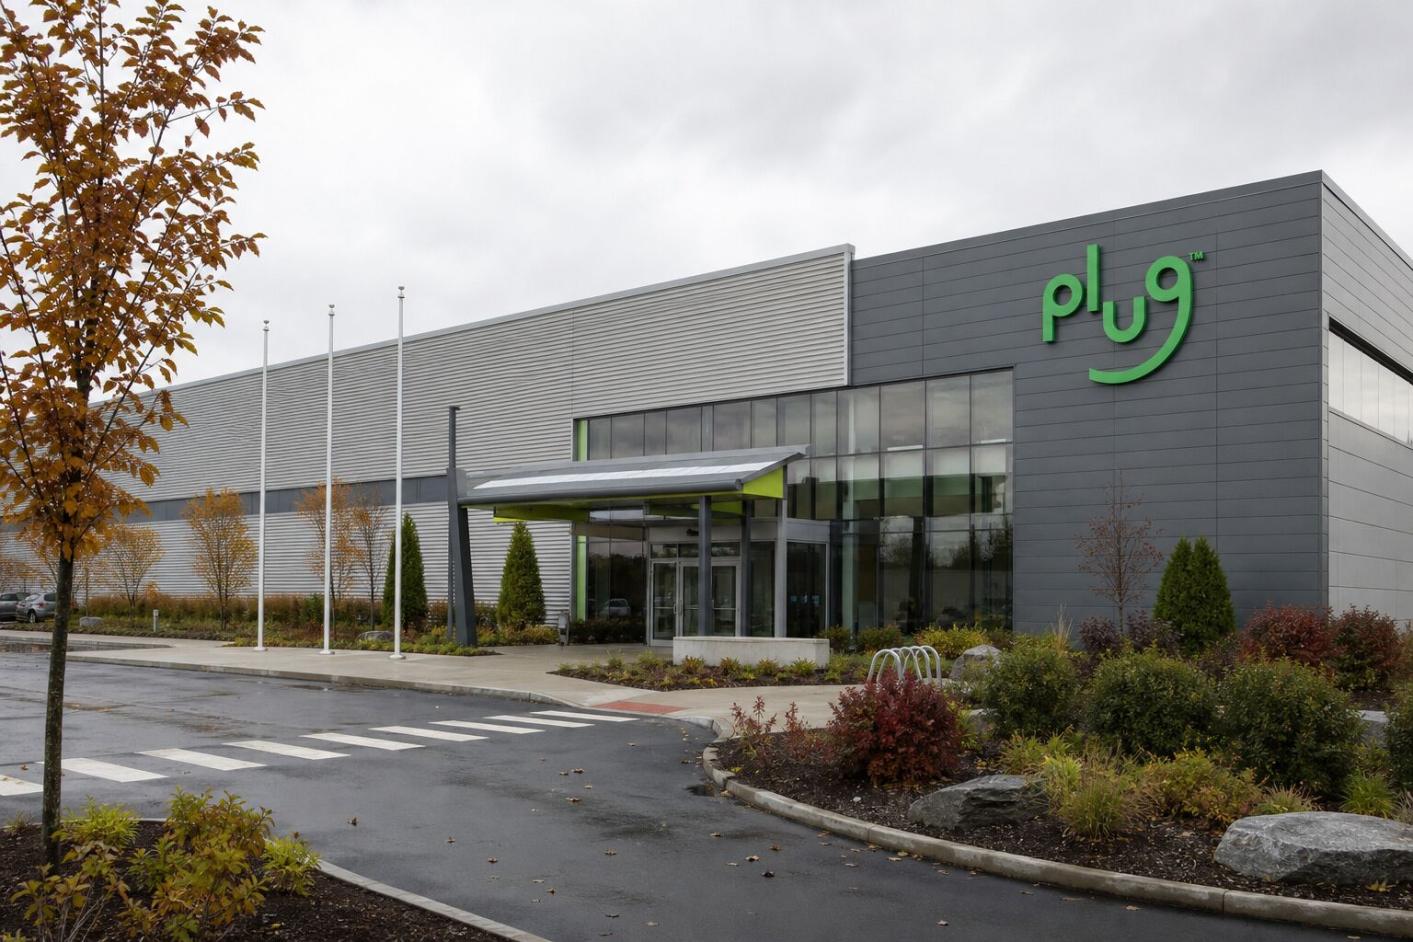
Company gross margin; red bars show the size of each loss
Source: Plug Power Form 10-Q and August 10 results release.
Second-quarter 2026 revenue and gross margin by operating stream
Excludes $0.2 million of other revenue and a service loss-contract benefit. Source: Plug Power Form 10-Q for the quarter ended June 30, 2026.
Five-minute reference prints, U.S. dollars per share. .
Source: Yahoo Finance five-minute chart feed. Prints are delayed and do not imply continuous trading.
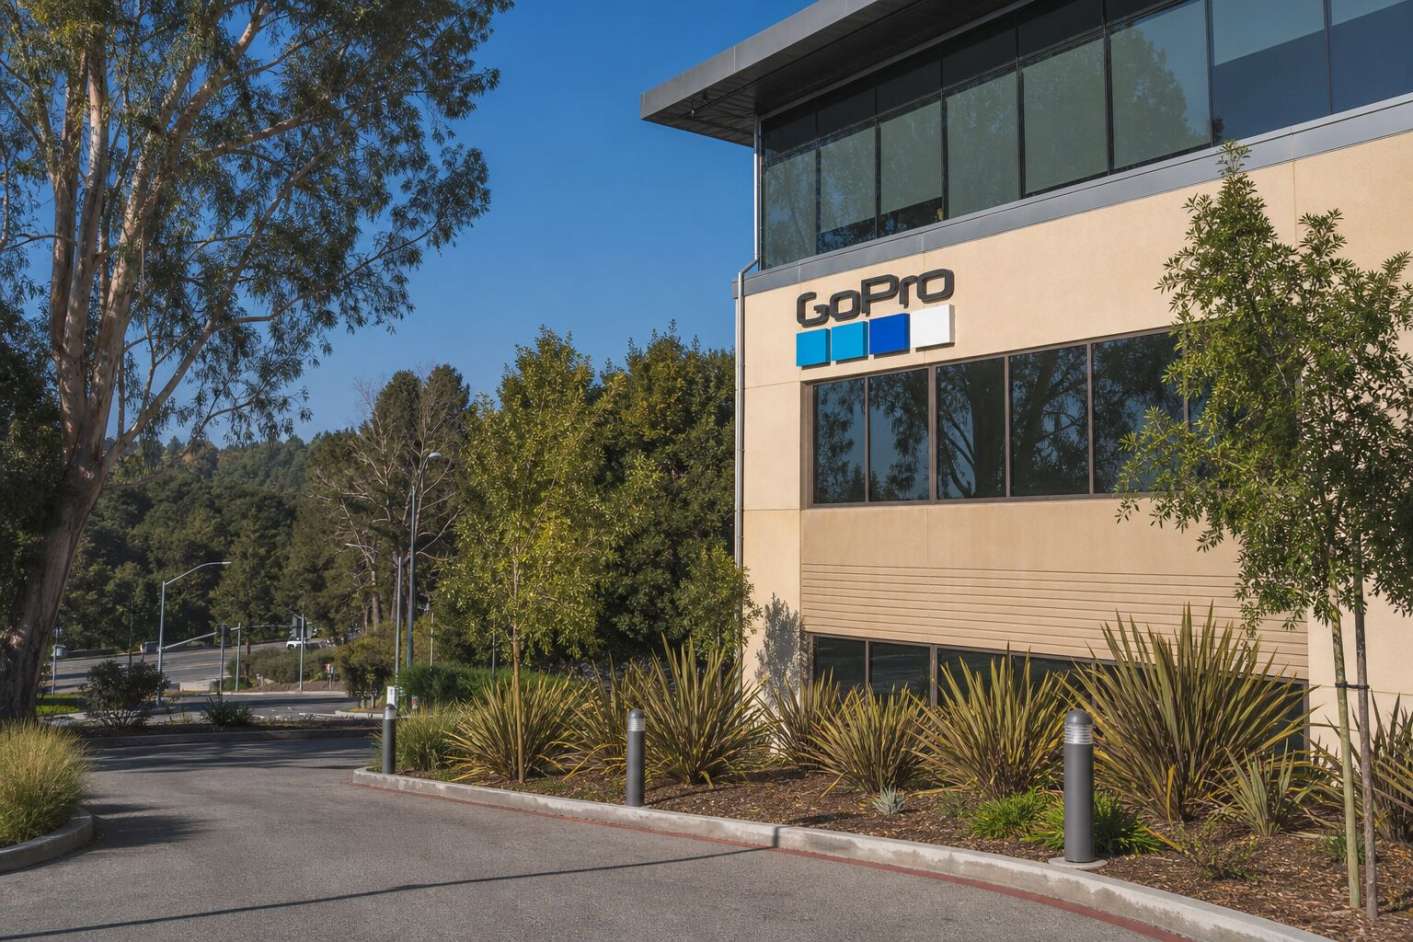
Sources: GoPro merger announcement; Yahoo Finance.
Down 31.3%
Down 5.6 points
Loss more than tripled
Source: GoPro second-quarter results, quarter ended .
USD per share; daily closes through September 1, then the latest verified premarket print
As of .
Sources: MarketMinute; Finviz.
USD per share; current is the September 1 close
Median, low and high: FT/LSEG, September 1. BMO: September 1 call.
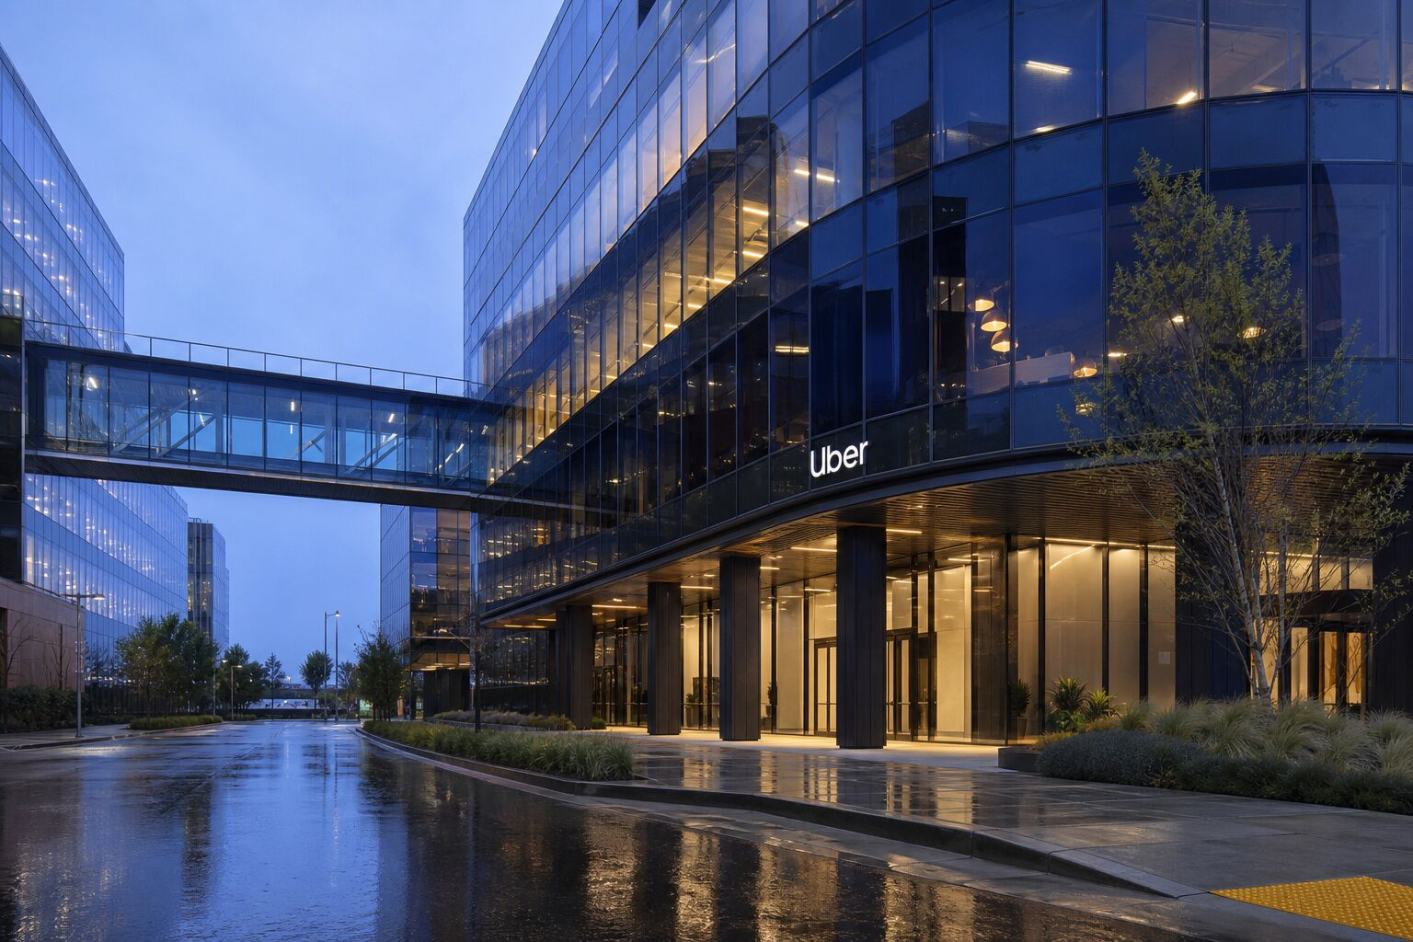
Quarter ended June 30, 2026. Source: Uber.
Bars show separate measures, not a common scale. Source: Uber Q2 prepared remarks.
September E-mini Nasdaq-100 futures, index points
Change from settlement, from the 04:00 premarket opening, and over the available 06:00–06:54 interval
78,108 contracts
124,860 contracts
7,920 contracts
16,582 contracts
As of 06:54 EDT. Sources: S&P 500, Nasdaq-100, Dow and Russell 2000 delayed CME quotes.
Change from Tuesday’s close; latest trades available by 07:05 EDT
Eleven-SPDR sample: 5 higher, 4 unchanged, 2 lower. Sources: XLE, XLV, XLC, XLY and XLB.
Premarket change from Tuesday’s regular close at 07:05 EDT
Revenue +21%; net ARR growth exceeded 40%
Revenue +58%; full-year outlook raised to $192 billion
Revenue +30%; shares reversed despite higher full-year guidance
Prices: GTLB, DELL and MDB. Financial results: company releases.
Front-month futures, U.S. dollars per barrel; vertical scale is compressed.
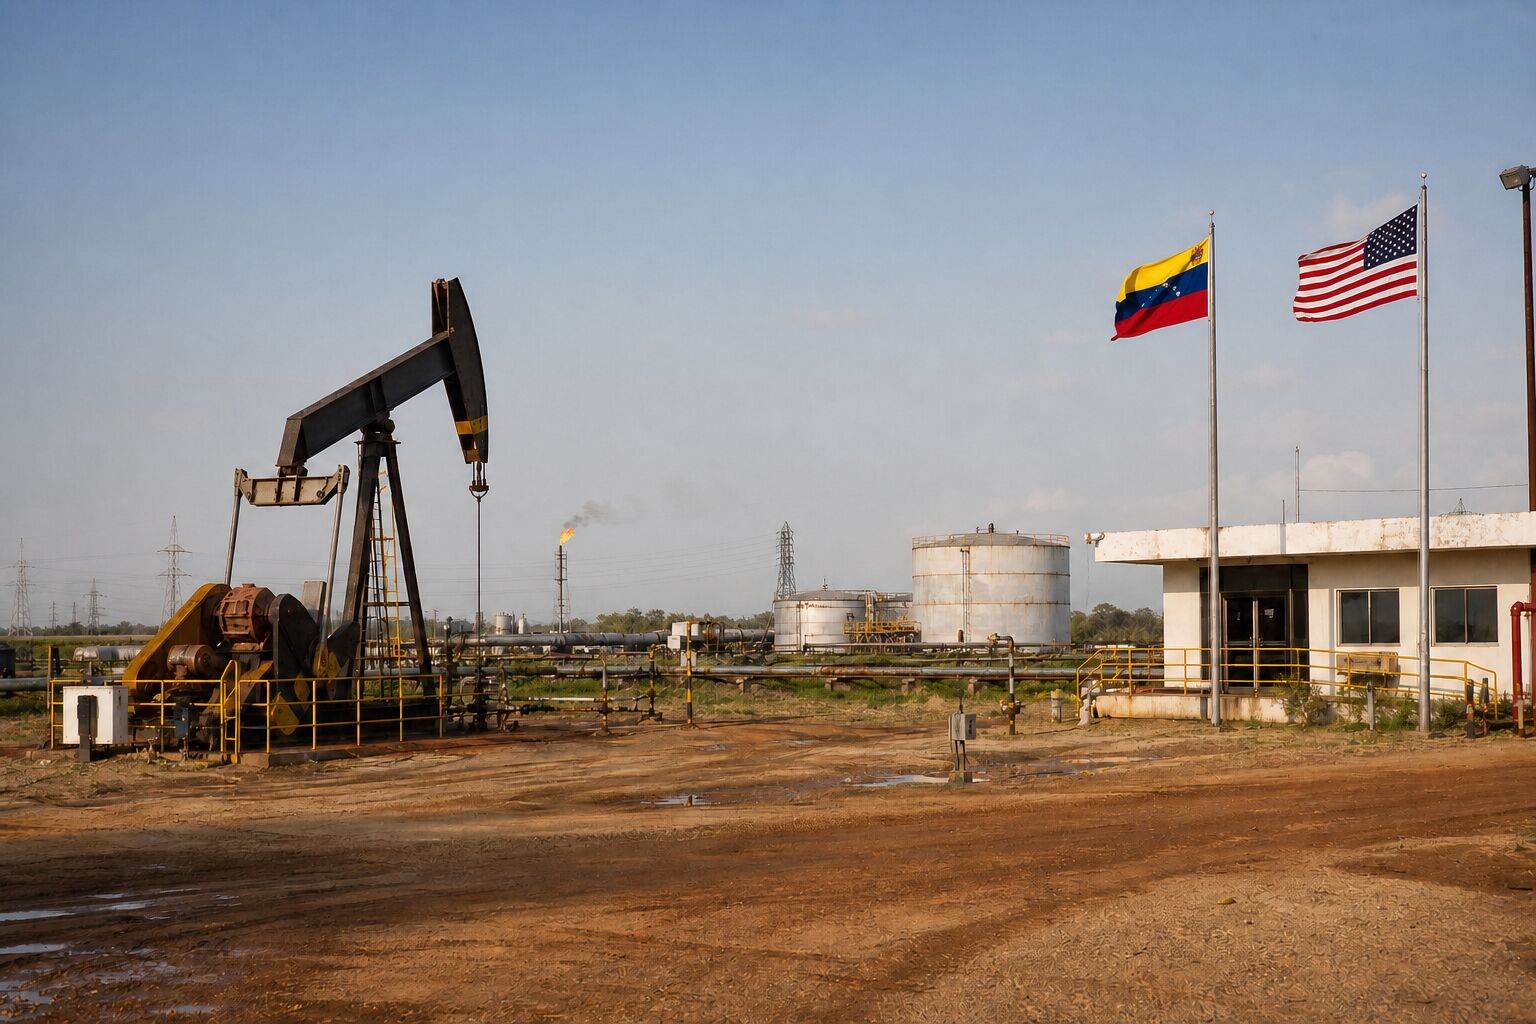
Million barrels per day; national figure is July 2026, Chevron figure is a 2026 estimate.