Wall Street Slips as Fed, Oil Impact Raises Challenges for AI Investments

Wall Street Slips as Fed, Oil Impact Raises Challenges for AI Investments

NEW YORK, July 29, 2026, 17:00 EDT — U.S. stocks slipped as investors reacted to signals from the Federal Reserve and higher oil prices, weighing the outlook for AI-related spending.

  • The S&P 500 declined by 1.52%. The Dow decreased 2.19%, and the Nasdaq slipped 1.74%.
  • The Federal Reserve maintained interest rates at 3.50%-3.75%, with three officials favoring a rise of 25 basis points.
  • Brent crude surged 7.91%. In after-hours trading, Microsoft rose 3%, while Meta Platforms slipped 5%.

U.S. stocks finished with steep losses on Wednesday following a split decision from the Federal Reserve and a fresh surge in oil prices. The S&P 500 closed at 7,316.15, its lowest close in a month. U.S. cash markets had closed, but after-hours trading was ongoing.

The mix has pushed up the returns investors seek from AI stocks. Rising oil prices squeeze profit margins. Increased likelihood of higher rates reduces the present value of future earnings.

The crucial divide can now be quantified. AI investment remains favored as cloud revenues and signed agreements surge. However, it faces setbacks when free cash flow dries up.

Pressure has focused over five sessions. The Nasdaq fell by nearly double the S&P 500’s drop.

BenchmarkJuly 29 closeWednesdayFive sessions
S&P 5007,316.15fell 1.52%lost 2.44%
Dow Jones Industrial Average51,594.14dropped 2.19%slipped 1.20%
Nasdaq Composite24,442.94declined 1.74%decreased 4.86%
Brent crude$90.74 a barreladvanced 7.91%

Five-session movements measured using Reuters closing data from July 22 and July 29.

The declines were widespread, with eight out of 11 S&P sectors finishing lower. Industrials slipped 3.24% and technology slid 2.5%. Declining stocks outpaced advancers by a ratio of 1.8 to one.

The Federal Reserve decided by a 9-3 vote to keep its target range unchanged. Beth Hammack, Neel Kashkari, and Lorie Logan favored a 25 basis point hike. Chair Kevin Warsh stated, “This Fed will not waver,” in reference to the 2% inflation target. Federal Reserve

“The Fed stayed on hold, as was anticipated,” stated Ryan Detrick, chief market strategist at Carson Group. Following the announcement, traders saw a 57% chance of a hike in September. Reuters

Oil added to the issue. Brent closed up $6.65 at $90.74, while West Texas Intermediate rose 6.56% to $84.46. U.S. crude inventories dropped by 7.2 million barrels, reaching their lowest point since 2018.
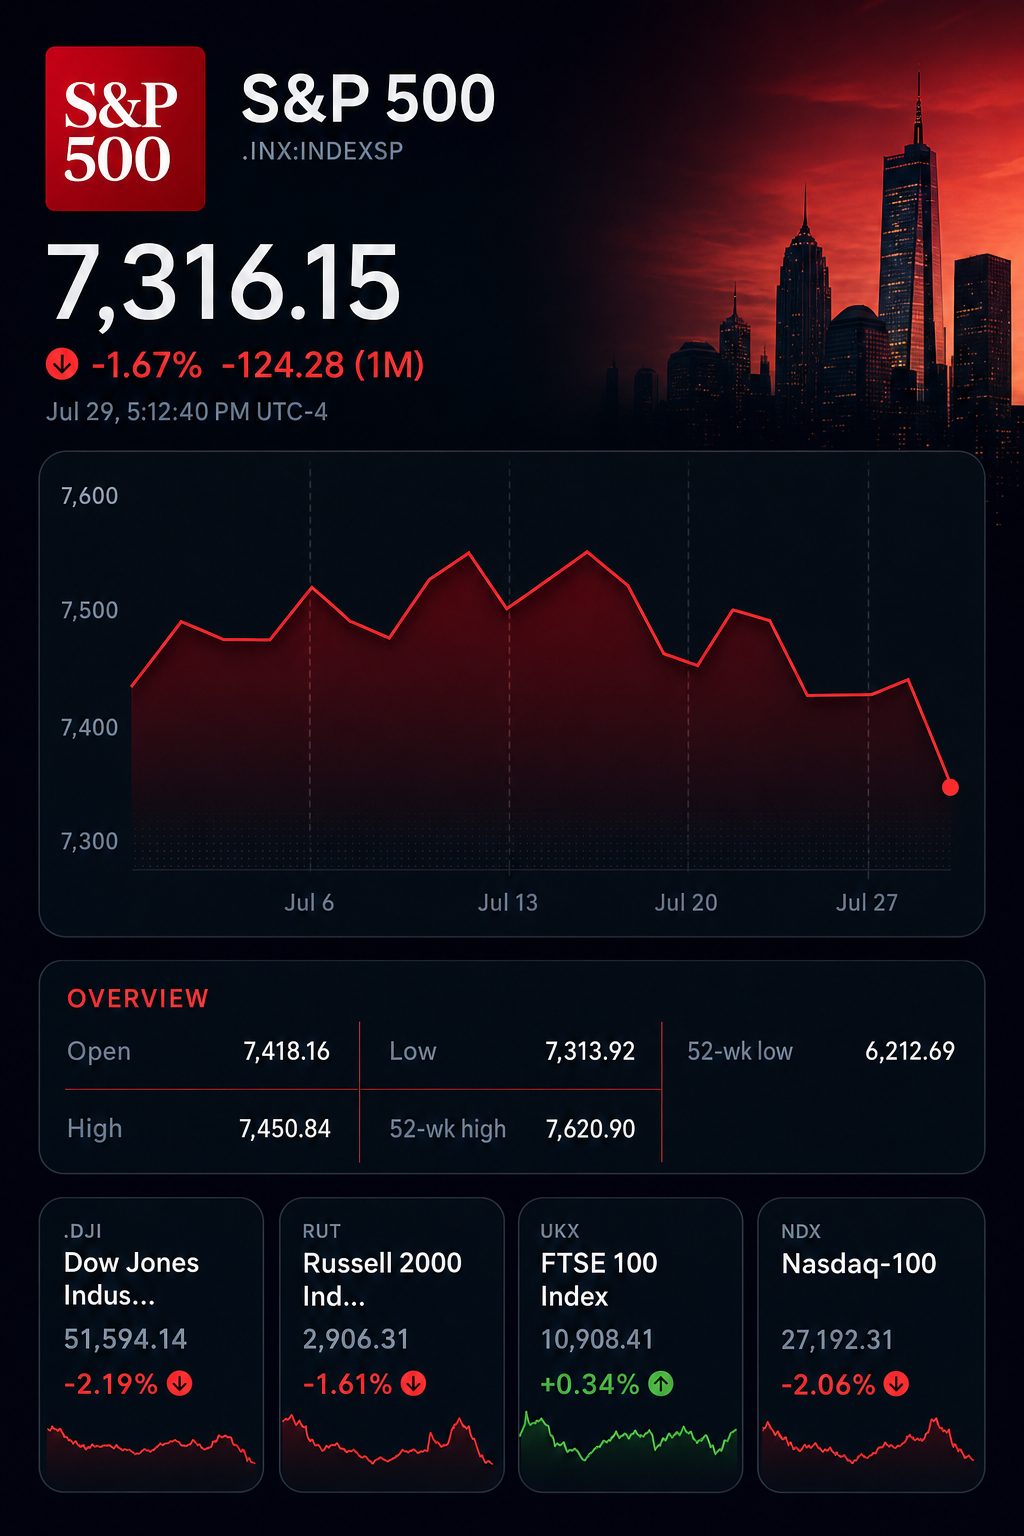
Stock chart for INDEXSP:.INX

Valuations provide limited margin for subpar performance. The S&P 500 is valued at close to 20 times expected earnings, compared with its 10-year average of 19. According to LSEG consensus estimates, still open to adjustment, second-quarter earnings growth is projected to be almost 40%.

Following the closing bell, the capital expenditure report delivered contrasting outcomes. The share price movements listed below are initial and subject to revision.

CompanyPreliminary moveOperating proofCapital and cash signal
MicrosoftUp roughly 3%Azure up 43%, beating the predicted 39.98%Capital spending reached $41 billion for the quarter, increasing more than 70%
Meta PlatformsDown around 5%Sales increased 28% to $60.8 billionFree cash flow dropped 91% to $784 million; 2026 spending outlook lifted to $130-$145 billion

Microsoft allocated about 46% of its revenue to capital expenditures during the quarter, while Azure’s growth surpassed analyst expectations by three percentage points. Meta’s free cash flow—cash remaining after covering operational costs and investments—represented just 1.3% of its revenue.

That reflects the investor perspective. The market values demonstrated returns rather than just the scale of expenditure.

Ongoing rotation continues to provide some backing. From June 2 onward, the S&P 500 equal-weight index climbed almost 4%. The main index declined 2.4% through the end of trading on Wednesday. Roughly two-thirds of its constituents made gains during this stretch.

The upcoming tests are set for Thursday. June personal consumption expenditures inflation figures will be published by the government at 08:30 EDT. Apple and Amazon.com are due to announce results following the close, with earnings calls slated for 17:00 EDT.

Risks are balanced on both sides. Easing regional tensions might swiftly reduce oil prices and push long-term yields down. Conversely, a solid inflation print or a new supply shock could intensify rate repricing.

Wednesday underscored a simple truth: investing heavily in AI is no longer sufficient. In today’s market, the ability to turn revenue into cash drives valuations.

TS2 TECH • EXTENDED COVERAGE

Further analysis

What was SPY’s closing level in the most recent U.S. trading day?

SPY ended Wednesday, July 29, at $729.46, falling $11.40, or 1.54%. The session range was $729.10 to $742.68. Trading volume stood at 67.9 million shares, about 32% higher than its 65-day average. As of 4:49 p.m. Eastern, SPY changed hands at $728.27 in after-hours activity. The S&P 500 index closed at 7,316.15, down 1.52%. The Wall Street Journal

What caused SPY to drop so steeply?

The Federal Reserve kept interest rates at 3.50%-3.75%. Three policymakers, however, favored a 25-basis-point rise, making the pause appear hawkish rather than dovish. The ten-year Treasury yield finished close to 4.62%, putting upward pressure on equity discount rates. Brent crude jumped 7.3% to trade above $88 as hostilities escalated in the Middle East. Shares of technology and industrial companies dropped, and eight of eleven sectors fell. Reuters

Did the extent of the selling have significant impact?

The Dow dropped 2.19%, while the Nasdaq Composite lost 1.74% and the Russell 2000 slipped 1.6%. The Nasdaq 100 entered correction territory, falling around 10% from its June high. Trading volume in SPY was 32% above its current average, indicating stronger trading activity. The VIX rose 13.45% to reach 20.66. This market move extended beyond reactions to single-stock earnings. AP News

What are the key SPY price levels to watch at present?

SPY is currently 4.1% under its 52-week peak of $760.40. The S&P 500 ended the session beneath its approximate 7,470 50-day moving average. Reuters pinpointed support for the index at 7,294, 7,238 and 7,161, levels roughly matching SPY at $727, $721 and $714. Resistance is seen near $741, followed by $750 and the $760 record mark. The Wall Street Journal

Based on current volatility, what is the projected range for SPY?

The VIX settled at 20.66, indicating the implied 30-day annualized volatility. By converting to a monthly estimate, the movement over roughly one month is about 5.9%. Based on a price of $729.46, this calculation gives a statistical range from $686 to $773. This reflects a volatility range rather than a forecasted direction. Unexpected major earnings or geopolitical developments could cause prices to exceed these boundaries. Cboe Global Markets

What impact do Microsoft and Meta earnings have on Thursday’s setup?

Microsoft rose nearly 3% after posting $90 billion in revenue and earnings per share of $4.81. Azure’s growth hit 43%, surpassing the 40% forecast. Meta slipped around 5% as its $6.18 EPS missed estimates, with free cash flow plunging 91% to $784 million. Their SPY index weights are 4.57% and 2.04% respectively, so the share moves partly balanced each other. The outlook is mixed: cloud demand stayed solid, while AI investments continued to weigh on results. Barron’s

What could be the next significant drivers for SPY?

Markets will see Q2 GDP and June PCE data at 8:30 a.m. Eastern Thursday. MarketWatch projects GDP to grow at a 1.8% annualized rate and core PCE to increase 0.2% for the month. The year-over-year core PCE expectation is 3.3%. Jobless claims are forecast around 200,000, with slight differences across calendars. Apple and Amazon are set to report after market close, and together make up 11.36% of SPY. Bureau of Economic Analysis

What impact could Apple and Amazon results have on SPY’s movement?

Options market data suggests Apple could see a move of about 4%, while Amazon may shift around 6%. Their respective weightings in the SPY index stand at 7.82% and 3.54%. If both stocks move in tandem, the direct effect on SPY would near 0.5%. This figure does not incorporate sector-related moves or adjustments from overnight futures. Apple’s revenue forecast is approximately $103.2 billion, while Amazon’s is close to $196.8 billion. Investors may focus more on capital-spending forecasts than on top-line revenue. Investopedia

What is the SPY and S&P 500 outlook over the next one to four weeks?

SPY is expected to fluctuate between $715 and $750 under the base scenario, which translates to approximately 7,170 to 7,520 for the S&P 500. A finish above $750 could lead to another test of the $760-$765 level. A close below $714 would bring $700 into focus, followed by the $686 volatility threshold. The outlook is based on the assumption that oil prices and regional conflicts remain stable. Forecast confidence remains moderate. Reuters

Following this drop, is SPY now attractively valued?

The drop has not resulted in a clear valuation opportunity. SPY is still just 4.1% off its 52-week peak. The S&P 500 is trading at nearly 20 times projected earnings. Apple and Nvidia by themselves make up 15.29% of the fund. The largest ten holdings now represent 36.79%, heightening the risk posed by mega-cap concentration. This mix supports measured exposure, rather than a full-scale valuation decision. Reuters

Leokadia Głogulska is a financial and technology journalist at TS2.tech, covering stocks, artificial intelligence, space technology and global market developments. She graduated from Wrocław University of Economics and Business and previously worked in financial analysis before moving into business journalism. Her reporting focuses on helping readers understand the market trends, companies and technologies shaping the global economy.

AI PORTFOLIO

Top Stock Picks

Today’s highest-ranked model selections.

#1 BUY IN STAGES

AerCap

NYSE: AER 95 / 100
#2 BUY ON WEAKNESS

Xylem

NYSE: XYL 93 / 100
#3 ACCUMULATE

General Dynamics

NYSE: GD 91 / 100
#4 BUY WITH LIMITS

Visa

NYSE: V 88 / 100
#5 TACTICAL BUY

IDEX

NYSE: IEX 85 / 100
View full portfolio
Editorial model selection. Not personalised advice.
Qualcomm (NASDAQ:QCOM) Shares Fall as Handset Weakness Challenges Expansion Strategy
Previous Story

Qualcomm (NASDAQ:QCOM) Shares Fall as Handset Weakness Challenges Expansion Strategy

Meta Platforms (NASDAQ:META) declines as Q2 free cash flow drops 91% on AI investments
Next Story

Meta Platforms (NASDAQ:META) declines as Q2 free cash flow drops 91% on AI investments