
NEW YORK, August 7, 2026, 05:07 EDT
- Preliminary premarket indication: Intel traded at $101.25 at 04:57 EDT, up 1.44% from Thursday’s close.
- Third-quarter adjusted EPS estimates have risen 46% in one month. Full-year estimates are up 38%.
- Intel Foundry’s loss equaled 43% of product operating profit last quarter, down from 118% one year earlier.
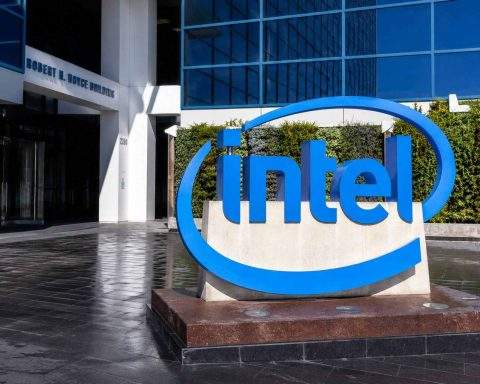
Inteacasl shares pointed 1.4% higher in Friday premarket trading. At 04:57 EDT, the stock was indicated at $101.25. Regular U.S. trading begins at 09:30 EDT.
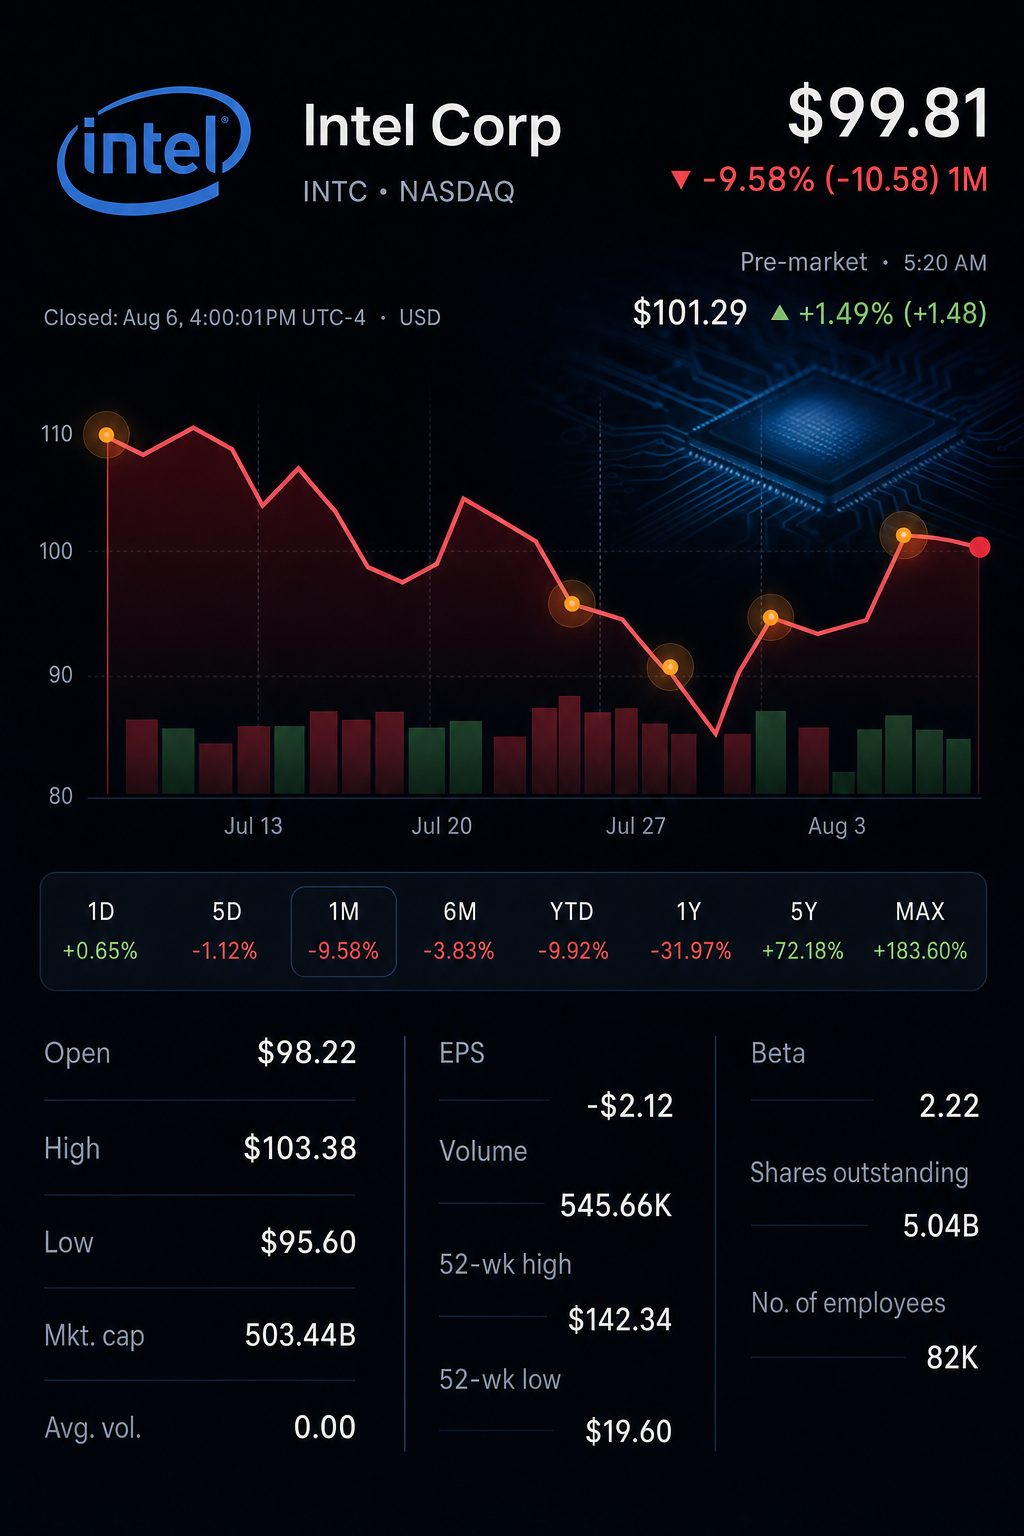
The estimate revision beneath the move is larger. Consensus third-quarter adjusted EPS has risen 46% in one month. Full-year 2026 EPS estimates have climbed 38%.
Intel gained 10.7% over the latest five sessions. Tuesday’s 10.84% jump accounted for more than the net advance. The Philadelphia Semiconductor Index rose 6.6% that day. That suggests broad risk appetite also drove the rebound.
Intel’s five-session price path
| Session | Close | Daily move | Volume |
|---|---|---|---|
| July 31 | $90.20 | -1.02% | 109.0 million |
| August 3 | $91.00 | +0.89% | 96.6 million |
| August 4 | $100.86 | +10.84% | 123.5 million |
| August 5 | $101.06 | +0.20% | 84.3 million |
| August 6 | $99.81 | -1.24% | 77.2 million |
Thursday’s decline ended three consecutive gains. Volume remained below Intel’s 50-day average of 122.6 million shares. The stock also closed 29.9% below its June 30 high.
Current estimates now match Intel’s $0.38 third-quarter adjusted EPS guidance. One month ago, consensus stood at $0.26. Forecasts for 2027 have also moved sharply higher.
Consensus EPS revisions
| Period | Current estimate | One month ago | Revision |
|---|---|---|---|
| Q3 2026 | $0.38 | $0.26 | +46.2% |
| Q4 2026 | $0.42 | $0.31 | +35.5% |
| FY 2026 | $1.49 | $1.08 | +38.0% |
| FY 2027 | $2.04 | $1.58 | +29.1% |
The revisions followed a large second-quarter beat. Revenue exceeded pre-release consensus by 11.9%. Adjusted EPS was twice the estimate. Intel’s third-quarter revenue midpoint also topped expectations by 7.9%.
Earnings and guidance against preliminary consensus estimates
| Metric | Intel result or guidance | Pre-release consensus | Difference |
|---|---|---|---|
| Q2 revenue | $16.13 billion | $14.42 billion | +11.9% |
| Q2 adjusted EPS | $0.42 | $0.21 | +100.0% |
| Q2 adjusted gross margin | 41.8% | 38.8% | +3.0 points |
| Q3 revenue midpoint | $16.30 billion | $15.10 billion | +7.9% |
| Q3 adjusted EPS | $0.38 | $0.27 | +40.7% |
GAAP earnings were less straightforward. Intel reported an $11.03 billion attributable net loss. Its reconciliation included $12.53 billion of mark-to-market losses on escrowed shares. Non-GAAP net income reached $2.20 billion.
The clearer operating signal sits inside Intel Foundry. Segment revenue rose 30.5%, while its operating loss narrowed 34.1%. The implied operating margin improved by 35.5 percentage points.
Intel Foundry economics
| Foundry metric | Q2 2026 | Q2 2025 | Change |
|---|---|---|---|
| Segment revenue | $5.765 billion | $4.417 billion | +30.5% |
| Operating loss | $2.089 billion | $3.168 billion | -34.1% |
| Implied operating margin | -36.2% | -71.7% | +35.5 points |
| Loss/product operating profit | 43.4% | 117.9% | -74.6 points |
Calculated from Intel’s unaudited segment accounts. Foundry revenue includes intersegment transactions.
The foundry loss equaled 43% of Intel Products’ operating profit. One year earlier, it exceeded that profit. Intel Products earned $4.82 billion last quarter, while foundry lost $2.09 billion. Consolidated operating income reached $1.80 billion.
That ratio matters more than foundry revenue alone. Intel’s segment sales include substantial internal manufacturing work. A continuing decline in the loss-to-product-profit ratio would support another re-rating. One quarter does not establish the trend.
Chief Executive Lip-Bu Tan said, “AI is driving unprecedented demand for compute.” Intel also said 18A-P entered risk production. Tan has committed the company to high-volume 14A production in 2028. Futurum Group strategist Shay Boloor said further revaluation requires sustained growth, better foundry economics and external customers. Intel Corporation
Analyst positioning remains divided. The current consensus label is Overweight, yet 31 of 54 recommendations are Holds. The median target of $118 implies 18.2% upside from Thursday’s close.
Analyst recommendations
| Recommendation | Three months ago | One month ago | Current |
|---|---|---|---|
| Buy | 12 | 16 | 15 |
| Overweight | 4 | 6 | 6 |
| Hold | 31 | 31 | 31 |
| Underweight | 1 | 0 | 0 |
| Sell | 3 | 3 | 2 |
| Consensus | Hold | Overweight | Overweight |
The average target is $121.72, implying 22% upside. However, forecasts range from $75 to $200. That spread captures the unresolved value of Intel’s foundry operation.
Peer trading was mixed Thursday. Advanced Micro Devices NASDAQ:AMD rose 1.42%, while Taiwan Semiconductor Manufacturing Company NYSE:TSM gained 1.00%. Nvidia Corporation NASDAQ:NVDA slipped 0.18%, against Intel’s 1.24% decline.
Risks: Intel raised its capital-spending forecast to $20 billion from $18 billion. Foundry losses remain substantial. Further 14A customer commitments are important for investment returns. Process delays, weaker demand and export restrictions could slow the recovery.
The near-term earnings recovery is now visible in consensus. The next re-rating must come from foundry conversion, not another forecast catch-up. Investors should track foundry losses against product profits, external design wins and 14A milestones.
Related articles: NASDAQ:INTC