Marcin Frąckiewicz is the founder of TechStock² and CEO of TS2 Space. He writes about publicly traded space and satellite companies, telecommunications, AI infrastructure and the market forces shaping those sectors. Follow him on Google News or LinkedIn.
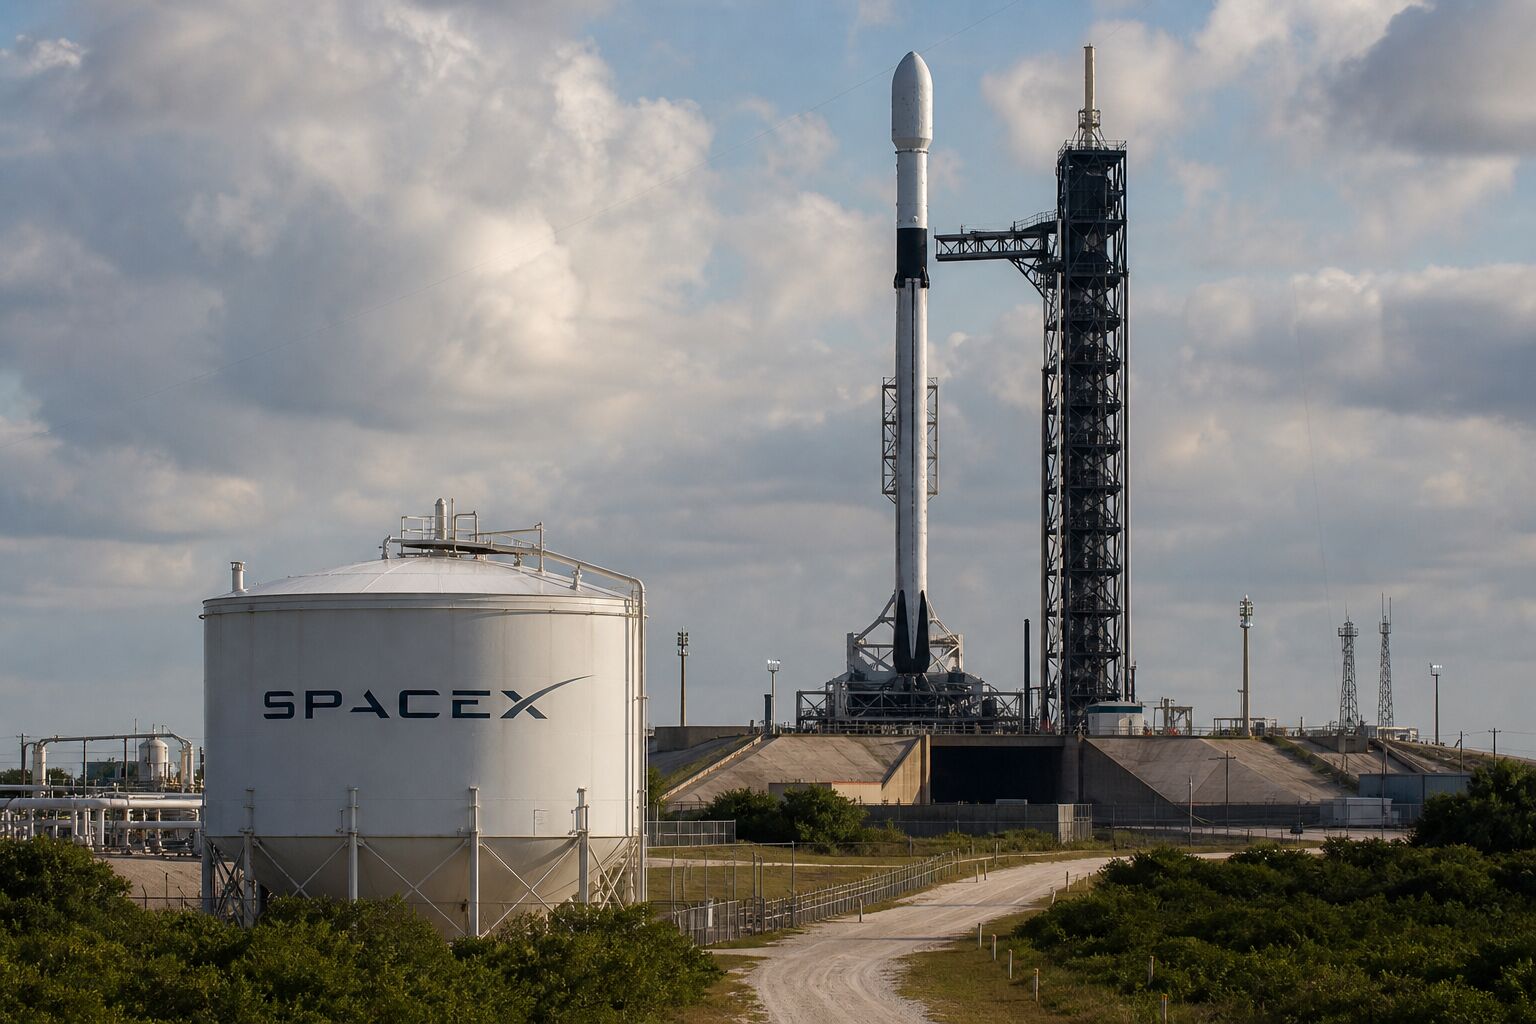
Space Exploration Technologies Corp. shares rose 1.55% on Monday to $143.69. The close valued SpaceX at roughly $1.89 trillion. The stock eased to $143.53…
·3 min read
SpaceX shares: six-session climb
Regular-session closes, plus the latest after-hours trade; U.S. dollars
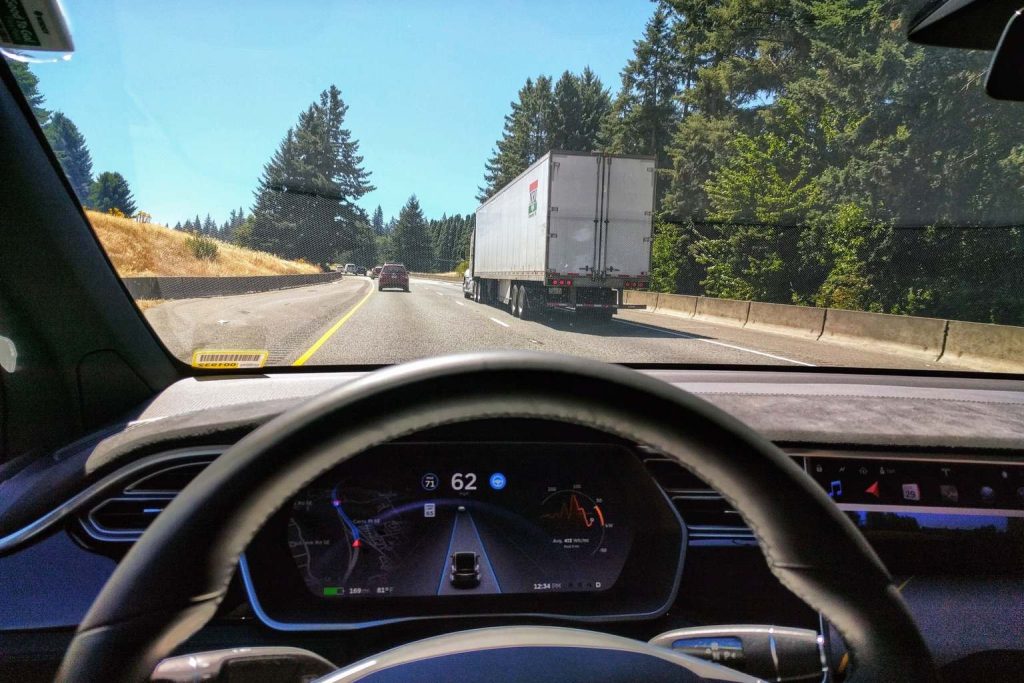
AUSTIN, Texas, August 31, 2026, 15:12 EDT — Tesla shares advanced by nearly 5% on Monday following the release of a federal crash report…
·4 min read
INVESTOR DASHBOARD · TSLA
Tesla Stock Jumps 5.0% as Autopilot Crash Data Tests $1.45 Trillion Valuation
Snapshot: August 31, 2026 · 15:12 EDT
+4.96%
Price
$366.05
Prev. $348.75
Market cap
$1.45T
Approximate
Forward P/E
183.2x
High expectation
Target
$390.09
+6.6% implied
Safety signal
Item
Reading
Crash report
Fatal, May 2026
ADAS status
Verified engaged
Pre-crash speed
104 mph
Causation
Not established
Business engine
Q2 metric
Result
Revenue
$28.24B, +26%
FSD subscriptions
1.48M, +56%
Operating margin
1.4%
Free cash flow
-$1.09B
Investor bridge
FSD subscription growth can improve recurring software revenue and margins. Safety investigations can delay rollout, add compliance cost and weaken adoption. With the stock valued at roughly 183 times forward earnings, regulatory and execution outcomes have an outsized effect on fair value.
Watch: NHTSA EA26002 updates · supervised FSD miles and interventions · subscription growth · operating-margin conversion.
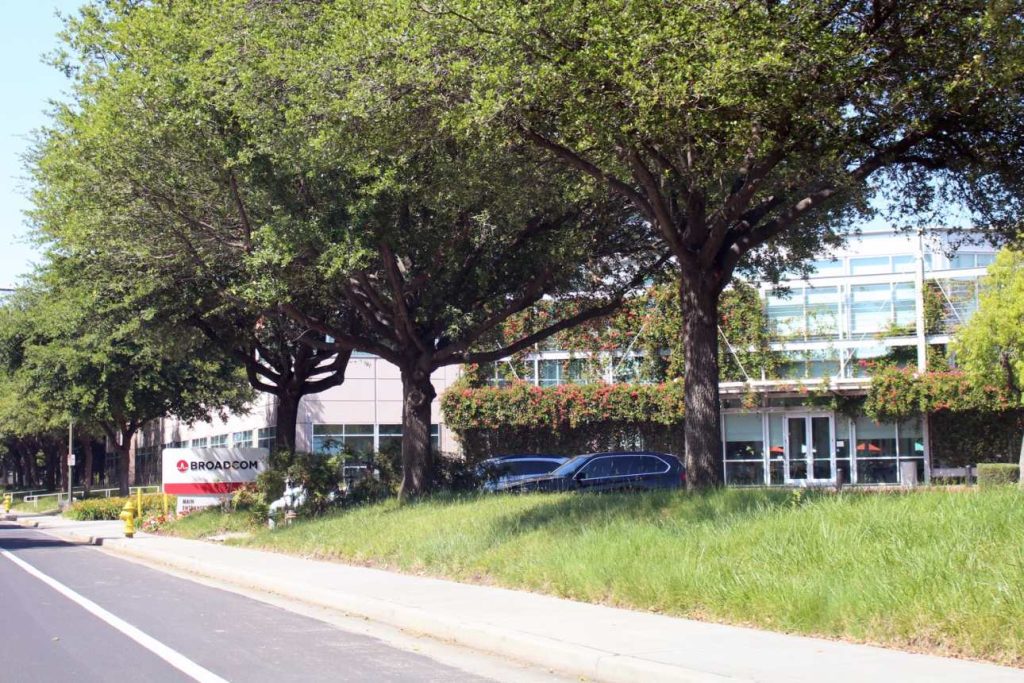
Shares of Broadcom Inc. rose 0.8% on Monday, with investors bracing ahead of a tough earnings challenge. At 14:33 EDT, the stock changed hands…
·3 min read
NASDAQ: AVGO · earnings setup
Broadcom's $16B AI quarter faces a valuation test
Market data at 14:33 EDT · August 31, 2026 · Q3 results due September 2 after close
$371.80
+$3.01 · +0.82%
Range $366.30-$372.75
Market value
$1.77T
4.76B shares × $371.80
Q3 revenue target
$29.4B
+84% year over year
Q3 AI target
$16.0B
54.4% of revenue
Implied sales multiple
15.0×
Market value / annualized Q3 sales
AI mix is crossing half of company revenue
USD billions
AI semiconductor revenue is targeted to rise 48.1% sequentially. Non-AI and software revenue would total $13.4B.
What Wednesday must deliver
after close
Revenue
$29.4B
Adjusted EPS consensus
$3.24
AI semiconductor target
$16.0B
Adjusted EBITDA guide
68% of sales
Non-GAAP operating income
67% of sales
Q3 company guidance unless marked consensus.
Fiscal Q2 operating engine
quarter ended May 3
Metric
Value
YoY
Semiconductor solutions
$15.01B
+79%
Infrastructure software
$7.18B
+9%
AI semiconductors
$10.80B
+143%
Free cash flow
$10.26B
+60%
Adjusted EBITDA
$15.24B
+52%
Valuation and sentiment
current setup
Average analyst target
$525.97
41.5% implied upside; range $215.88-$675
Distance from 52-week high
−24.9%
$371.80 versus $495.00
Recommendation mix
45 buy · 0 sell
Investor bridge
one metric to watch
The earnings debate turns on whether a 54.4% AI revenue mix can preserve Broadcom's cash conversion while supporting a roughly 15× annualized-sales valuation. A clean beat must include the $13.4B non-AI remainder, not only accelerators.
Risks: advanced-node supply, hyperscaler concentration, custom-silicon and networking competition, VMware execution, and valuation sensitivity.
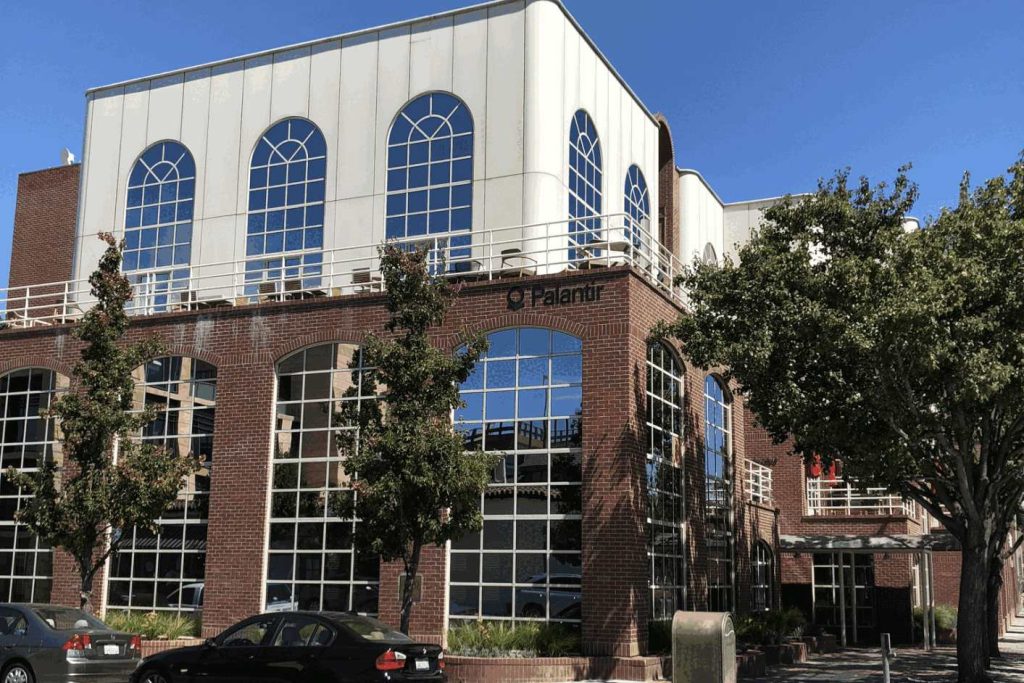
Palantir Technologies dropped 0.45% to $185.45 as of 10:36 EDT. Palantir's stock lagged behind Nvidia even though the company posted quicker revenue growth.
Contract timing can distort quarterly growth. European resistance may limit international expansion. Palantir also needs sustained margin and cash-flow execution to support a 158.5× earnings multiple.
Near-term checkpoint: Q3 revenue versus the $2.160-$2.164B company range.
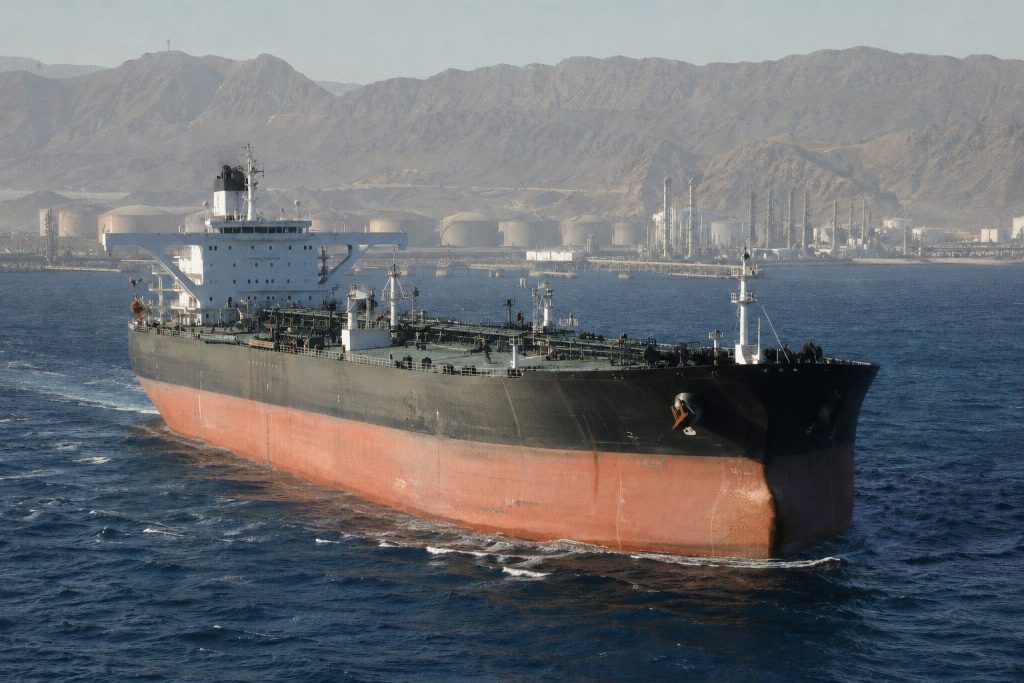
Oil futures surged close to 4% on Monday, lifted by fresh U.S.-Iran clashes that put Gulf shipping routes at risk. Front-month West Texas Intermediate…
·3 min read
Oil futures • investor dashboard
Prompt supply risk, discounted later barrels
Brent and NYMEX WTI • Strait of Hormuz risk map
Delayed futures snapshot: August 31, 2026, 06:14 ET Forecasts: EIA August STEO and Reuters August survey Prepared: August 31, 2026, 07:44 ET
WTI front month
$86.56
+$3.16 • +3.79%
Brent continuous
$91.35
+$3.25 • +3.69%
Brent-WTI spread
$4.79
5.5% above WTI
Oct–Jun backwardation
$12.09
16.2% prompt premium
WTI futures curve
A downward-sloping curve concentrates the risk premium in immediately deliverable barrels.
Forecast versus market
Brent now
$91.35
Reuters 2026 avg.
$85.08
EIA 3Q26 avg.
$85
EIA 4Q26 avg.
$78
EIA 2027 avg.
$69
Physical balance
Indicator
Latest estimate
Signal
July production shut-ins
5.5M b/d
Tight
2Q26 inventory change
-4.2M b/d
Tight
3Q26 inventory forecast
-3.8M b/d
Tight
OPEC+ September increase
+188K b/d
Partial offset
China July imports
-24.3% YoY
Demand drag
Transmission map
Key test: physical flows. A lasting tanker blockage or damaged loading terminal widens backwardation. Continued passage through Hormuz removes the premium faster than headlines alone.
Higher oil → inflation pressureHigher oil → airline and freight costsBackwardation → inventory draw incentiveWeak China → capped upside
Scenario watch
Escalation
Tanker or terminal disruption; prompt contracts rise fastest.
Base case
Restricted flows persist; Brent holds around the high $80s.
Further Chinese weakness compresses the curve despite supply risk.
Sources: MarketWatch delayed futures data; Reuters August 31 poll and conflict report; U.S. Energy Information Administration August Short-Term Energy Outlook; The Wall Street Journal. Prices are dollars per barrel. Figures are rounded. Not investment advice.
IREN Limited fell 12.53% on Friday after annual results highlighted the expense of turning contracted AI demand into operating cash flow. Shares settled at…
A familiar franchise can lower discovery and marketing friction. The financial test is whether September’s new episodes lift retention and ad inventory beyond launch week while preserving a 33.4% operating margin.
Tesla Inc. stock dropped 1.7% on Friday, wiping out approximately $19 billion in market capitalization. The move brought the electric vehicle company's value down…
·3 min read
Tesla investor dashboard
Price premium meets margin pressure
Friday close: -1.71%
TSLA close
$348.75
Aug. 28, 16:00 EDT
Market value
$1.09T
Aug. 28 close
Trailing P/E
323.95×
Google Finance
Trading volume
32.97M
vs. 37.88M average
Quarterly operating profile
Revenue
$28.24B
Auto revenue
$20.52B
Gross profit
$4.75B
R&D
$2.37B
Op. income
$0.40B
Q2 ended June 30, 2026; Tesla shareholder update.
Margin and cash conversion
Free cash flow was -$1.1B, while cash and investments totaled $43.5B.
Wall Street range
View
Count / target
Signal
Buy
11 analysts
Supportive
Hold
14 analysts
Largest group
Sell
3 analysts
Cautious
Average target
$385.05
+10.4%
Target range
$130–$505
Wide dispersion
Google Finance snapshot, Aug. 28, 2026.
Commercial pressure points
Cybertruck base trim
$74,990
Premium AWD trim
$84,990
Recent increase
+$5,000 each
H1 U.S. Cybertruck sales
7,263 est.
Year-on-year change
-32.2%
Prices reported Aug. 26; sales estimate from Cox Automotive.
Investor bridge
Tesla lost about $19 billion of market value on Friday. Its balance sheet funds autonomy, robotics and energy expansion, but a 323.95× earnings multiple leaves little room for delays while operating margin sits at 1.4%.
UiPath Inc. fell 1.0% on Friday as investors anticipated a significant swing following its earnings release. Options pricing suggests an 11% change is expected…
·3 min read
UiPath · NYSE:PATH
An 11% earnings swing is priced in
Market: Aug. 28, 2026, 16:00 EDT Updated: Aug. 30, 2026, 11:27 EDT
Friday close
$18.15
−0.98%
Volume
53.1M
Most Active rank 9
Market cap
$9.58B
Approximate
Trailing P/E
30.3×
EPS $0.60
Options-implied earnings range
Implied equity-value swing: about $1.05B
Options data published Aug. 27 implies an 11% post-report move. Earnings are due Sept. 3 after the close.
Growth cadence
Q1 revenue growth 17%
Q2 guide midpoint growth ≈10%
Q1 ARR growth 12%
Report card before Sept. 3
Metric
Reading
Q1 revenue
$418M
Q1 ARR
$1.901B
Net new ARR
$49M
Net retention
109%
GAAP operating income
$28M
Adjusted FCF
$130M
Q2 revenue guide
$395M-$400M
Q2 EPS consensus
$0.13
FY27 revenue guide
$1.776B-$1.781B
Investor focus: recurring-revenue acceleration, agentic-product conversion, and full-year ARR guidance.
USDC has landed a prime spot in football advertising, with its branding set to appear on Chelsea's shirts for the entirety of the 2026/27…
·3 min read
USDC — Chelsea Sponsorship Dashboard
Visibility is immediate. The circulation return must still be earned.
USDC data: Aug. 27, 2026 Market close: Aug. 28, 2026, 16:00 EDT Updated: Aug. 30, 2026, 10:08 EDT
USDC circulation
$73.7B
+$0.4B since Q2 end
Reserves
$74.0B
100.4% coverage
Q2 onchain volume
$14.8T
+151% year over year
Market share
29%
Circle’s 2026 circulation estimate
CRCL close
$87.14
−7.59% Friday
CRCL volume
14.73M
Friday, Aug. 28
Market value
$23.41B
At Friday close
Analyst target
$103.55
18.8% implied upside
Q2 economics
Reserve income
$668M
Distribution + other
$412M
Revenue less costs
$289M
Adjusted EBITDA
$143M
Marketing-return scenario
Added average USDC
Annual gross reserve income
After 61.7% cost ratio
$1B
$34.8M
$13.3M
$3B
$104.4M
$40.0M
$5B
$174.0M
$66.6M
Scenario holds the Q2 reserve return rate at 3.48% and the cost ratio constant. It is not guidance.
Growth versus monetization
Catalyst timeline
Aug. 28Chelsea and Circle announce USDC front-of-shirt partnership.
Aug. 30Expected men’s home-shirt debut against Brighton.
WeeklyCircle circulation and reserve data reveal whether balances accelerate.
Investor bridge
Chelsea supplies global brand reach, but Circle earns mainly from the assets backing USDC. A durable return requires higher average circulation or greater fee revenue. Watch the weekly balance trend, reserve yield and distribution-cost ratio.
Risks: undisclosed sponsorship cost, weaker interest rates, stablecoin competition, marketing regulation and limited conversion from awareness to funded balances.
Sources: Circle transparency and Q2 2026 results; Chelsea FC partnership announcement; Reuters; market data as of Aug. 28, 2026. Scenario values are estimates.
Vistra Corp. declined 1.95% on Friday, wiping out roughly $935 million in market capitalization. The stock finished at $137.09, marking its second straight drop.…
·2 min read
VISTRA · NYSE:VST · STOCK MOVE
Growth versus hedge noise
Market close: Aug. 28, 2026 · 16:00 EDT Dashboard checked: Aug. 29, 2026 · 15:01 EDT
Friday close$137.09−1.95%
Estimated value lost≈$935Mon ≈$47.0B equity value
Q2 adjusted EBITDA$1.77B+31% year over year
Q2 GAAP net income$305M−6.7% year over year
Where adjusted EBITDA grew
Segment
Q2 2026
Q2 2025
Change
Texas
$311M
$142M
+119%
East
$642M
$418M
+54%
Retail
$773M
$756M
+2%
Total ongoing
$1.77B
$1.35B
+31%
Generation hedged
2026 guidance and valuation bridge
Adjusted EBITDA
$6.8B–$7.6B
Adjusted FCF before growth
$3.93B–$4.73B
Midpoint / market value
≈9.2%
Remaining buyback authorization
≈$1.2B
Available liquidity
≈$6.30B
Street expectations
Consensus
Buy · 20 analysts
Average target
$217.42
Implied upside
+58.6%
Target range
$106–$305
Latest visible cut
$222 → $167
Why investors care: Friday's decline contrasts with 31% adjusted EBITDA growth. The debate is whether hedge losses are temporary accounting noise or a warning about future cash conversion.
Risks: the cash-flow metric is non-GAAP and before growth spending. Power prices, interest costs, Cogentrix integration and up to $1.5B of possible Helix funding can change the result.
Sources: Vistra Q2 2026 release; Reuters; MarketWatch; MarketScreener. Figures are company-reported or market data and remain subject to revision.
A U.S. judge permanently blocked the Pentagon's designation of Anthropic as a supply-chain risk. The ruling removes a major procurement threat as the private…
·2 min read
OTHER TREND · Anthropic v. Pentagon
Blacklist removed; procurement risk narrows
Federal ruling · August 28, 2026
14:45 PDT Court and company data snapshot
Contract at dispute
$200M
military AI award
Private valuation
$380B
February 2026
Funding round
$30B
Series G
Court result
Blocked
permanently
Decision map
Question
Result
Supply-chain designation
Unlawful, arbitrary
First Amendment
Retaliation found
Fifth Amendment
Due process denied
Government remedy
Rescind label and notices
Pentagon vendor choice
Still discretionary
Investor bridge
The $200 million contract is small relative to valuation. The material channel is distribution: a supply-chain label could have reached contractors, civilian agencies and enterprise partners.
Government accessEnterprise trustIPO riskModel policy
Transmission
Court rescinds blacklist
→
Partner eligibility improves
→
Revenue tail risk falls
→
Private valuation support
Watch: government appeal, the separate Washington case, Pentagon vendor substitutions and any revised federal AI-use terms.
Sources: Reuters and Associated Press ruling reports; public court record; EFF contract background. Figures current August 28, 2026, 14:45 PDT.
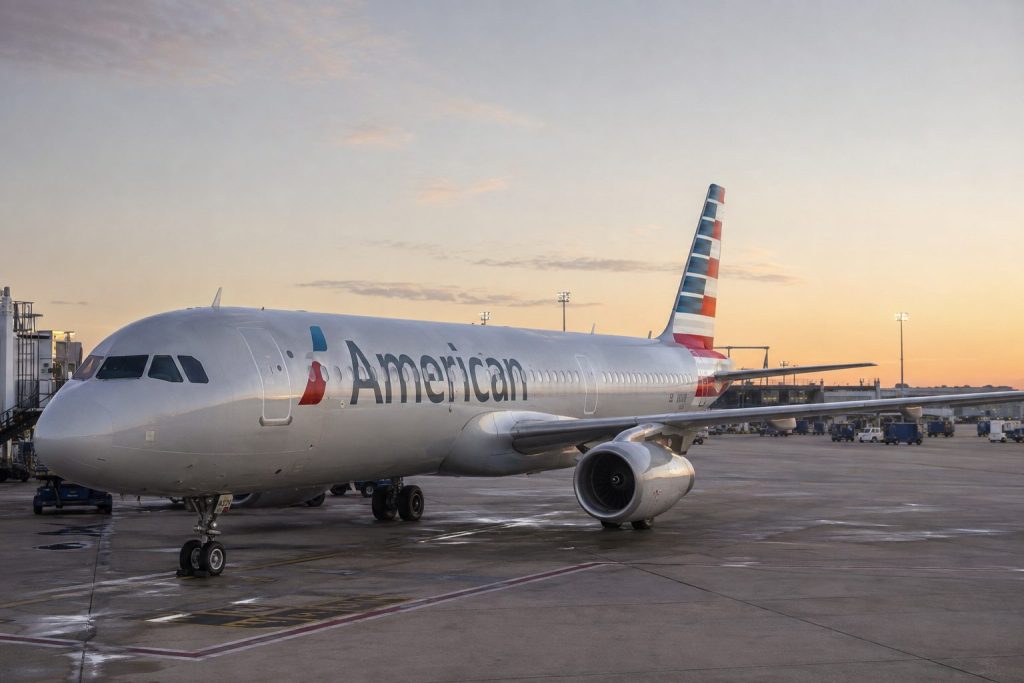
American Airlines Group generated roughly $866 million of stock turnover on Friday. Yet the shares moved only eight cents. The contrast shows investors rotating…
·2 min read
NASDAQ: AAL · turnover without conviction
American Airlines investor dashboard
Market close: Aug. 28, 2026 · 16:00 EDT Checked: Aug. 29, 2026 · 01:57 EDT
Close$13.64−0.58%
Volume63.51M61% of 65-day average
Dollar turnover$866M≈9.6% of market value
Market value$9.03B661.97M shares
Friday peer tape
Carrier
Move
Market cap
American
−0.58%
$9.03B
Southwest
−0.30%
$19.45B
Delta
−1.32%
$53.36B
United
−1.59%
$36.48B
Prices reflect the Aug. 28 close. American changed less than Delta and United despite unusually prominent share activity.
Q2 operating bridge
Revenue +16.3%
Premium PRASM +13.4%
Corporate revenue +26%
Capacity +5.4%
Revenue: $16.7B. GAAP net income: $71M. Adjusted EPS: $0.15.
Fuel and earnings test
Full-year adjusted EPS: −$0.65 to +$0.65. The range leaves valuation highly sensitive to fuel and pricing.
What comes next
Aug. 31 route salesViennaPortoReykjavikA321XLR
Seven new international routes go on sale Monday. Management expects third-quarter revenue growth of 16%–19%, but another $1.7B year-over-year fuel increase.









![UK Stock Market Today 29/08/2026 [UPDATE: 08:49 BST] [Weekly Recap + Week Ahead: Midcaps Lead Before Bailey and Gilt Auction]](https://ts2.tech/wp-content/uploads/2026/08/UK-market-dashboard-2026-08-29-0843-1024x683.jpg "UK Stock Market Today 29/08/2026 [UPDATE: 08:49 BST] [Weekly Recap + Week Ahead: Midcaps Lead Before Bailey and Gilt Auction]")