Regular close
$38.59
−$0.89 · −2.25%
NIKE, Inc. stock fell 2.25% on Wednesday following a downgrade by Truist to Hold from Buy. Truist also lowered its price target to $42 from $47, pointing to softening footwear trends at Dick's Sporting Goods and Foot Locker.
Closes: $41.05, $40.21, $40.76, $40.75, $39.48 and $38.59. The final two sessions cut 5.3% from the stock.
Truist: Hold from Buy.
Target: $42 from $47.
Implied upside: 8.8% to the regular close.
Weak Foot Locker sell-through increased uncertainty around Nike’s turnaround. The $5 target cut equals about $7.4 billion across 1.48 billion shares.
Wholesale rose 6% reported. Nike Direct fell 6%. That makes partner demand the clearest near-term read-through.
| FY2026 revenue | $46.40B |
| Net income | $3.11B |
| Gross margin | 42.9% |
| Cash / debt | $9.03B / $11.04B |
| Trailing / forward P/E | 18.4× / 22.5× |
| Free cash flow | $2.18B |
| Measure | Value | Vs. $38.59 close |
|---|---|---|
| Consensus | Hold · 39 analysts | — |
| Average target | $50.52 | +30.9% |
| Median target | $46.50 | +20.5% |
| Low / high | $23 / $94 | −40.4% / +143.6% |
| FY2027 revenue estimate | $45.67B | −1.6% YoY |
| FY2027 EPS estimate | $1.71 | +8.5% YoY |
| 52-week range | $38.41–$79.51 |
| 50-day average | $42.15 |
| 200-day average | $52.28 |
| 52-week return | −51.3% |
| Dividend record date | Sep. 1 |
| Dividend payment | Oct. 1 |
Wholesale grew while Direct contracted. Cleaner partner inventories and stronger 2027 launches could turn that distribution shift into sustained revenue growth. The average analyst target leaves 30.9% upside.
Foot Locker’s flat-to-down-2% comparable-sales outlook points to weak legacy sneaker demand. Persistent promotions could reduce future Nike orders and compress gross margin. The analyst low target is $23.

| Total revenue | $46.4B · flat |
| North America | $20.5B · +5%* |
| Apparel | +4%* |
| Gross margin | 42.9% · +20bp |
| Inventory | $7.5B · flat |
| Direct digital sales | −12% |
| NFC North | Chicago · Detroit |
| Green Bay · Minnesota | |
| AFC South | Houston · Indianapolis |
| Jacksonville · Tennessee | |
| First game | Week 3: IND–HOU |
| Final debut | Week 16: CHI–GB |
| Aug. 25 close | $39.48 |
| Daily move | −3.12% |
| Volume | 41.3M |
| Prior-day volume | 18.8M |
| Analyst consensus | Hold |
| Average target | $50.66 · +28.3% |
| Launch sell-through | First 7 and 30 days |
| Restocks | Team and size depth |
| nike.com traffic | Direct-channel conversion |
| Markdowns | Price integrity |
| Licensed mix | Wholesale vs. direct |
| Repeat demand | Game-week spikes |
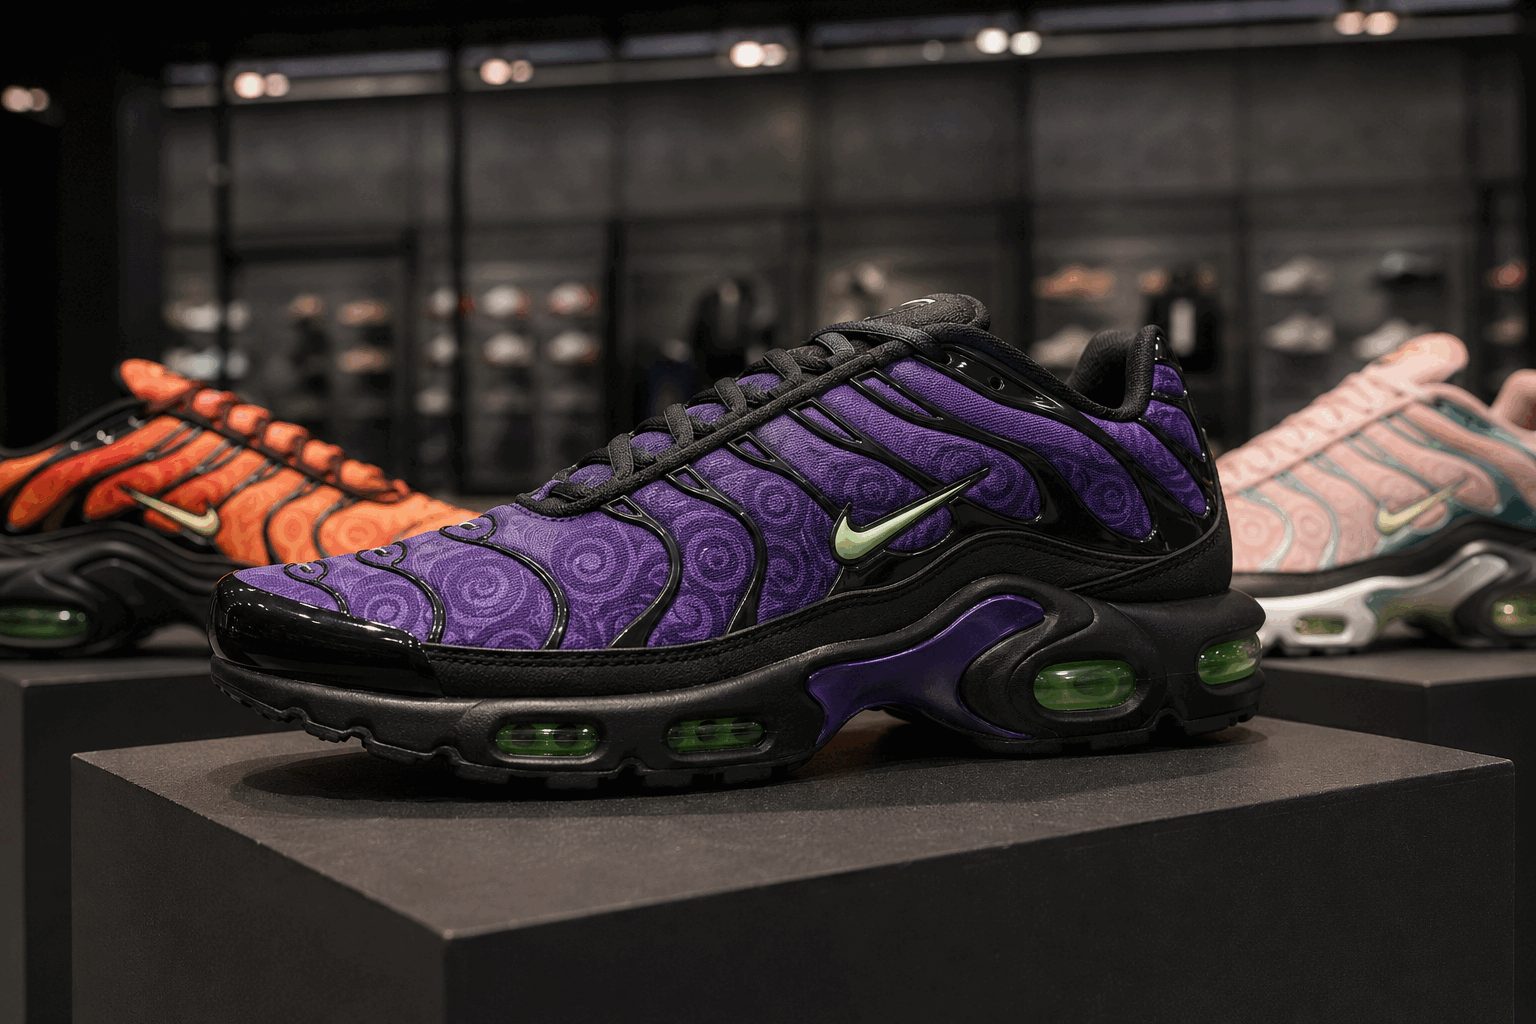
The One Piece drop matters most as a SNKRS traffic and full-price sell-through test.
Watch inventory duration, app ranking, resale premium and markdowns—not search volume alone.
| Marker | Target | vs. close |
|---|---|---|
| JPM / Wells | $40 | -1.8% |
| Median | $47 | +15.3% |
| Average | $50.66 | +24.3% |
| Bernstein | $68 | +66.9% |
Bull case: quick full-price sell-through would support Nike's effort to rebuild scarcity and digital engagement. Bear case: a tiny allocation can sell out without improving broad demand. JD Sports' 6.8% North American comparable-sales fall keeps the recovery bar high.
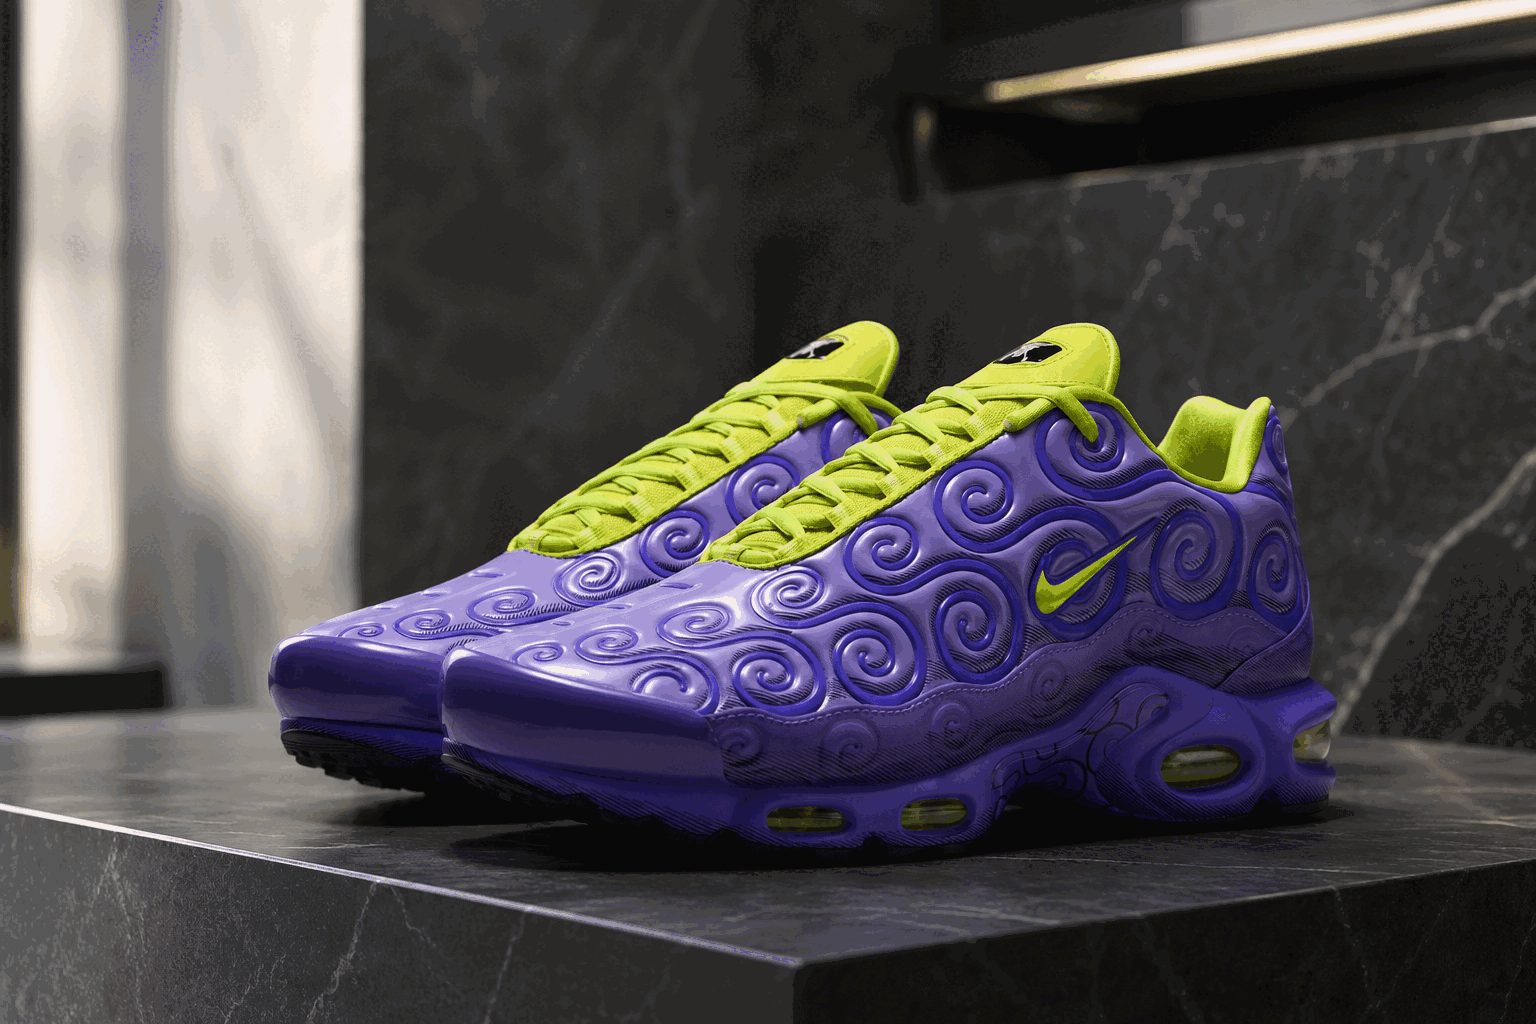
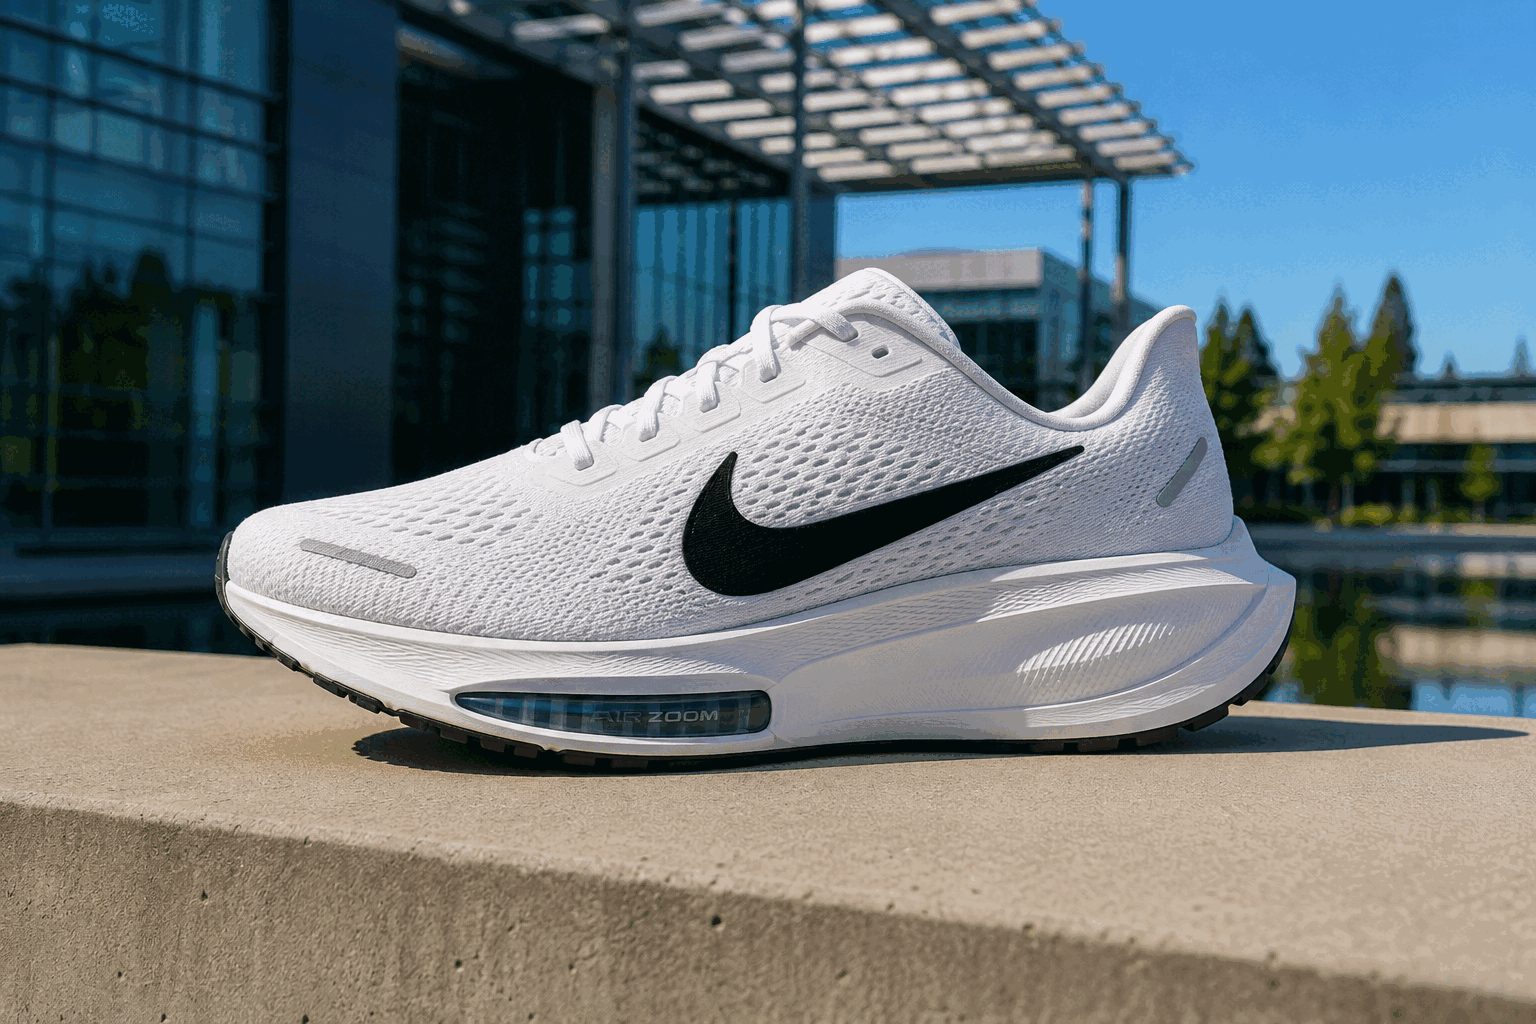
The product is faster. The harder test is whether Nike can turn 18% more energy return into full-price sales while a major retailer reports a 6.8% North American decline.
*Includes about 900 basis points from expected IEEPA tariff recovery.
Pegasus Plus 2 must work in both partner stores and Nike's owned channels.
JD Sports Q2 like-for-like sales, 13 weeks ended Aug. 1, 2026.
39-analyst July consensus. JPMorgan moved to Underweight with a $40 target on Aug. 4.
Nike has recovered from Monday's 12-year closing low, but price alone does not settle the turnaround debate. Wholesale is growing while Direct and China shrink. The stock needs evidence that product demand—not channel loading or one-off refunds—can rebuild earnings.
On Tuesday, shares regained 57% of Monday’s decline. Most Wall Street analysts still rate the stock as Hold.
Consensus: Hold. J.P. Morgan most recently set its price target at $40.
| Metric | FY2026 actual | FY2027 consensus | Change |
|---|---|---|---|
| Revenue | $46.40bn | $45.67bn | -1.6% |
| Adjusted EPS | $1.58 | $1.71 | +8.4% |
| Gross margin | 43.25% | 41.74% | -151 bp |
| Free cash flow | $1.89bn | $3.06bn | +61.9% |
FY2027 numbers reflect early consensus estimates and are not official guidance from Nike.
The read-through: Nike’s target gap appears sizable, yet most analysts are not advising to buy the stock. The real test comes if revenue steadies while free cash flow improves. China is the key factor: a $1 billion decline in sales from the online overhaul would represent roughly 2.2% of projected group revenue for fiscal 2026.
Sources: S&P Global market data via StockAnalysis, Nike’s fiscal 2026 report, Reuters, and Nike dividend announcement. Market data may experience delays.