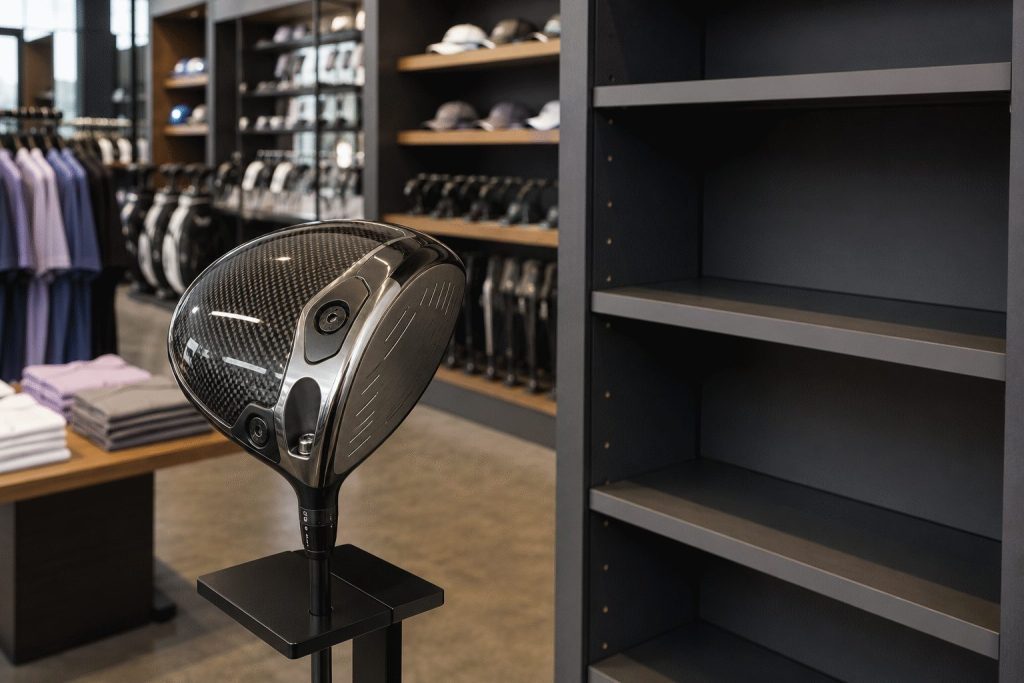
CARLSBAD, California, August 27, 2026, 11:18 – Callaway shares fell 1.3% as retailers take Good Good products off shelves, reacting to backlash over a…
·3 min read
NYSE: CALY · Product catalyst
Callaway’s retail-distribution test
A co-branded driver campaign moved from reputational risk to shelf-space risk.
Market data: Aug. 27, 2026 10:54 EDT · regular session
Share price
$15.54
−$0.20 · −1.27%
Range: $15.46–$15.81
Market value
$2.95B
≈$38M erased
Estimate from price change
Q2 equipment sales
$430.3M
+4.5% year over year
70.3% of quarterly sales
Equipment margin
23.3%
+480 bps year over year
Segment operating margin
Investor bridge
The financial question is duration. A brief pause is manageable; a prolonged retail suspension weakens distribution for a segment producing $100.3 million of quarterly operating income.
Financial baseline
Metric
Q2 2026
YoY
Net sales
$612.2M
+2.0%
Golf Equipment sales
$430.3M
+4.5%
Equipment operating income
$100.3M
+31.6%
Adjusted EBITDA
$124.9M
+35.8%
Full-year EBITDA outlook
$246M–$260M
Raised Aug. 4
What changes next
NowTrack whether Dick’s, Golf Galaxy and PGA Tour Superstore restore Good Good inventory.
Near termWatch Callaway’s investigation, approval-process changes and any partnership reset.
Next reportCompare equipment sell-through and Q3 sales guidance of $415M–$435M.
Risks and sources
Retail reports do not disclose affected units or Callaway’s collaboration revenue. Thursday’s stock decline may reflect broader trading. A rapid restocking could make the financial effect immaterial.
SANTA CLARA, California, August 27, 2026, 10:37 EDT — ServiceNow's stock soared 9%, translating to an added $11.7 billion in market value as Salesforce's…
·3 min read
NYSE: NOW · Stock move
ServiceNow re-rating dashboard
Salesforce's AI results pulled enterprise software higher.
Market snapshot Aug. 27, 2026 · 10:37 EDT
NOW price
$137.16
+9.03% · +$11.36
Value created
≈$11.7B
Based on 1.03B shares
Volume
10.52M
64.7% of 20-day average by 10:37
Consensus upside
3.7%
$142.23 average target
The gap compressed
What powered the move
Salesforce stock+20.75%
Agentforce + Data 360 ARR$3.9B · +210%
Agentforce ARR>$1.5B · +240%
FY27 revenue outlook$46.1B-$46.4B
Salesforce market data at 10:28 EDT; operating metrics released Aug. 26.
ServiceNow operating engine
Q2 subscription revenue$3.877B · +24.5%
Q2 cRPO$13.20B · +21%
Q2 RPO$29.0B · +21%
FY26 subscription guide$15.760B-$15.780B
FY26 FCF margin guide35%
Valuation and expectations
Market capitalization$141.80B
Forward P/E27.76×
Forward price/sales7.36×
EV/free cash flow28.78×
Analyst ratingStrong Buy · 49 analysts
Software read-through
Company
Price
Move
ServiceNow (NOW)
$137.16
+9.03%
Salesforce (CRM)
$248.29
+20.75%
Workday (WDAY)
$197.39
+3.48%
Oracle (ORCL)
$150.84
+1.32%
NOW at 10:37 EDT; peer prices at about 10:28 EDT on Aug. 27, 2026.
Near-term checks
2:40 p.m. EDT today ServiceNow CFO Gina Mastantuono speaks at Deutsche Bank's technology conference.
Next quarter Watch whether cRPO holds near 20% constant-currency growth and AI ACV converts into subscriptions.
Risk The rally is a peer read-through. Average target upside is now only 3.7%.
Trend context, correctly dated
The U.S. search phrase “now stock” also points to ServiceNow's expanded Tech Mahindra partnership. It was announced Aug. 20, not today. Tech Mahindra says its ServiceNow deployment handles more than 100,000 monthly cases across 90 countries, supports 150,000 employees and has optimized about 25% of first-level support work.
Revenue and bookings proofValuation re-ratingExecution checkpoint
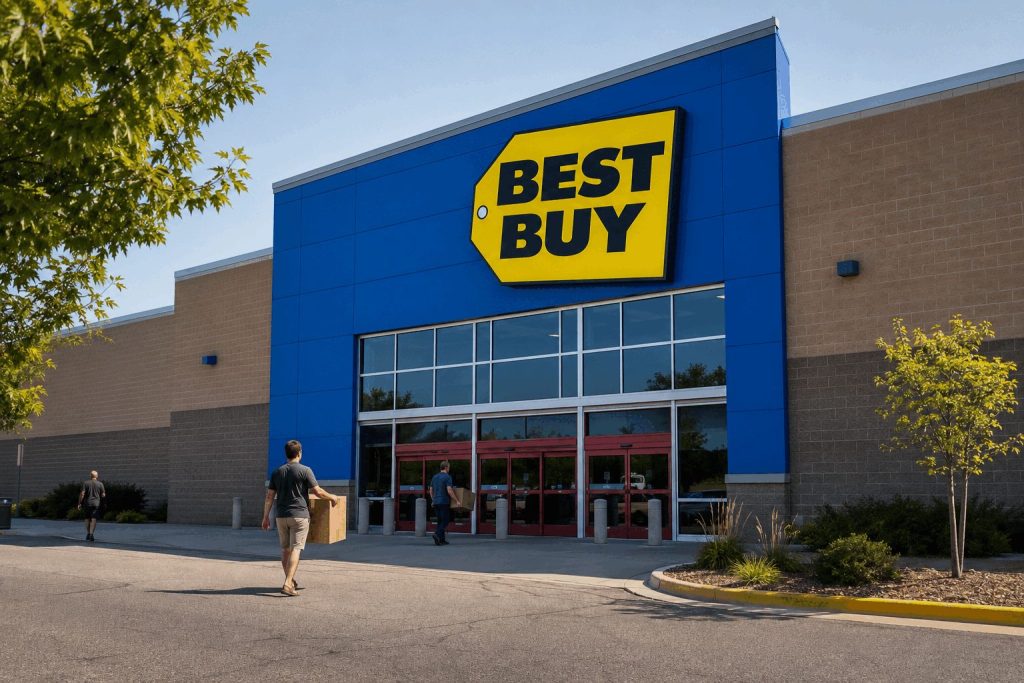
Best Buy Co. stock dropped 5.4% even after reporting quarterly results that topped estimates and raising its full-year forecast. Shares were last at $82.73…
·3 min read
Best Buy Co., Inc. · NYSE: BBY
A better quarter meets a tougher quality test
Market snapshot: August 27, 2026, 10:29:49 EDT
U.S. regular session
Share price
$82.73
−$4.71 · −5.39%
Market cap
$17.47B
~$995M erased
Q2 comparable sales
+4.1%
+250 bps year over year
FY27 EPS midpoint
$6.80
+$0.35 · +5.4%
Intraday reaction
The stock recovered from its session low but remained below Wednesday’s close after an initial volatile reaction.
Investor bridge
Equity-value loss
$995M
1.11× the $900M revenue-guidance midpoint increase.
29.3× the $34M tariff refund.
The response suggests investors discounted the durability of the stronger profit outlook.
Quarterly scorecard
Metric
Q2 FY27
Q2 FY26
Revenue
$9.779B
$9.438B
Comparable sales
+4.1%
+1.6%
Adjusted operating margin
4.3%
3.9%
Adjusted EPS
$1.47
$1.28
Domestic online sales
+5.1%
+5.1%
International comps
−1.8%
+7.6%
Guidance reset
FY27 measure
New
Prior
Revenue
$42.3B–$42.8B
$41.2B–$42.1B
Comparable sales
+1.9% to +3.0%
−1.0% to +1.0%
Adjusted operating margin
4.4%–4.5%
4.3%–4.4%
Adjusted EPS
$6.70–$6.90
$6.30–$6.60
Capital expenditure
~$750M
~$750M
What drove the domestic margin lift
Implied rate lift
$54M
Tariff refund
$34M
A 60-basis-point increase applied to $9.07B of domestic revenue implies about $54M. The refund equals roughly 63% of that amount; this is a transparent approximation, not company guidance.
Valuation and consensus
Forward P/E on new midpoint
12.2×
Consensus: Hold 25 analysts Average target: $83.40 Range: $62–$95
The live price sits about 0.8% below the average target.
Demand signals
Positive: computing, home theater, AI glasses, trading cards, Marketplace and Best Buy Ads.
Mixed: memory costs lifted average selling prices by a mid-single-digit rate while unit sales fell by a high-single-digit rate.
Weak: traditional gaming, appliances and international comparable sales.
August 27 · Market reactionShares down 5.39% at 10:29:49 EDT after touching $77.00.
Fiscal Q3 · Next operating testComparable-sales guidance +1% to +3%; adjusted operating margin 4.1%–4.2%.
November 1 · CEO transitionJason Bonfig is scheduled to succeed Corie Barry.
Risk monitor
Watch unit volumes, memory inflation, appliance replacement demand and fuel costs. A weaker holiday build could expose how much of the annual raise came from the one-time refund rather than repeatable margin gains.
Sources: Best Buy Q2 FY27 release; Reuters; Google Finance; MarketScreener. Market figures observed August 27, 2026, 10:29:49 EDT. Calculations use rounded public inputs.
CAMBRIDGE, Massachusetts, August 27, 2026, 10:15 Moderna stock slid 5.0% on Thursday, shaving $3.0 billion off its market value, after the company announced a…
·3 min read
Moderna, Inc. · NASDAQ: MRNA
Convertible financing resets the rally math
Intraday snapshot: August 27, 2026, 10:15:13 EDT
U.S. regular session
Share price
$142.20
−$7.46 · −4.98%
Market cap
$56.54B
Implied loss: ~$2.97B
Base notes
$2.0B
Up to $2.3B with option
Trading activity
7.34M
Shares by 10:15 EDT
Session path
The stock recovered from its session low but remained 5.0% below Wednesday’s close.
Investor bridge
Equity value lost / base notes
1.48×
Base notes / June liquidity
28.9%
The market erased about $2.97 billion while Moderna proposed $2.0 billion of base financing.
Financing terms
Term
Current disclosure
Security
Senior unsecured convertible notes
Maturity
2032
Regular interest
None
Purchaser option
$300M for 13 days
Settlement
Cash, shares or both
Capped-call threshold
At least 150% premium at pricing
Liquidity and burn
Metric
Amount
Read-through
Cash + investments
$6.9B
June 30
Q2 operating cash outflow
$526M
Base notes = 3.8×
Q2 net loss
$782M
Base notes = 2.6×
July settlement payment
$950M
Post-quarter cash use
2026 year-end cash guide
$4.7B–$5.2B
Before new deal update
Catalyst timeline
July 31 · Q2 resultsRevenue $145M; net loss $782M; year-end cash guidance improved to $4.7B–$5.2B.
August 19 · Melanoma Phase 3Positive recurrence-free and distant-metastasis-free survival results drove a sharp pipeline revaluation.
August 27 · Convertible proposal$2.0B base deal, plus $300M option; pricing and conversion terms remain pending.
Analyst expectations
Consensus
Hold
23 analysts · average target $104.53
−26.5% versus $142.20
Target dispersion is wide after the oncology-data rally. The financing terms now add a separate dilution and balance-sheet variable.
What the stock is pricing
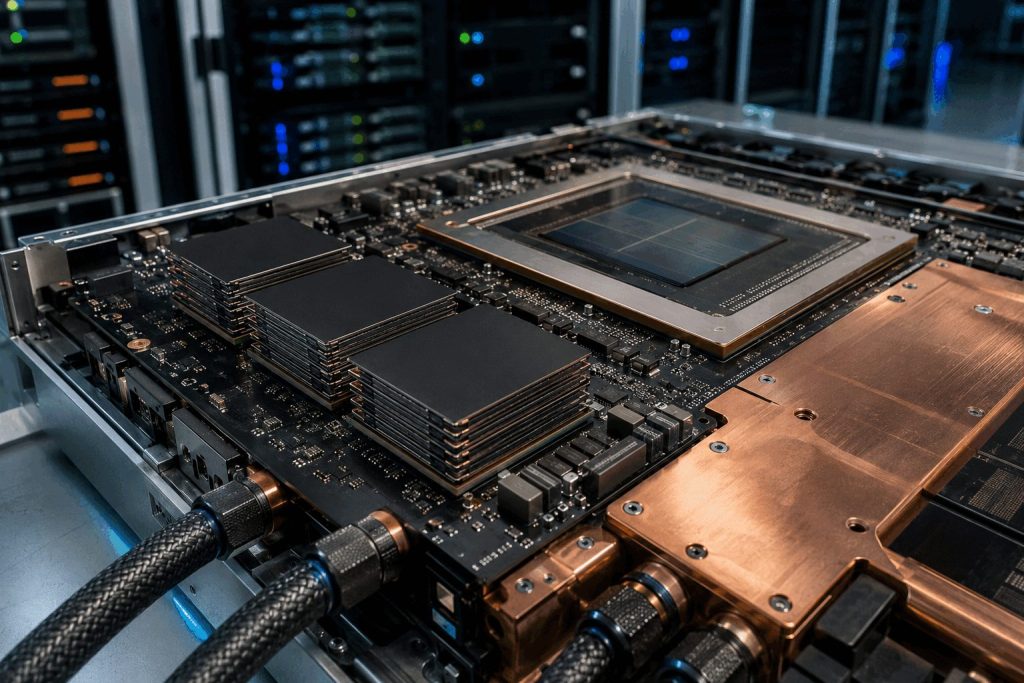
The financing converts part of the recent oncology revaluation into liquidity. No regular coupon limits cash interest, but conversion can expand the share count. The capped call only protects up to its final cap.
Next checks
Pricing: conversion rate, premium and net proceeds. Hedging: capped-call cost and counterparties’ trading. Use of funds: oncology investment versus debt repayment. Risk trigger: weaker clinical or regulatory progress after leverage rises.
Sources: Moderna August 27 financing announcement; Moderna July 31 quarterly results; Google Finance; MarketScreener. Calculations use the $142.20 share price and $56.54 billion market capitalization observed at 10:15:13 EDT on August 27, 2026. Values are rounded.
New Haven, Connecticut, August 27, 2026, 10:20 – Biohaven shares fell 7.1%, retracing nearly half of the gains made after its $400 million deal…
·3 min read
Biohaven: the $400 million cash deal meets a 7.1% reversal
NYSE:BHVN • regular session • market data through August 27, 2026, 10:19 EDT
Share price
$15.75
−7.08% vs. Wednesday close
Wednesday move
+17.87%
$14.38 → $16.95
Near-term cash
$400M
$350M at close; $50M one year later
Quoted value
$2.38B
151.04M shares × $15.75
Two-session price path
Thursday’s $1.20 decline gave back 46.7% of Wednesday’s $2.57 gain. The shares still held 9.5% above the pre-deal close.
Deal scale
$400M equals 1.48× June liquidity and 16.8% of current market value. The $795M ceiling includes contingent amounts.
Transaction economics
Component
Amount / rate
Investor meaning
Cash at closing
$350M
Non-refundable; subject to closing
Deferred upfront
$50M
Payable one year after closing
Development/regulatory
Up to $150M
Milestone-dependent
Knopp obligations
Up to $245M
Assumed by SK after closing
U.S. royalties
Mid-teens to low twenties
Requires approval and commercial sales
Ex-U.S. royalties
Mid-single digits
Lower overseas participation
Liquidity and burn markers
June 30 liquidity
$270.5M
Q2 net loss
$137.3M
Q2 R&D
$100.8M
Q2 G&A
$24.1M
Illustrative post-close liquidity
$620.5M
The illustrative balance adds $350M to June liquidity. It is not a forecast and excludes later spending, reimbursements and balance-sheet changes.
Market activity and valuation
Measure
Reading
Timestamp / basis
Thursday range
$15.50–$17.05
10:19 EDT
Thursday volume
962,594
10:19 EDT
Wednesday volume
15.77M
5.2× 65-day average
52-week range
$7.48–$18.57
Through Aug. 27
Consensus
Overweight
11 Buy, 1 Overweight, 3 Hold, 1 Underweight
Average target
$22.07
+40.1% vs. $15.75
Target range
$10–$42
−36.5% to +166.7%
Peer tape
Company
Price
Move
Market value
Biohaven BHVN
$15.68
−7.49%
$2.36B
Vera Therapeutics VERA
$34.83
−5.42%
$2.50B
Wave Life Sciences WVE
$5.07
−3.15%
$1.03B
uniQure QURE
$50.22
−1.43%
$3.33B
Peer quotes are from 10:04–10:06 EDT. Biohaven underperformed this small clinical-biotech comparison at that snapshot.
What changes next
Closing Antitrust clearance and customary conditions unlock the first $350 million.
2H 2026 RISE3 topline results test opakalim’s efficacy and the value of milestones and royalties.
After closing SK funds specified development costs while Biohaven continues RISE2, RISE3 and filing preparation.
Risk monitor
Weak RISE3 data could reduce milestone and royalty value. Closing delay would postpone liquidity. SK also has post-closing termination rights, while Biohaven has traded direct commercial ownership for cash and royalties.
BOISE, Idaho, August 27, 2026, 09:39 EDT — Micron Technology's stock has erased 82% of its Nvidia-driven opening gap, with attention staying on its…
·3 min read
Google Trend: MU · NASDAQ:MU
Micron’s Nvidia gap faded fast
The AI-memory read-through remains strong. Price action says investors still want Micron-specific proof on HBM volume, pricing and margins.
Market open · 09:39 EDT
Micron price
$943.46
+$5.06 · +0.54%
Opening gap
+3.05%
82% erased by 09:39
$1,300 target
+37.8%
8.4× FY2027 EPS estimate
Analyst consensus
$1,515
Strong Buy · 47 analysts
Ten-session price path
August 27 value is intraday at 09:39 EDT; earlier values are official closes. The stock opened at $967.01 before fading.
Fundamentals and valuation
Metric
Current / latest
Comparison
Investor reading
Fiscal Q3 revenue
$41.46B
$23.86B prior quarter
+73.8% sequential
Operating cash flow
$25.39B
$11.90B prior quarter
Cash conversion strengthened
Adjusted free cash flow
$18.3B
$7.1B capex
Funds expansion internally
Adjusted gross margin
84.9%
74.9% prior quarter
Exceptional, hard to sustain
Forward P/E
6.5×
21.2× trailing
Large earnings-cycle assumption
Net cash
$23.75B
$21.03 per share
Balance-sheet cushion
AI-memory transmission chain
Nvidia Q2 revenue
$96.2B
+106% year over year
Data-center revenue
$89.0B
+117% year over year
Nvidia Q3 outlook
$108B
±2%; excludes China compute
Micron HBM4
>2.8 TB/s
36GB 12-high; Rubin design
HBM is stacked memory placed beside AI accelerators. Higher accelerator shipments increase the addressable memory content, but Micron’s realized revenue still depends on qualification, allocation, pricing and yield.
Targets and next check
Reference
Target / value
Upside from $943.46
Implied FY2027 P/E
Current price
$943.46
—
6.1×
BMO / Mizuho
$1,300
37.8%
8.4×
Analyst average
$1,515
60.6%
9.8×
Analyst low
$361
−61.7%
2.3×
Analyst high
$2,200
+133.2%
14.2×
Next dated catalyst: Micron reports fiscal fourth-quarter results on September 30 at 2:30 p.m. Mountain time. Watch HBM shipments, memory pricing, gross margin and fiscal 2027 capex.
Main risk: A slower AI-server buildout, weaker HBM pricing or faster rival capacity additions could compress the earnings estimate that makes Micron appear inexpensive.
Mercer International's 60% premarket surge disappeared after Thursday's opening bell. The reversal showed how quickly a US$14 million funding headline met the company's much…
·3 min read
Mercer International · NASDAQ:MERC
The aid spike met the balance sheet
Peace River support is material to the equity value, but small beside enterprise obligations.
Market snapshot August 27, 2026 · 09:34 EDT / 15:34 CEST
Premarket
$0.6600
+59.8% at 09:28 EDT
Regular range
$0.402–0.442
Gain erased after the open
Volume
56.0M
About 41× the 65-day average
Canada support
C$20M
About US$14M; 95% repayable
One headline, two valuations
The premarket equity-value gain was about US$16.6M—1.18× the entire package. At the regular high, the gain shrank to roughly US$1.9M.
Financial frame
Q2 / June 30
Value
Signal
Revenue
US$460.3M
+1.5% YoY
Operating EBITDA
−US$21.0M
Negative
Net loss
−US$76.0M
5.4× aid
Cash
US$78.8M
Aid = 17.8%
Aggregate liquidity
US$191.7M
Aid = 7.3%
Shareholders' deficit
−US$98.0M
Capital risk
Operating signals
Pulp segment revenueUS$325.1M · −2.2% YoY
Pulp segment EBITDA−US$12.7M
Energy & chemical revenueUS$21.7M · +17%
Q2 inventory impairmentUS$29.0M
Cost savings since Apr. 2025US$54.0M
Mass-timber order bookAbout US$151M
Valuation lens
Wednesday equity valueUS$27.7M
Premarket equity valueUS$44.2M
Enterprise valueAbout US$1.60B
Aid / enterprise value0.9%
Shares outstanding67.0M
52-week range$0.40–$3.38
Catalyst timeline
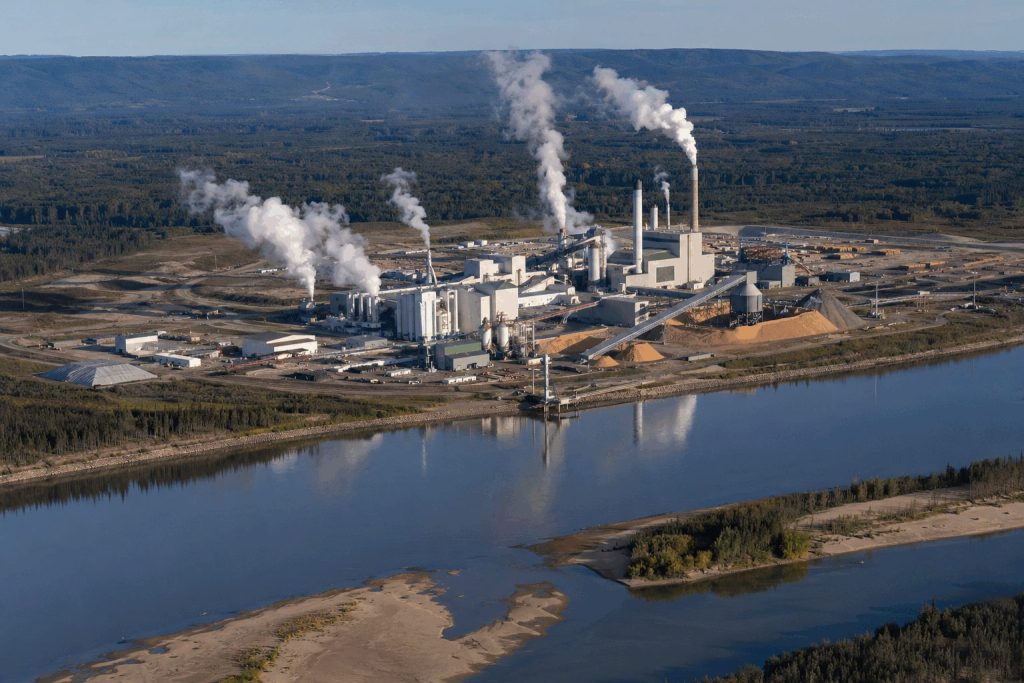
Mercer reports a US$76.0M Q2 loss and says advisers are evaluating financing and liquidity alternatives.
Canada commits C$20M for Peace River modernization; C$19M is repayable from 2031.
Shares briefly reach about 76 cents, an 84% after-hours jump.
Premarket quote holds at 66 cents, up 59.8%.
Regular trades sit near the prior close as volume reaches 56.0M.
Expectation and risk map
What can workModernization can lower mill costs. Bioenergy could extend the 17% growth in energy and chemical revenue. Public's August 27 compilation shows four analysts at Sell with a US$1.38 average target.
What can breakThe package is mostly debt-like. Pulp EBITDA is negative, equity is in deficit and noteholder talks may not produce a transaction. Sub-dollar trading and extreme turnover raise liquidity risk.
Six Flags Entertainment Corporation is under renewed safety scrutiny after two severe brain hemorrhages were reported in connection with its X2 roller coaster within…
·3 min read
Google Trend · six flags brain injury
X2 safety review meets peak-season economics
Six Flags Entertainment · NYSE: FUN · Company/product catalyst
Market snapshot: August 27, 2026, 09:16 EDT Quote timestamp: August 27, 08:45 EDT Financials: quarter ended June 28, 2026
Aug. 26 close
$16.13
−2.77% · 16:00 EDT
Premarket
$16.09
−0.25% · 08:45 EDT
Market value
$1.65B
August 26 close
Gross debt
$5.02B
June 28 · 3.0× equity value
Guest-spending sensitivity
Liability cushion already on the books
Incident and disclosure path
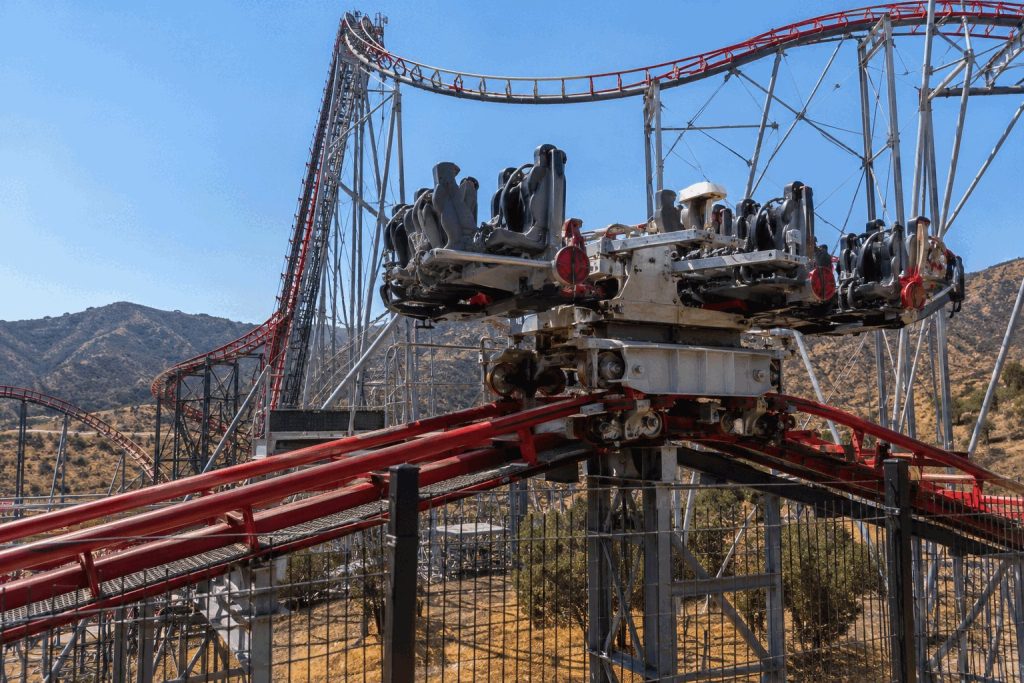
July 5Fire crews respond to an unconscious rider; Cal/OSHA opens an inspection.JulyCNN reports two women suffered similar brain hemorrhages within six days of riding X2.Aug. 14X2 confirmed closed for weeks; no reopening date disclosed.Aug. 27U.S. search interest rises around “six flags brain injury.”SeptemberJury trial scheduled in a separate lawsuit alleging a fatal 2022 injury.
Latest operating baseline
Q2 measure
Reported
Change
Revenue
$864.9M
−7.0%
Attendance
13.13M
−7.5%
Per-capita spending
$62.89
+0.7%
Operating income
$88.6M
+19.0%
Net loss
−$202.6M
Wider
Same-park revenue
$864.5M
+2.4%
Valuation and expectations
Analyst recommendation
Overweight
Average target
$21.71
Coverage
16 ratings
Target upside vs. Aug. 26 close
34.6%
52-week range
$12.51–$27.37
Short interest
18.62% of float · Aug. 14
What can move the numbers
Reopening
A prompt X2 return would contain attendance risk.
Inspection
A design finding could raise repair and compliance costs.
Claims
Reserve increases would flow directly through earnings.
Reputation
Broader safety concern could affect passes and day tickets.
Leverage
$5.02B of gross debt reduces tolerance for cash shocks.
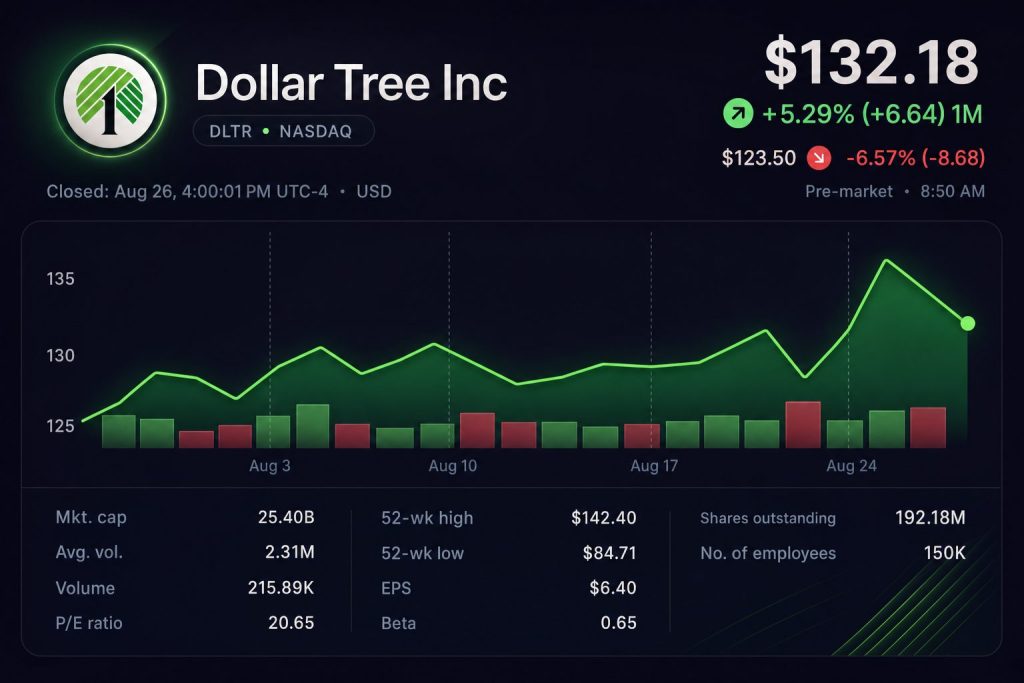
Dollar Tree, Inc. dropped 7.47% to $122.30 as of 08:30 EDT after issuing a weaker third-quarter profit outlook, despite surpassing earnings expectations. Premarket trading…
·3 min read
NASDAQ: DLTR · Earnings reaction
Dollar Tree: refund windfall meets a reinvestment bill
Market data: Aug. 27, 2026, 08:30 EDT Q2 ended Aug. 1; reported Aug. 27
Premarket price
$122.30
-$9.88 · -7.47%
Implied value loss
$1.90B
Estimate using 192.4M shares
Q2 sales
$4.89B
+7.0% year over year
Q2 adjusted EPS
$2.70
$1.31 refund benefit
What moved the shares
Q3 EPS gap compares the $0.875 guidance midpoint with the $1.40 consensus. Planned refund reinvestment explains nearly the entire difference.
Tariff-refund ledger
IEEPA refunds
+$383M
Cost-of-sales reinvestment
-$22M
SG&A reinvestment
-$15M
Specified duties
-$13M
Net pre-tax effect
≈$333M
Company figures for Q2 fiscal 2026.
Operating scorecard
Metric
Q2 2026
Change
Comparable sales
3.7%
Ticket +3.3%; traffic +0.4%
Gross margin
42.9%
+850 bp
Operating margin
14.1%
+900 bp
Operating income
$690M
+198.7%
Free cash flow
$675M
Quarter total
Guidance and valuation signals
Fiscal 2026 sales
$20.5B-$20.7B
Maintained; comparable sales +3% to +4%
Fiscal 2026 adjusted EPS
$7.70-$8.05
Includes about $0.60 from refunds
At $122.30, the stock trades near 15.5× the full-year EPS midpoint. The average analyst target is $127.90, about 4.6% higher.
The key test is whether 50 cents of planned reinvestment lifts traffic before tariff refunds fade. Lower shrink or sustained ticket growth would soften that risk.
Volato Group, Inc. jumped 55.31% on Wednesday as the firm announced a merger with Alignment Engine. The private AI-infrastructure company was valued at about…
·3 min read
Volato Group · NYSE American: SOAR
$500M deal meets a $13M equity base
Alignment Engine merger · AI infrastructure · Ohio powered campus
Market snapshot: August 27, 2026, 08:18 EDT Financials: quarter ended June 30, 2026
August 26 close
$0.2429
+55.31% at 16:00 EDT
Premarket
$0.20
−17.21% at 08:08 EDT, August 27
Volume
779.55M
19.9× the 65-day average · August 26 close
Quoted market value
$13.03M
August 26 close
Transaction scale
The $4.6M market-value gain was less than 1% of the transaction valuation. Preferred-stock terms decide how much value reaches existing common holders.
Powered-campus runway
Operating baseline
Metric
Figure
Signal
Q2 revenue
$0.965M
Small base
Q2 net loss
−$2.051M
Loss exceeds revenue
Cash
$8.440M
June 30
H1 operating cash use
−$2.855M
Funding need remains
H1 financing cash
+$6.953M
Mostly equity-linked
Analyst consensus
None
Zero current ratings
Common-share expansion
Deal path
Aug. 26Definitive merger announced; Alignment Engine valued near $500M.ClosingExpected shortly after signing, subject to customary conditions.After closingSOAR remains the public parent; preferred conversion needs shareholder action.Next filingWatch the exchange ratio, preferred rights, financing and pro forma ownership.
What can break the thesis
Ownership
Undisclosed conversion economics can dilute common holders.
Funding
Campus buildout costs and capital sources remain undisclosed.
Commercial proof
No campus customers, revenue or contracted backlog were reported.
Execution
The path from 154 MW to 480 MW needs permits, equipment and financing.
Liquidity
Extreme turnover and the premarket reversal imply high volatility.
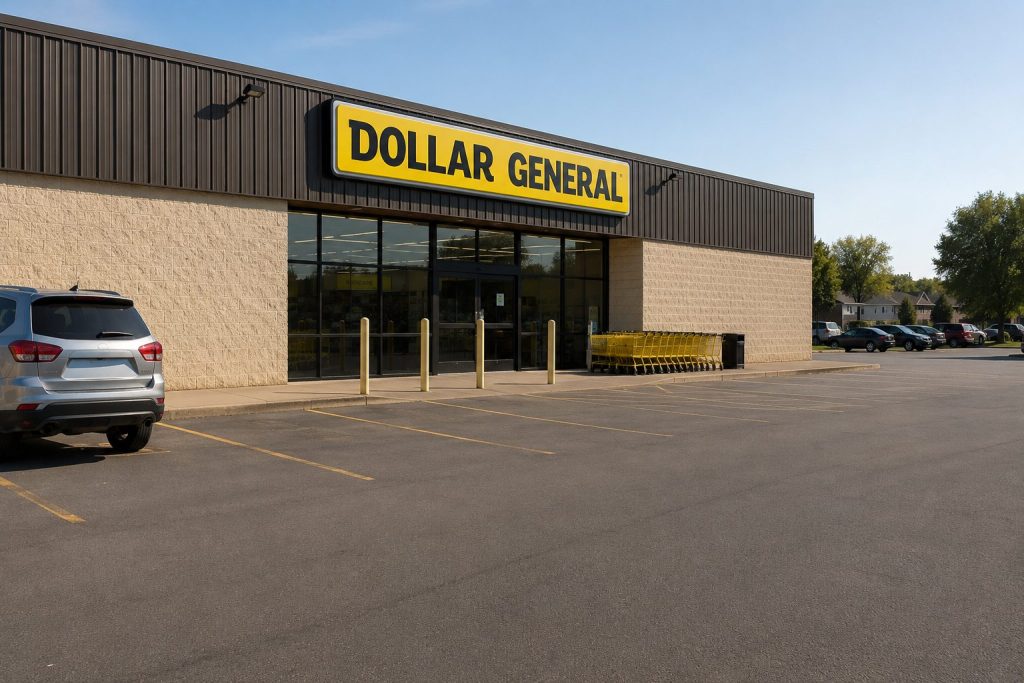
GOODLETTSVILLE, Tennessee, August 27, 2026, 07:30 EDT — Dollar General stock rose 13.3% in premarket trading, adding $3.6 billion in market capitalization as the…
·3 min read
Dollar General · NYSE: DG · Q2 fiscal 2026
Traffic growth meets a partly temporary margin lift
Market: Aug. 27, 2026, 07:30 EDT Quarter ended July 31, reported Aug. 27
Premarket price
$139.11
+$16.33 · +13.30%
Implied value added
$3.60B
4.7× quarterly operating profit
Operating margin
6.81%
+126 basis points year over year
Comparable sales
+3.5%
Traffic +2.0% · ticket +1.5%
Quarterly scorecard
Measure
Q2 FY26
YoY
Net sales
$11.29B
+5.2%
Gross margin
32.60%
+127 bp
Operating profit
$769.2M
+29.2%
Net income
$550.3M
+33.8%
Diluted EPS
$2.48
+33.3%
H1 operating cash flow
$1.50B
Current period
Where margin expansion came from
Gross-margin gain
127 bp
Tariff-refund benefit
81 bp
Other net drivers
46 bp
Refunds supplied about 64% of the gross-margin gain. Management expects no material second-half refund benefit after reinvestment.
Raised fiscal-2026 outlook
Previous
EPS $7.20–$7.45 Sales +3.7%–4.2% Comps +2.2%–2.7%
→
Current
EPS $7.80–$8.00 Sales +4.0%–4.3% Comps +2.5%–2.9%
EPS midpoint rose 7.8%. Guidance includes a $0.25 Q2 benefit from tariff refunds.
Analyst and capital signals
Consensus rating
Buy
Analyst sample
18
Buy / Strong Buy
45%
Hold
56%
Average target
$134.94
Planned H2 buybacks
Up to $700M
Quarterly dividend
$0.59/share
The $139.11 premarket price sat 3.1% above the published average target.
What workedTraffic and ticket both grew. All four merchandise categories posted positive comparable sales.
What must repeatCore margin gains must survive without a second-half tariff-refund contribution.
What can breakFuel, freight, markdowns and pressure on lower-income households could reverse the operating leverage.
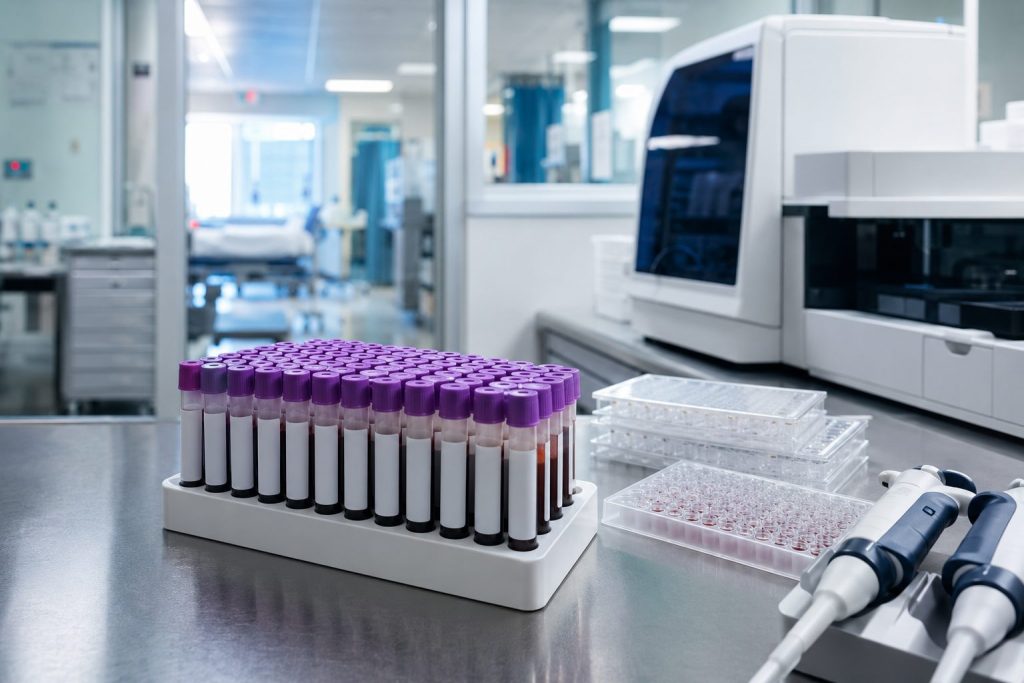
VolitionRx Limited stock surged almost 100% ahead of Thursday’s U.S. market open, following news of clinical validation for its Nu.Q NETs blood biomarker in…
·3 min read
VolitionRx Limited · NYSE American: VNRX
Sepsis validation reprices a cash-burning microcap
Market: Aug. 27, 2026, 07:30 EDT Financials: Q2 ended June 30, reported Aug. 13
Premarket price
$0.67
+97.49% · +$0.33
Premarket volume
143.86M
10.5× implied shares outstanding
Implied value added
$4.50M
86.6% of Q2 operating cash use
Implied equity value
$9.15M
At $0.67 and 13.65M implied shares
Trading and operating snapshot
Measure
Period
Value
Close before catalyst
Aug. 26
$0.34
Premarket range
Aug. 27, 07:30 EDT
$0.66–$0.68
Q2 revenue
Quarter ended June 30
~$0.4M
H1 revenue
Six months ended June 30
$1.4M · +112%
Q2 operating loss
Quarter ended June 30
$4.2M · −34%
Q2 operating cash use
Quarter ended June 30
$5.2M · −18%
Cash
June 30
$2.79M
Scale comparison
Value added
$4.50M
Q2 cash use
$5.20M
Q2 op. loss
$4.20M
The market added almost one quarter's cash consumption. That is meaningful for a microcap, but small beside the funding needed to commercialize diagnostics.
Catalyst-to-revenue ladder
Peer-reviewed clinical validation
→
Licensing agreement
→
Regulatory and reimbursement path
→
Routine clinical adoption
→
Recurring assay revenue
Status at Aug. 27: validation completed; commercial discussions disclosed, but no contract value or revenue timetable announced. The $2.8B annual sepsis opportunity is a company estimate, not guidance.
Commercial riskIndependent validation may not convert into licensing economics, reimbursement or hospital uptake.
Financing riskJune 30 cash was below one quarter's operating cash use. Shares, warrants and an ATM facility funded Q2.
Trading riskPremarket turnover exceeded ten times implied shares. Thin liquidity can amplify both gains and reversals.
Okta Inc. shares surged 20.89% to $162.50 in premarket deals as of 04:08:52 EDT. The gain came after Okta beat quarterly backlog estimates, providing…
·3 min read
NASDAQ: OKTA · Q2 FY2027
The rally prices in a backlog inflection
Current subscription backlog accelerated faster than revenue. Cash conversion improved too. The remaining question is whether the 21% premarket reset outran a modest full-year guidance increase.
Market data: Aug. 27, 2026, 04:08:52 EDT Financials: quarter ended July 31, 2026
Premarket price
$162.50
+20.89%
vs. $134.42 Aug. 26 close
Value added
≈$4.9B
Estimate from $23.57B Aug. 26 market cap
Current RPO
$2.585B
+14% YoY
$75M above consensus
Free cash flow
$227M
+40% YoY
28.1% margin, +5.8 pts
Current backlog regained momentum
Quarterly cRPO rose from $2.499B in Q1 to $2.585B in Q2. Management guides Q3 cRPO to $2.590B–$2.600B, implying 11%–12% year-over-year growth.
Beat, raise and valuation
Q2 revenue$805M · +11%
Revenue beat$12M vs. consensus
Adjusted EPS$1.05 vs. $0.97
FY27 revenue midpoint$3.221B
Midpoint increase+$21M · +0.7%
Analyst mean target$146.34
At $162.50, the premarket price stood 11.0% above Yahoo’s mean analyst target at 04:08:52 EDT.
Operating signals
Subscription mix
$793M of $805M revenue
Non-GAAP subscription gross margin
83.9%, up 0.2 percentage point
Free-cash-flow margin
28.1%, up 5.8 percentage points
Customers above $100K ACV
5,255, up 6% year over year
What must happen next
Test
Latest
Next threshold
Investor read
cRPO growth
14%
11%–12% Q3 guide
Deceleration is already guided
Revenue growth
11%
10% Q3 guide
Backlog must convert cleanly
FCF margin
28.1%
21%–23% Q3 guide
Quarterly seasonality rises
Net retention
107%
Hold or improve
Confirms expansion quality
Risk map
Price riskPremarket gain may reverse when regular liquidity returns.
Growth riskFY2027 revenue still grows only 10%–11%.
Mix riskPartnering out professional services cuts reported growth by about one point.
Execution riskAI-agent products need bookings without weakening renewal economics.