Qantas Airways Limited has launched a limited-time booking promotion that offers double Status Credits or Qantas Points on qualifying flights. The deal provides an…
·3 min read
Qantas Double Rewards
Eight booking days, 346 travel days and an earnings test
ASX closed · 26 Aug 2026, 16:00 AEST
QAN close
A$9.22
−0.32% · −A$0.03
Volume
6.05M
+59% versus Tuesday
Loyalty EBIT
A$286M
1H26 · +12%
Analyst target
A$11.51
+24.8% implied
Offer funnel and timing
Loyalty engine
Members
18.3M+
Points earned
+10%
Points redeemed
+17%
Active members
+7%
All figures are Qantas 1H26 year-on-year measures. Loyalty margin was 20%.
Promotion, product and financial signals
Measure
Latest figure
Why it matters
Reward choice
2× Status Credits or Points
Targets status seekers and redemption users
Hotel stacking
Double hotel points
Supports Hotels and Holidays revenue
Reward seats
2.5M in 1H26
About 14,000 booked daily
EBIT per member
A$15.63 in 1H26
A$286M divided by 18.3M members
FY26 Loyalty guide
+10% to +12% EBIT
Thursday's results benchmark
Consensus FY26 NPAT
A$1.418B
External earnings expectation
Valuation and expectations
Market capitalisation
≈A$13.65B
Trailing P/E
≈8.7×
Dividend yield
≈4.3%
52-week range
A$8.04–A$12.62
Consensus
Buy
Analysts
17
Buys / Holds / Sells
15 / 2 / 0
Target range
A$10.00–A$12.50
What to watch next
FY2026 results on August 27.
Loyalty EBIT versus the 10%–12% growth guide.
Fuel, airport and labour cost inflation.
Evidence that bookings are incremental, not pulled forward.
Future liability from extra points and status benefits.
Market data: Investing.com, ASX close 26 Aug 2026 at 16:00 AEST. Promotion release: 26 Aug 2026 at 11:48 AEST. Financials: Qantas 1H26 results. Analyst consensus: S&P Global / StockAnalysis, retrieved 26 Aug 2026 at 17:40 CEST. Consensus NPAT: MiTrade, retrieved 26 Aug 2026.
MILPITAS, California, August 26, 2026, 11:06 – SolarEdge Technologies shares climbed 7.7% after UBS said the new FCC inverter regulation could strengthen the company’s…
·3 min read
SolarEdge investor dashboard
NASDAQ:SEDG · August 26, 2026, 11:06 EDT
UBS upgrade / FCC inverter rule
Price
$32.17
+$2.29 · +7.66%
Market cap
$1.98bn
≈$141m added
UBS target
$42
+30.6% implied
Volume
2.42m
3.26m average
Why shares are rising
UBS sees a direct revenue and margin channel. FCC limits on new foreign-produced inverter models could tighten U.S. supply. SolarEdge may gain commercial share and pricing power while its margin recovery is already visible.
Valuation and analysts
UBS
Buy · $42
Consensus mix
2 Buy / 10 Hold / 4 Sell
Average target
$35.13 · +9.2%
High / low
$65 / $6.90
52-week range
$28.21–$81.25
Beta
1.49
Turnaround scorecard
Metric
Q2 2026
Q2 2025
Revenue
$346.2m
$289.4m
GAAP gross margin
27.5%
11.1%
GAAP operating loss
-$16.0m
-$115.5m
Adjusted operating income
$10.2m
-$48.3m
Free cash flow
$3.1m
-$9.1m
Next-quarter test
Q3 revenue guide
$310m–$340m
Midpoint vs Q2
-6.1%
Adjusted GM guide
22%–26%
Adjusted opex
$86m–$91m
Net cash/investments
$264.6m
Risks: residential demand remains soft; pricing gains are an analyst forecast, not booked revenue; GAAP losses continue; policy and eligible supply can change.
Sources: SolarEdge Q2 2026 release; Google Finance; Yahoo Finance; UBS upgrade reported August 26, 2026. All market figures timestamped 11:06 EDT.
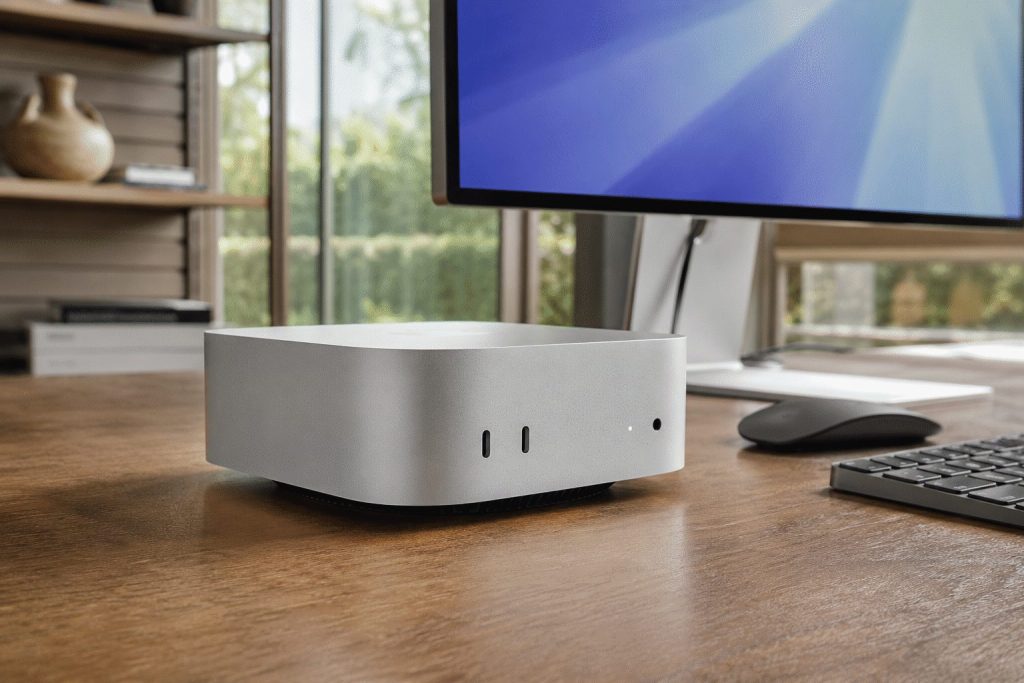
Apple's Mac mini featuring the new M6 comes at a steeper price for its compact desktop line. Apple Inc. stock gained 1.1% to $313.37…
·3 min read
Mac mini with M6 · Apple NASDAQ:AAPL
A 12.5% price test for a record Mac business
Company · Product/commercial catalyst
Market data: August 26, 2026, 11:11:19 EDT Financials: fiscal Q3 ended June 27, 2026
AAPL price
$313.37
+$3.47 · +1.12%
Nasdaq real-time, market open
Mac mini M6
$899
+$100 · +12.5%
U.S. starting price versus predecessor
Mac revenue
$10.4B
+28.7% year over year
Record June quarter
Market value
$4.573T
About $50.6B added at 11:11 EDT
The launch connects pricing to local-AI demand
Consumer entryProfessional AI mix
Mac's financial weight
Mac share of Q3 revenue9.5%
Mac year-over-year growth28.7%
$100 price rise / old $799 base12.5%
One point of quarterly Mac growth≈$104M
Latest company signals
Fiscal Q3 2026
Value
YoY
Revenue
$109.4B
+16%
Net income
$29.8B
+27%
Diluted EPS
$2.02
+29%
Gross margin
50.1%
+3.6 pts
Mac revenue
$10.4B
+28.7%
Gross margin included an approximately two-point tariff-refund benefit.
Investor transmission map
Higher priceA $100 increase supports revenue per unit.
AI performanceM6 targets local models and always-on agents.
Memory costsComponent inflation can absorb pricing gains.
Unit demandA 12.5% entry-price rise can slow volumes.
Stock and valuation
Session range$308.80–$313.45
Volume at 11:06 EDT7.20M
Average volume55.95M
Trailing P/E35.94×
52-week range$225.95–$344.57
Analyst expectations and next checks
S&P Global consensusBuy
Average target$326.34
Target upside at timestamp4.1%
Estimated earningsOctober 29, 2026
Risks
Apple gives no Mac mini unit or revenue forecast. Higher prices may weaken demand. Memory constraints can delay shipments or pressure margins. Product claims are based on Apple's controlled tests.
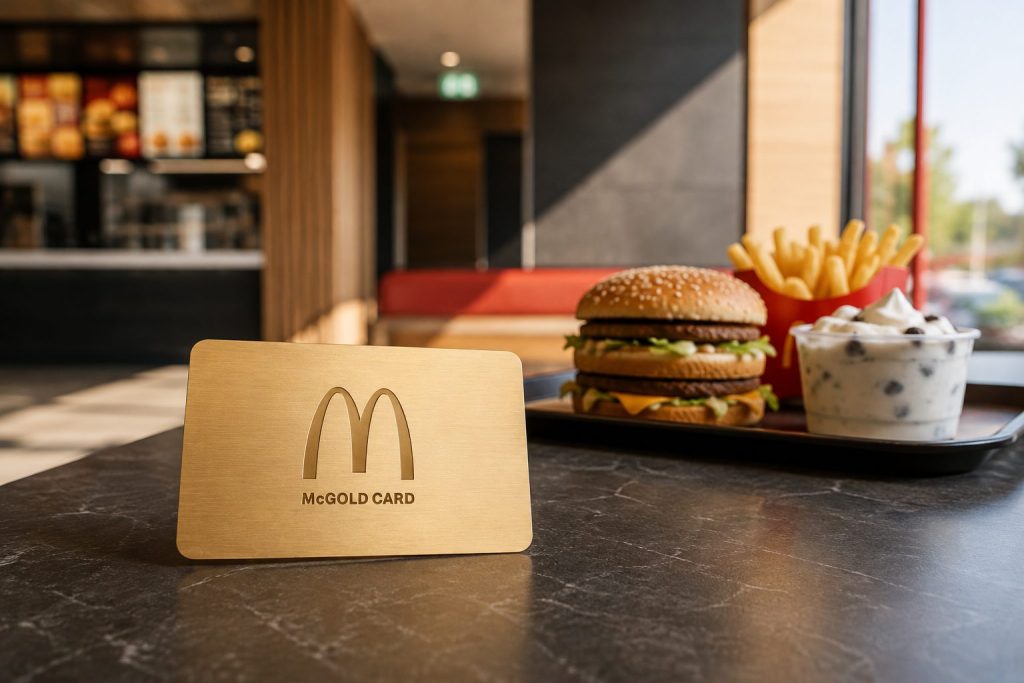
McDonald’s has launched its inaugural Australian McGold Card giveaway as a month-long promotion via app purchases. Eight cards will be given out through MyMacca’s,…
·3 min read
McGold Card: the app funnel behind the prize
McDonald’s Australia promotion and MCD market dashboard
26 Aug 2026 · 10:39 EDT
MCD price
$267.05
−0.39% · −$1.04
Market value
$188.90B
About $736M lost intraday
Promotion value
A$561.6K
Nine lifetime cards
Valuation
21.7×
Trailing P/E · 2.79% yield
Thirty-day app conversion loop
Commercial scale
Loyalty sales
$40B
Systemwide Q2
$37B
Active users
220M
AU restaurants
1,025+
Loyalty sales and users are trailing-year / quarter-end figures reported with Q2 2026 results.
Promotion economics and pricing
Offer / measure
Amount
Commercial purpose
McGold Card
A$62,400 each
A$30 weekly for 40 years
Card pool
9 · A$561,600
Eight app draws; one Bondi event
Big Mac deal
A$3
Low entry price for app transaction
McFlurry deal
A$2.50
High-frequency snack occasion
Quarter Pounder bundle
Under A$6
Value-led meal conversion
Deal cadence
One daily in September
Repeat app opens and purchase entries
Latest financial signals
Q2 global comparable sales
+1.3%
International Operated Markets
+1.5%
Consolidated revenue
+4%
Operating income
+3%
Diluted EPS
$3.32 · +6%
Analyst consensus
Buy · 34 analysts
Average target
$316.06
Implied upside
+18.4%
52-week range
$260.96–$341.75
Current volume
749,620 · 17% of average
What can break the thesis
Discounts may cannibalize full-price app orders.
Australian app users and sales targets are undisclosed.
Franchisees may see traffic without matching profit growth.
The lifetime-card prize is small enough to create attention, not earnings.
Next checkpoints
September daily deal redemption.
Q3 loyalty-member sales and active users.
International Operated Markets comparable sales.
Market data: Google Finance, 26 Aug 2026 at 10:39:59 EDT. Promotion: McDonald’s Australia, 26 Aug 2026. Financials: McDonald’s Q2 2026 release. Analyst consensus: S&P Global data displayed by StockAnalysis, 24 Aug 2026.
BEIJING, August 26, 2026, 10:17 – Shares of Kanzhun jumped 16% following the company's announcement of a $230 million dividend, underscoring strong second-quarter performance.
·3 min read
Kanzhun / BOSS Zhipin investor dashboard
NASDAQ:BZ · regular session · data verified August 26, 2026, 10:17 EDT
Q2 2026 earnings
ADS price
$18.92
+$2.63 · +16.14%
Volume
7.11m
1.83× 3.88m average
Implied value added
≈$1.08bn
410.18m ADS-equivalent shares
Annual dividend
$0.51
2.70% indicated yield
Why the stock is up
Operating leverage met visible cash returns. Revenue grew 14.1%, operating income rose 32.6%, and the margin expanded five points. Investors also received a $230m dividend alongside more than $300m of 2026 buybacks.
RMB scale normalized within each metric; Q2 2026 versus Q2 2025.
Capital-return frame
Cash pool
$2.77bn
Market gain
$1.08bn
Buyback auth.
$400m
Dividend
$230m
Cash pool at June 30; market gain estimated from the $2.63 move and 410.18m ADS-equivalent shares.
Operating scorecard
Metric
Q2 2026
YoY
Revenue
RMB2.40bn
+14.1%
Operating income
RMB863.2m
+32.6%
Operating margin
36.0%
+5.0 pts
Paid enterprise customers
7.2m
+10.8%
Average MAU
70.2m
+10.4%
Operating cash flow
RMB944.8m
−10.2%
Expectations and watchpoints
Q3 revenue guide
RMB2.41–2.50bn
Tracked ratings
3 Buy · 1 Hold
Average target
$20 · +5.7%
High / low targets
$23 / $18
ADS record date
Sep. 28, 2026
Expected ADS payment
around Oct. 14
Risks: cash conversion weakened, World Cup marketing lifted costs, and RMB1.47bn of reported investment gain is not recurring operating profit.
Sources: Kanzhun Q2 2026 release and dividend declaration; Yahoo Finance market data; Google Finance analyst compilation. Market figures timestamped August 26, 2026, 10:17 EDT.
Meta Platforms, Inc. shares gave back most of an early 4.1% jump on Wednesday. The stock traded at $573.05, up 0.5%, at 10:09 a.m.…
·2 min read
Meta Platforms · NASDAQ:META
Settlement relief meets a $10 billion charge
Company · Stock move
Market data: August 26, 2026, 10:09:24 EDT Financials: quarter ended June 30, 2026
Share price
$573.05
+$2.99 · +0.53%
Nasdaq real-time, market open
Intraday path
$561.95–$593.27
Opened $590.44; high was +4.07% versus prior close
Volume
12.33M
66.8% of 18.45M average by 10:09 EDT
Market value
$1.46T
Quoted gain near $7.6B at the timestamp
The market repriced the headline twice
Relief at avoided trial exposureCharge and operating terms absorbed
Charge versus Meta's balance sheet
$10B Q3 charge / Q2 net income63.1%
$10B Q3 charge / cash & securities11.1%
$16.68B maximum / Q2 net income105.3%
$16.68B maximum / cash & securities18.5%
Latest operating signals
Q2 2026
Value
YoY
Revenue
$60.80B
+28%
Net income
$15.85B
-14%
Operating margin
31%
-12 pts
Ad impressions
—
+14%
Average ad price
—
+12%
Daily active people
3.60B
+3%
Investor transmission map
SettlementTrial uncertainty falls; maximum payment becomes measurable.
AccountingAbout $10B hits Q3 legal expense and GAAP earnings.
Product controlsTeen time limits and overnight blocks can reduce engagement.
AdvertisingLower engagement can reach impressions, price and Family of Apps revenue.
Valuation and expectations
TTM P/E21.54×
Forward P/E at $573.0518.4×
2026 consensus EPS$31.16
Average analyst target$754.84
Implied target upside31.7%
Ratings47 strong buy · 8 buy · 7 hold
What to watch next
Q3 revenue guidance$61B–$64B
2026 capex guidance$130B–$145B
Estimated Q3 reportOctober 28, 2026
Risks
Court approval, payment timing and the conditional $5.3B remain unresolved. Meta faces thousands of related cases. Teen protections could affect engagement and advertising economics. The charge may force a revised expense outlook.
The Witcher 3: Wild Hunt — Remastered gives CD Projekt S.A. a low-price acquisition tool for its 2027 paid expansion. The upgrade is free…
·3 min read
WSE: CDR · Product catalyst
The Witcher 3: Wild Hunt — Remastered
A free September upgrade expands the funnel for a paid 2027 expansion.
Market snapshot Aug. 26, 2026 · 15:23:28 CEST
Share price
240.90 zł
−0.82% · −2.00 zł
Range 240.00–246.70 zł
Trading activity
395.85K
1.39× average daily volume
Average: 285.26K shares
Installed base
65M+
Lifetime Witcher 3 copies sold
Analyst case
70–75M
Potential base before 2027 expansion
From free upgrade to paid-content revenue
Sept. 29 Free remaster
→
New reach Switch 2 + Battle.net
→
2027 Paid Songs of the Past
Launch facts
Gamescom reveal and trailer.
Original expansions become free for existing owners.
Remaster launches; new native Switch 2 and Battle.net editions.
Paid Songs of the Past expansion.
Q1 2026 economics
Metric
Value
YoY
Group revenue
191.1M zł
+6%
Witcher IP revenue
44.7M zł
+36%
Witcher share of sales
23.4%
+5.2 pts
Net profit
106.2M zł
−5%
Cash/deposits/bonds
1.41B zł
+6% q/q
Stock and valuation
Signal
Reading
Market cap
24.01B zł
Quoted value lost today
≈199.8M zł
Trailing P/E
39.41×
52-week range
211.30–297.00 zł
Shares outstanding
99.91M
Erste view
Meaningful positive Q4 impact
Investor interpretation
Driver
Upside
Constraint
Free remaster
Reactivates a 65M-player catalogue
No upgrade revenue from existing owners
New platforms
Incremental unit sales and distribution
Platform royalties and launch costs
Paid 2027 expansion
Monetizes a larger installed base
Pricing and release date undisclosed
2028 Witcher 4 target
Extends franchise roadmap
Long flagship-release gap
Risk check
The 70–75 million-copy figure is an analyst estimate. A free update can lift engagement without converting into enough new purchases or expansion sales.
Attention signal
Google Trend: “the witcher 3 wild hunt remastered” · Canada, active at selection; trading volume already above average.
Sources: CD Projekt announcement and Q1 2026 presentation; Reuters, Aug. 26, 2026; Google Finance at 15:23:28 CEST. Time-sensitive figures are timestamped above.
NEW YORK, August 26, 2026, 09:40 – Shares of Boston Scientific fell 4.1% after the company disclosed that a cyberattack may endanger as much…
·3 min read
NYSE: BSX · Cyberattack monitor
Boston Scientific
Order-processing and shipment disruption meets a reduced 2026 growth outlook.
Market snapshot Aug. 26, 2026 · 09:40:21 EDT
Share price
$47.81
−4.11% · −$2.05
Open $47.00 · range $46.90–$48.53
Quoted value lost
$2.97B
Estimated from 1.45B shares outstanding
Q3 revenue guide
$5.22–$5.32B
3%–5% growth vs. Q3 2025
Revenue risk scenario
$316–$369M
Evercore: 600–700 bp if recovery mirrors Stryker
Market repricing versus modeled sales exposure
The stock-market loss equals roughly 8.0×–9.4× the analyst's modeled revenue exposure.
Market valueLow scenarioHigh scenario
What moved the stock
Company detects a cybersecurity incident.
Discloses global disruption, including systems that process and ship orders.
Shares open at $47.00, 5.74% below prior close.
BSX trades at $47.81, down 4.11%.
Operating base
Metric
Q2 2026
YoY
Total sales
$5.442B
+7.5%
Cardiovascular
$3.624B
+8.3%
MedSurg
$1.818B
+5.9%
Adjusted EPS
$0.86
+14.7%
GAAP net income
$907M
+13.8%
Guidance and valuation
Signal
Current reading
FY26 sales growth
5.5%–6.5% reported
FY26 adjusted EPS
$3.28–$3.32
Q3 adjusted EPS
$0.80–$0.82
P/E
19.38×
Analyst consensus
Buy · 31 analysts
Average target
$62.69 · 31% upside
Scenario frame
Recovery path
Revenue effect
Investor implication
Faster than Stryker
Below $316M
More orders may shift within the quarter rather than disappear.
About three weeks
$316M–$369M
Evercore's 600–700 bp scenario; a guide cut becomes plausible.
Longer or broader
Above $369M
Margin pressure and customer disruption could outlast shipment delays.
Risk check
Boston Scientific has not determined whether the incident is reasonably likely to be material. The full scope, recovery duration and any data loss remain unknown.
Watch next: recovery timetable, shipment resumption, order recapture, guidance update.
Sources: Boston Scientific Q2 2026 results; Reuters, Aug. 26, 2026; Google Finance quote at 09:40:21 EDT; StockAnalysis analyst consensus. The $316M–$369M range is a scenario calculation, not company guidance.
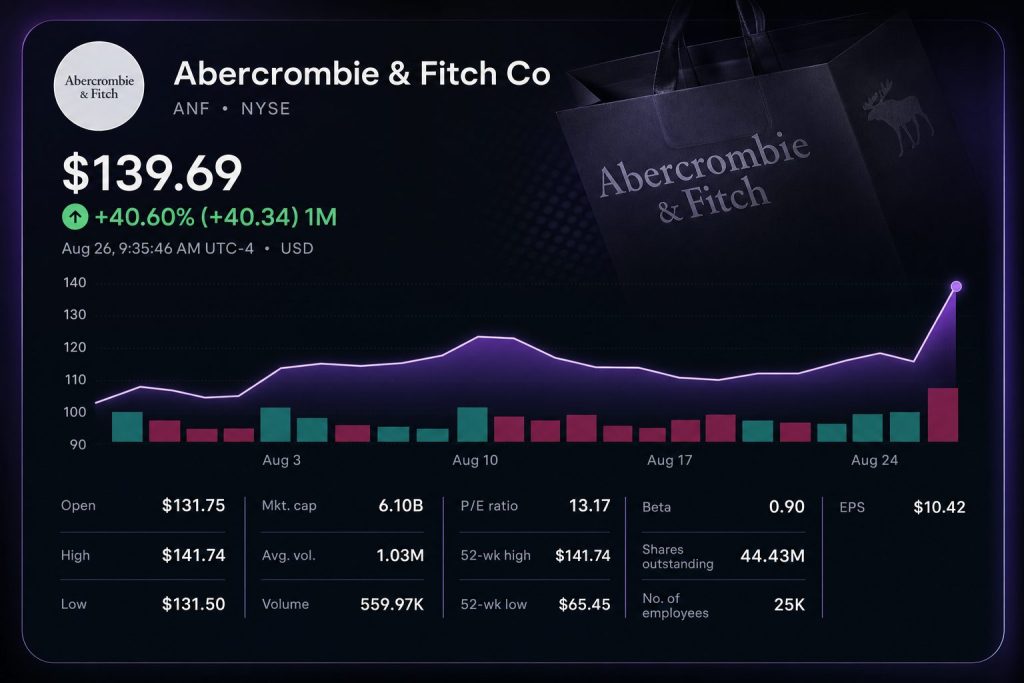
A $100M tariff refund added $1.75 to Q2 EPS and 790 basis points to margin. Remove it and estimated EPS is still $2.42—21.6% above the $1.99 consensus—while operating margin is about 12.0%, roughly two points above the prior outlook.
Q2 net sales
$1.267B
+4.8% year over year
15th consecutive growth quarter
Q2 diluted EPS
$4.17
$2.42 estimated ex-refund
$1.99 FactSet consensus
Q2 operating margin
19.9%
≈12.0% ex-refund
Prior outlook: around 10%
FY2026 buybacks
≥$500M
+11.1% vs. prior plan
$282M completed year to date
Q2 margin bridge
The ex-refund figure is a simple subtraction of the company's disclosed 790-basis-point benefit from reported margin.
Sales growth by brand / region
Abercrombie
+8%
Hollister
+2%
Americas
+5%
EMEA
+2%
APAC
+19%
Comparable sales: total 0%, Abercrombie +4%, Hollister −3%, EMEA −4%.
Guidance reset
Metric
Current
Prior
Midpoint change
FY sales growth
About 5%
3%–5%
+1 point
FY operating margin
14.5%–15.0%
12.0%–12.5%
+250 bps
FY EPS
$13.10–$13.60
$10.20–$11.00
+25.9%
FY share repurchases
At least $500M
About $450M
≥+$50M
Q3 EPS
$2.90–$3.20
$2.82 consensus
+8.2% at midpoint
Capital and liquidity
$313M YTD operating cash flow
$628M cash
$450M ABL availability
$282M YTD buybacks
Cash was $760M at Jan. 31. Inventory was nearly flat year over year at $592M.
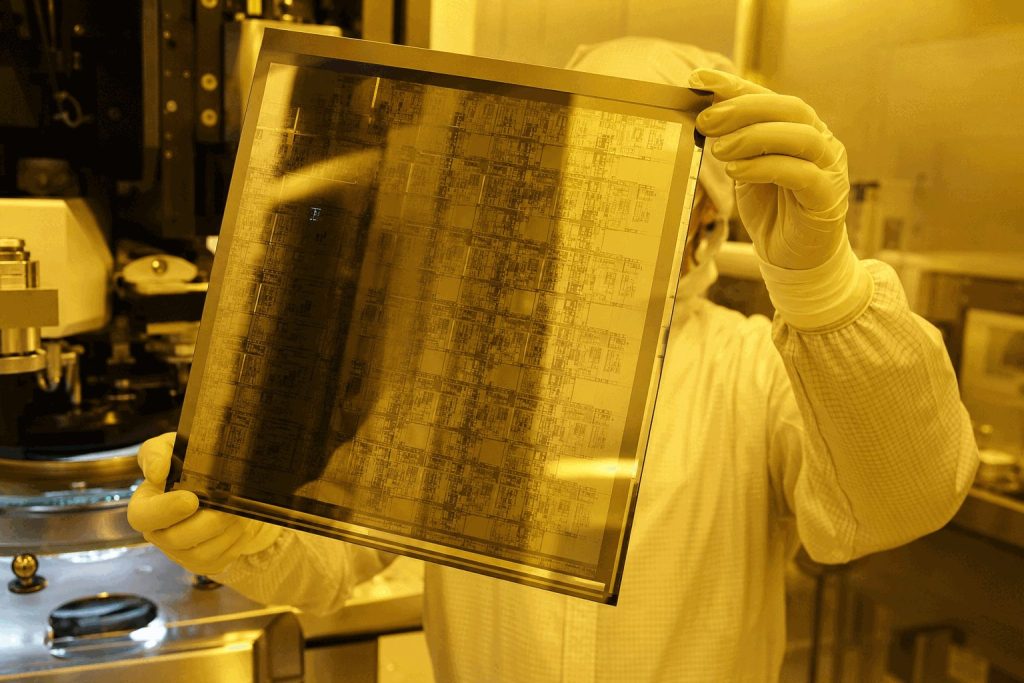
BROOKFIELD, Connecticut, August 26, 2026, 09:20 - Photronics stock rose 23% in premarket trading after the company reported that high-end IC mask mix soared…
·3 min read
Photronics investor dashboard
NASDAQ:PLAB · Premarket snapshot: August 26, 2026, 09:18 EDT
Q3 FY2026 · earnings released
Premarket price
$36.12
+$6.80 · +23.19%
Implied value added
$400.9m
58.96m shares outstanding
Revenue / estimate
$216.0m
+3.5% beat
Adjusted EPS / estimate
$0.50
+24.0% beat
Quarterly revenue mix
IC photomasksFPD photomasksUSD millions
Why the market is paying attention
High-end IC mix reached a record 44% of IC revenue. That implies about $68.1m of quarterly high-end IC sales, or 31.5% of company revenue.
The $400.9m premarket value gain equals 5.9 times this estimated quarterly revenue stream. It prices a richer mix, not just a modest top-line beat.
Margin confirmation matters: Q3 gross margin recovered to 33.2%, but remained below the 33.7% level one year earlier.
Operating scorecard
Metric
Q3 FY26
Q2 FY26
Q3 FY25
Signal
Revenue
$216.0m
$209.9m
$210.4m
Improving
IC revenue
$154.7m
$147.5m
$147.8m
+5% both ways
FPD revenue
$61.4m
$62.4m
$62.6m
-2% both ways
Adjusted EPS
$0.50
$0.42
$0.51
Sequential rebound
Gross margin
33.2%
31.3%
33.7%
+190 bp q/q
Operating margin
21.1%
20.1%
22.9%
Below year ago
Q4 FY2026 guide versus consensus
Revenue
$207m–$227m
Midpoint $217m vs. $215.7m consensus
Adjusted EPS
$0.40–$0.56
Midpoint $0.48 vs. $0.42 consensus
Operating-margin guidance: 19%–24%; midpoint 21.5% versus Q3’s 21.1%.
Liquidity and valuation
Implied premarket market cap
$2.13bn
Cash + short-term investments
$672.8m
JV-associated portion
$503.5m
Q3 operating cash flow
$76.3m
Q3 capex
$37.0m
Analyst average target
$46.00
The $46 target implies about 27% upside from $36.12. Three tracked analysts rate the shares Buy; coverage is limited.
Catalysts and risks
What can extend the move
Volume confirms the premarket revaluation.
High-end IC mix stays near the 44% record.
Q4 revenue and margin land above their midpoints.
U.S. and Korea capacity investments remain on schedule.
What can break the thesis
Premarket liquidity exaggerates the opening move.
FPD weakness spreads into another quarter.
Customer design releases slip again.
Joint-venture cash is less accessible than headline liquidity suggests.
Shares of Woolworths Group Limited climbed 3.42% on Wednesday. The retailer reported that Disney Ooshies contributed as many as two percentage points to early…
·3 min read
ASX:WOW · FY2026 result
Woolworths reprices the recovery after a promotion-led sales lift
Market closedAugust 26, 2026 · 16:00 AEST
Share move
A$40.18+3.42% +A$1.33
Estimated market value: A$49.0bn · Estimated value added: A$1.62bn
Low A$39.90Close A$40.18High A$41.19
Volume: 4.50m shares. Value calculations use approximately 1.22bn shares outstanding.
Why investors paid attention
Ooshies supplied 1.5–2.0 points of Woolworths’ 7.6% early FY2027 Australian Food sales growth.
That equals 19.7%–26.3% of the reported growth rate. The campaign ended August 25, making sales retention the next test.
FY2026 EBIT increaseabout A$351m
One-day equity-value gain / EBIT increaseabout 4.6×
Australian Food margin5.5% vs 5.3%
FY2026 financial signals
Group salesA$71.539bn+3.6%
EBIT before significant itemsA$3.105bn+12.7%
Underlying NPATA$1.599bn+15.4%
Australian Food salesA$53.852bn+4.6%
E-commerce salesA$10.596bn+15.9%
Full-year dividendA$0.97+15.5%
Growth mix and peer check
WOWOoshies contributionColes
Analyst expectations
Average targetA$37.047.8% below close
3 Buy7 Hold5 Sell
Target range: A$31.50–A$40.90. The high target is only 1.8% above the close.
Risks
Promotion roll-offOoshies ended Aug. 25
Price investment1,035 Lower Shelf Price products
Average reduction16.4%
Cost pressureWages can absorb margin gains
What changes the thesis
PositiveFood growth holds above Coles after Ooshies
CARLSBAD, California, August 26, 2026, 05:45 – Callaway Golf stock declined 2% on Wednesday following market reaction to ad pull testing related to its…
·3 min read
Callaway Golf Company · NYSE:CALY
Quantum campaign fallout
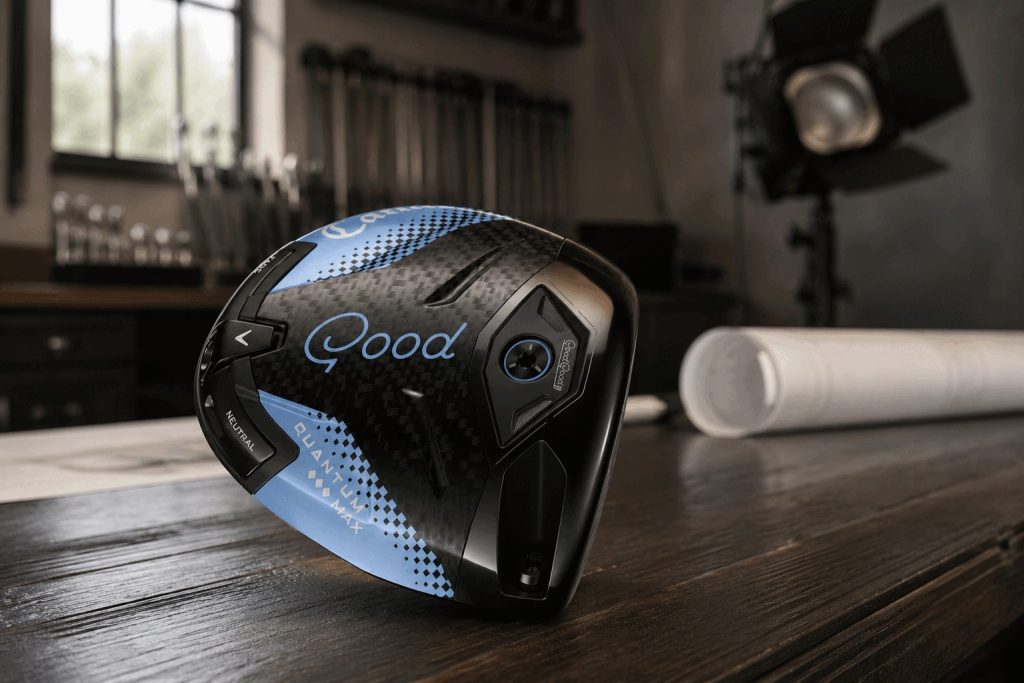
A compact view of the stock reaction, the $699.99 co-branded driver, and the equipment segment carrying most of Callaway's quarterly revenue.
Investor bridge: market loss versus equipment economics
Product and catalyst
Limited driver
$699.99
Good Good Quantum Triple Diamond Max, 460cc head, adjustable 10g weight.
Ad withdrawnCEO apologyTwo investigationsApproval changes
Golf Equipment — Q2 2026
Metric
Result
Revenue
$430.3M · +4.5%
Operating income
$100.3M · +31.6%
Operating margin
23.3% · +480 bp
Share of group sales
70.3%
Group signals
Metric
Result
Q2 sales
$612.2M · +2.0%
GAAP gross margin
50.1% · +620 bp
FY26 sales guide
$2.045B–$2.070B
FY26 adjusted EBITDA
$246M–$260M
Analyst expectations
Consensus
Buy
Average target
$20.50
Implied upside from $15.47
32.5%
Coverage
11 analysts
Rating mix
5 Strong Buy · 5 Hold · 1 Sell
S&P Global consensus, accessed Aug. 26, 2026.
Catalyst timeline
Aug. 21Good Good posts the co-branded driver video; it is removed within hours.
Aug. 22Good Good and Callaway issue preliminary responses.
Aug. 25Chip Brewer accepts Callaway's approval role and announces internal and external reviews.
Next evidenceProduct availability, partner actions and Callaway's next sales update.
What can change the thesis
Contained case: investigations close without retailer, media or partner withdrawals; the 0.58% premarket rebound persists. Adverse case: partner action raises campaign costs or weakens demand in a segment producing 70.3% of quarterly sales. Watch the product listing, PGA Tour decisions and management's next equipment-sales commentary.
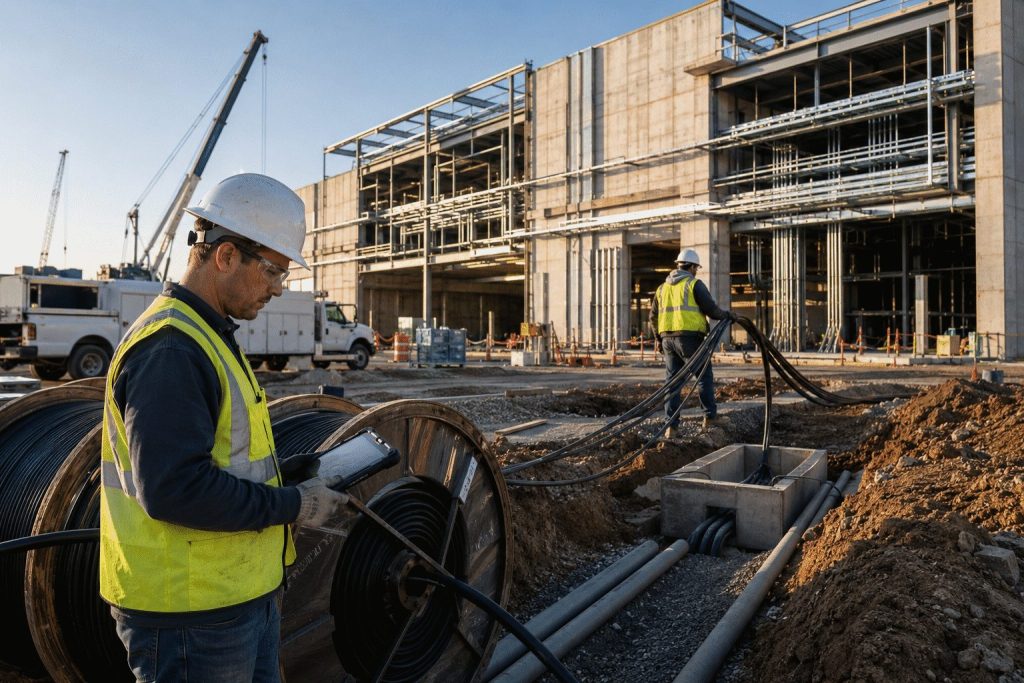
WEST PALM BEACH, Florida, August 26, 2026, 08:20 - Dycom’s share price dropped 7.7% just ahead of its record second quarter, with the company’s…
·3 min read
NYSE: DY · Company · Stock move · Earnings
Building Systems changes Dycom’s profit mix
Record revenue matters. The sharper signal is a 24.5% Building Systems margin and a backlog larger than the company’s market value.
Data cut August 26, 2026, 08:20 EDT Prices through Aug. 25 close/after-hours
Latest close
$351.80
−7.65% · Aug. 25, 16:00 EDT
Q2 revenue
$2.006B
+45.6% year over year
Adjusted EBITDA
$315.5M
15.7% margin · +81 bps
Total backlog
$12.242B
+53.2% year over year
Backlog is compounding faster than the share price
Backlog exceeded the Aug. 25 market value by about $1.68 billion. That is demand visibility, not booked profit; execution timing still controls cash conversion.
Segment economics
Share of Q2 revenue
Communications
80.2%
Building Systems
19.8%
Share of adjusted EBITDA
Communications
69.2%
Building Systems
30.8%
Building Systems’ 24.5% margin was 10.9 points above Communications.
Quarterly comparison
Metric
Q2 FY27
Q2 FY26
Δ
Revenue
$2.006B
$1.378B
+45.6%
Adj. EBITDA
$315.5M
$205.5M
+53.5%
Adj. EPS
$5.29
$3.64
+45.3%
EBITDA margin
15.7%
14.9%
+81 bps
Backlog
$12.242B
$7.989B
+53.2%
Guidance: raised, but only modestly
Prior FY27 revenue
$7.38B–$7.65B
Midpoint: $7.515B
Updated FY27 revenue
$7.48B–$7.66B
Midpoint: $7.570B
The midpoint rose only $55 million, or 0.7%. Roughly $150 million of wireless work shifted into fiscal 2028.
Valuation and analyst frame
Signal
Reading
Investor interpretation
Market value
$10.56B
Below $12.24B backlog
Trailing P/E
33.6×
Requires sustained execution
Forward P/E
21.2×
Prices meaningful profit growth
Consensus
Strong Buy · 11 analysts
Average target $637.27
Target upside
81.2%
Versus Aug. 25 close
Latest rating: KeyBanc maintained Overweight and raised its target to $610 on June 1, 2026.
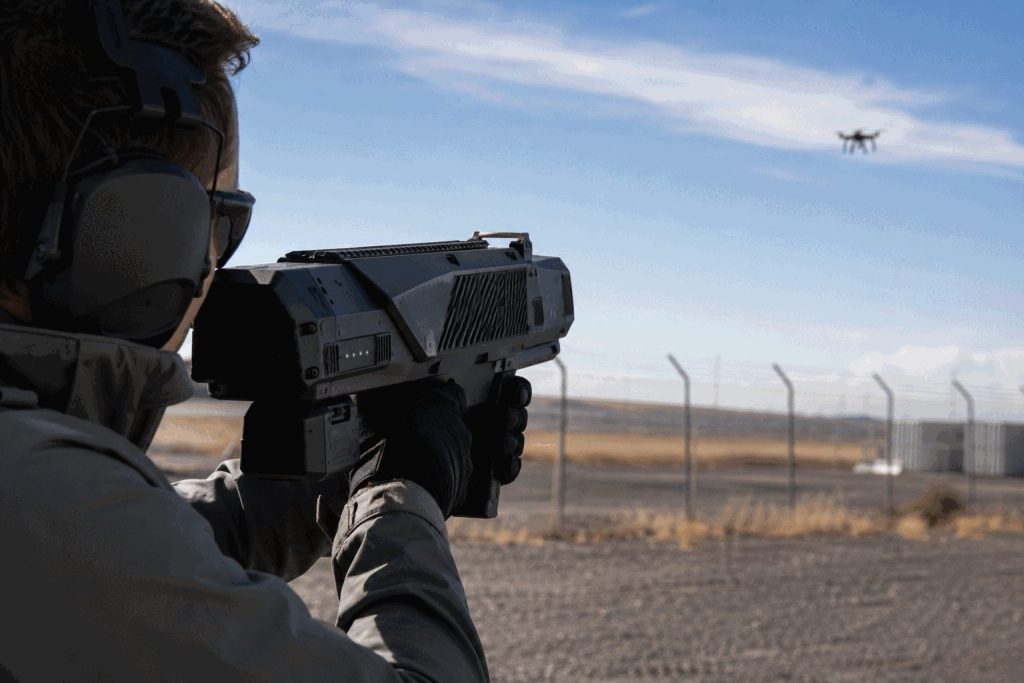
Shares in DroneShield Limited dropped 9.4% on Wednesday, finishing at A$1.768 as higher first-half costs offset its record sales.
·3 min read
ASX:DRO · Company · Stock move
Sales landed. Profit did not.
Market data: 26 Aug 2026, 16:12 AEST Results: six months ended 30 Jun 2026
CloseA$1.768−9.4% · A$0.182
Quoted value erasedA$168m924.09m shares × A$0.182
1H revenueA$125.8m+74% · met consensus
Statutory lossA$32.2mA$6.6m profit expected
Half-year scorecard
A$ million
1H25
1H26
Change
Revenue
72.3
125.8
+74%
Recurring revenue
3.5
11.5
+229%
Gross margin
65.3%
60.0%
−5.3 pts
Underlying EBITDA
8.0
−12.4
−20.4
Statutory NPAT
2.1
−32.2
−34.3
Revenue growth+74%
Margin erosion−5.3 pts
The guide is mostly covered
Cash: A$180m at 30 Jun; no debt.
Remaining sales: A$10m–A$30m.
Core test: restore EBITDA and gross margin.
Market reaction: four times the earnings miss
Analyst expectations
A$2.70
Pre-results average target from five analysts. Consensus: Buy, but the split is wide at three Buy and two Sell ratings.
High A$5.00Low A$1.60Canaccord A$2.804 Aug snapshot
Signals to watch
Gross margin recovery, second-half EBITDA, delivery timing and recurring revenue. Governance remains material while ASIC examines historical disclosures and trading.
15.7% short interestInventoryProduct mixASIC
Sources: DroneShield first-half 2026 results and investor relations; Visible Alpha consensus via Capital Brief; market and analyst data from Investing.com and S&P Global. Market figures timestamped 26 Aug 2026, 16:12 AEST. Calculations are estimates using reported shares outstanding.
ASUS launched U.S. preorders for the ROG Xbox Ally X20 at $1,299. Shares of ASUSTeK Computer Inc., the parent company, gained 4.97% to NT$971…
·3 min read
Product / Commercial Catalyst
ROG Xbox Ally X20 investor dashboard
Market data: Aug. 26, 2026, 13:30 CST Product data: Aug. 25, 2026
ASUSTeK close
NT$971
▲ 4.97% · +NT$46
Value added
NT$34.2B
Estimated from 742.76M shares outstanding.
X20 price
$1,299
30% above Ally X
Analyst view
Buy
13 analysts · NT$1,018 average target · 4.85% upside.
Premium ladder — U.S. list price
ROG Xbox Ally
$600
ROG Xbox Ally X
$1,000
ROG Xbox Ally X20
$1,299
X20 bundle
$2,499
The standalone X20 is 116.7% above ASUS's entry handheld. The bundle is 92.4% above the standalone X20.
Share move versus operating scale
The market-value gain was 1.74× quarterly operating profit. This is scale context, not proof that the launch caused the stock move.
Hardware and financial signals
Signal
Latest
Change / context
Investor read-through
Q2 brand revenue
NT$241.1B
+39% YoY
Premium products support growth
Q2 operating profit
NT$19.6B
+230% YoY
Strong operating leverage
Gross margin
16.5%
+4.1 pts YoY
Mix is financially material
High-value mix
>65%
Q2 revenue share
X20 fits stated strategy
X20 display
7.4-inch OLED
1080p · 120Hz
Supports 30% price premium
Processor
Ryzen AI Z2 Extreme
8 cores · 50 TOPS NPU
Matches prior Ally X silicon class
Catalyst path
Aug. 25 · Preorders opened$1,299 standalone; $2,499 bundle
Aug. 26 · Taiwan close2357 gained 4.97% to NT$971
Oct. 15 · On-shelf dateFirst delivery and channel checks
What could break the thesis
ASUS disclosed no preorder count, production target or product margin. A limited edition can lift average selling price without moving total revenue. Component inflation, premium-handheld competition and weak conversion after October 15 are the key measurable risks.
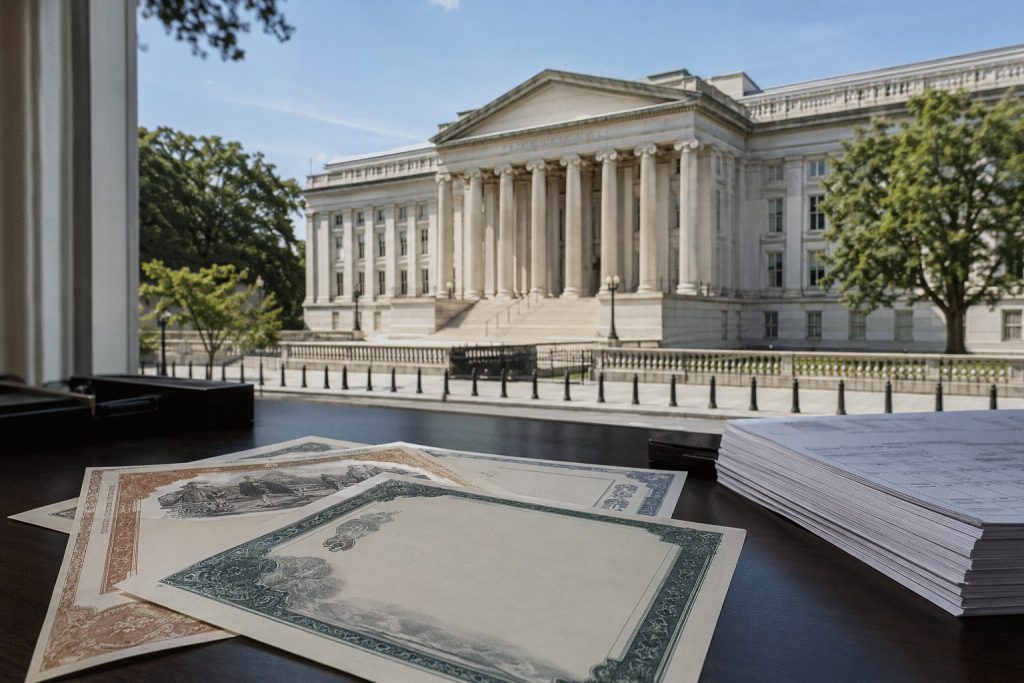
Market snapshot: August 26, 2026, 07:35 EDT 13:35 CEST • Pre-PCE • Cash market open
10-year yield
4.643%
+0.6 bp early Wednesday
30-year yield
5.181%
+0.8 bp early Wednesday
10s30s slope
+53.8 bp
Long-end term premium remains high
Buyback cap
≥$4B
At least 100% higher from September 9
10-year yield: the buyback rally did not break the range
4.74%4.69%4.64%
Aug 11Aug 19Aug 25Aug 26
Buyback plan4.638%4.643%
10-year yieldClose data through Aug. 25; Aug. 26 is 07:20 EDT
Latest curve
2-year
4.24%5-year
4.41%10-year
4.643%20-year
5.21%30-year
5.181%
2-, 5- and 20-year: August 25 close. 10- and 30-year: August 26, 07:20 EDT.
The curve is upward-sloping beyond two years. Investors still demand extra compensation for duration, inflation and fiscal uncertainty.
Catalyst timeline
Aug 19
Treasury doubles long-end liquidity-support buyback caps to at least $4 billion.
Aug 25
10-year yield falls 6.5 bp; 30-year drops 5.6 bp as oil retreats.
Aug 26
08:30 EDT: July PCE inflation and second-estimate Q2 GDP.
Sep 9
Larger 10-to-30-year buyback operations begin.
Nov 4
Treasury reviews future sizes at the next quarterly refunding.
Inflation test
Measure
June
July consensus
Headline PCE, y/y
3.7%
3.6%
Core PCE, y/y
3.3%
3.3%
Federal Reserve goal
2.0%
Core inflation sits well above target. Marker shows 3.3% on a 2%–3.8% scale.
Buybacks can improve liquidity. They do not remove the inflation premium embedded in long-maturity yields.
Illustrative 10-year reaction map
July core PCE outcome
Possible first move
Bias
≤3.1%
-5 to -10 bp
Duration bid
3.2%–3.4%
-3 to +3 bp
Range
≥3.5%
+7 to +15 bp
Selloff risk
Scenario ranges are analytical estimates, not forecasts. Oil and GDP revisions can amplify or offset the first reaction.
Investor transmission
Channel
Current signal
Exposure
Mortgages
30-year fixed near 6.75%
Housing demand, banks
Corporate credit
4.64% risk-free anchor
Refinancing cost
Equities
High discount rate
Long-duration growth
Pensions
5.18% long bond
Liability values
Mortgage estimate dated August 25, 2026. Treasury yields dated August 26, 07:20 EDT.
What the buyback can—and cannot—do
Can
Retire harder-to-trade off-the-run bonds, support dealer liquidity and reduce local pricing gaps in the 10-to-30-year sectors.
Cannot
Fix the primary deficit, guarantee lower yields or neutralize an upside inflation surprise. Treasury explicitly frames the program as liquidity support.