
NEW YORK, August 3, 2026, 07:06 EDT – Roblox Corp NYSE:RBLX shares hovered near their 52-week low, with diverging trends in payer activity and increased outlays on safety advancements.
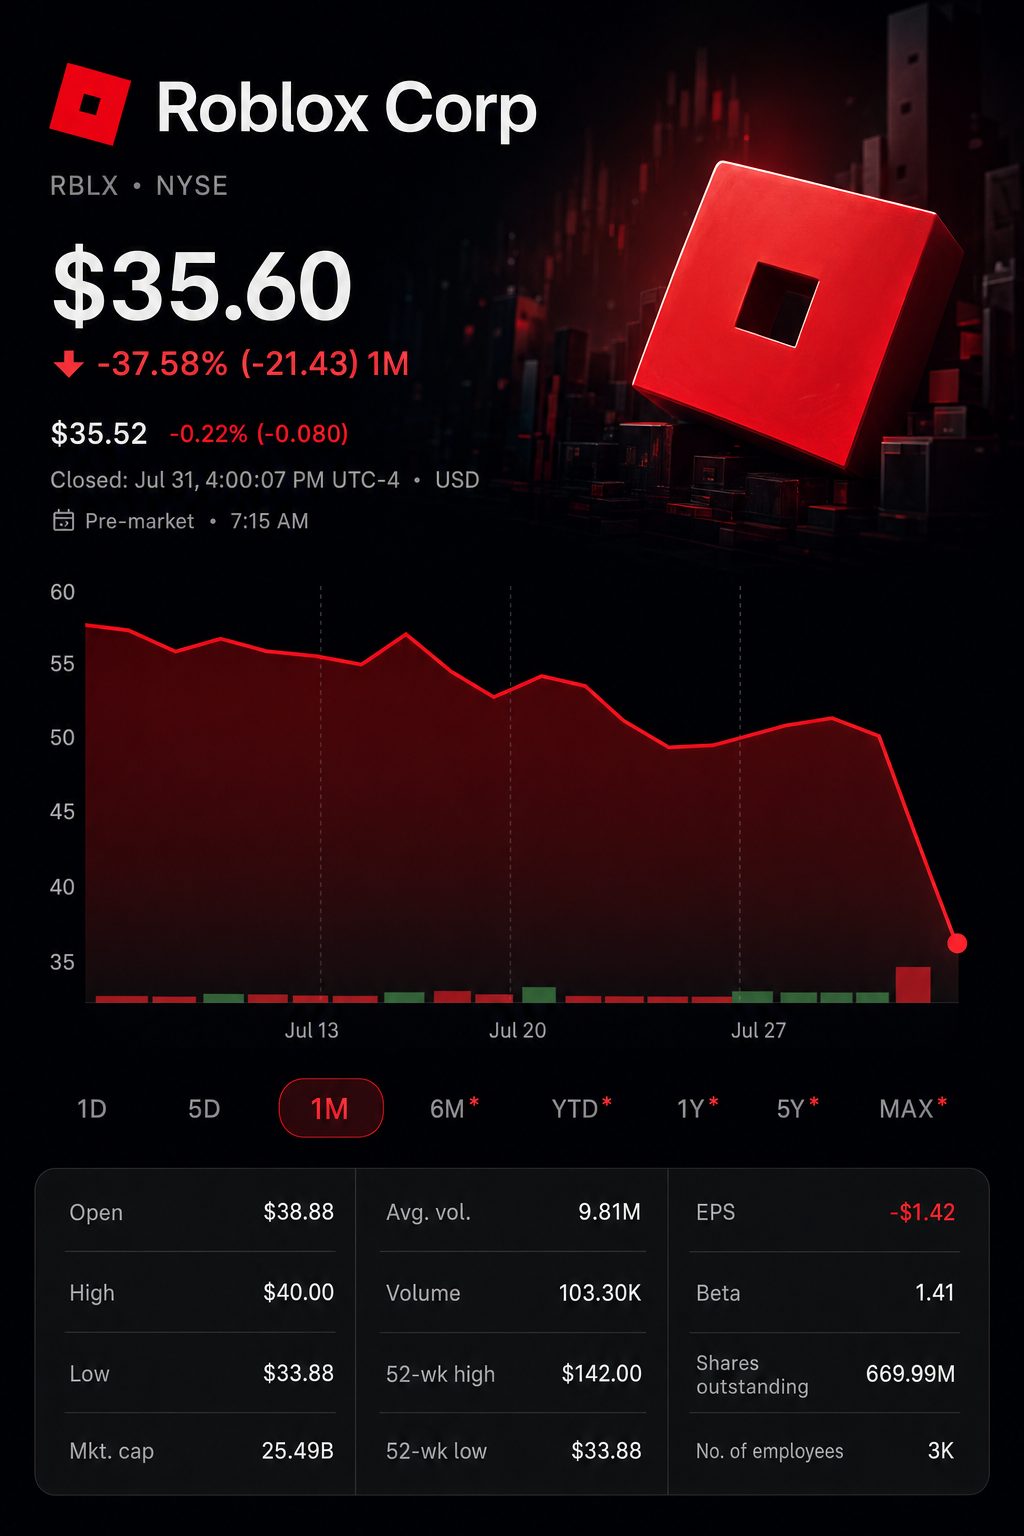
- Roblox traded at $35.50 in premarket action after falling a record 26.85% on Friday.
- Monthly payers increased by 15% in Q2, but average bookings per payer declined by 6%.
- Estimated midpoint for Q3 free cash flow stands at negative $27.5 million.
Roblox stock traded close to its 52-week low ahead of Monday’s session, as increased safety expenses coincided with reduced spending from payers. Friday marked the steepest single-day drop for the shares on record.
Traffic continued to increase. The number of monthly payers in Q2 climbed 15%, though bookings per payer declined by 6%. Spending on some infrastructure and trust and safety surged 54%.
The valuation equation shifts due to that gap. Roblox needs to show that improved user retention can compensate for decreased per-hour spending. This comes as it continues to invest in AI and safety.
The five-day decline did not extend to its nearest listed rivals, indicating a reset specific to the company instead of a wider shock to the gaming sector.
| Company | Friday close | Monday premarket | Five-day | 2026 YTD |
|---|---|---|---|---|
| Roblox Corporation NYSE:RBLX | $35.60 | $35.50 (-0.3%) | -26.5% | -56.1% |
| Unity Software Inc. NYSE:U | $31.71 | $32.35 (+2.0%) | +4.2% | -28.2% |
| Take-Two Interactive Software, Inc. NASDAQ:TTWO | $242.92 | $246.16 (+1.3%) | -0.4% | -5.1% |
Premarket values were captured from 06:51 to 07:00 EDT. Data covers performance up to Friday’s closing bell.
Traffic itself was not the main issue. The number of daily users rose by 10%, and monthly paying users climbed 15%. However, total hours went up just 5%, while bookings per active user declined 2%.
| Operating measure | Q2 2025 | Q2 2026 | Change |
|---|---|---|---|
| Daily active users | 112 million | 123 million | +10% |
| Total hours engaged | 27 billion | 29 billion | +5% |
| Monthly unique payers | 23.4 million | 27.0 million | +15% |
| Bookings | $1.438 billion | $1.557 billion | +8% |
| Bookings per monthly payer | $20.48 | $19.25 | -6% |
| Bookings per daily active user | $12.86 | $12.66 | -2% |
Company data; numbers are approximate.
Roblox’s top-spending market was the main area of softness. Bookings in the United States and Canada rose just 1%. Bookings per active user in this region slipped 5% to $38.63.
Weakness in international markets moderated the overall downturn. Bookings per active user in Europe climbed 16%. In other regions, the figure gained 14% but stayed well under North America’s level.
Older users provided the most evident counterbalance. Adults made up 27% of daily users who passed age verification. In the U.S., adults generated over 50% higher monetization compared to minors, and the number of adult users increased by 32%.
The price of that opportunity is high. Roblox allocated $236 million to specific infrastructure and trust-and-safety measures. These expenses accounted for 15% of bookings, up from 11% a year earlier.
| Cost item | Q2 2025 | Q2 2026 | Growth | Share of bookings |
|---|---|---|---|---|
| Certain infrastructure and trust-and-safety costs* | $153 million | $236 million | +54% | 11% → 15% |
| Developer exchange payouts | $316 million | $363 million | +15% | 22% → 23% |
| Wages and salaries, excluding stock-based pay | $245 million | $283 million | +16% | 17% → 18% |
The infrastructure metric set by the company does not include staff, share-based payments, or depreciation and amortisation.
Management prioritized retention rather than immediate spending. The recommendation platform favored games with higher retention rates, even those generating less revenue. CFO Naveen Chopra stated, “Monetization weakness is likely to continue.” Q4 Stock Data
The third-quarter outlook shifts that trade-off into financial strain. Bookings are projected to drop 16.0% year on year at the midpoint. Free cash flow goes into the red.
| Measure | Q3 2025 actual | Q3 2026 guidance | Derived midpoint | Midpoint change |
|---|---|---|---|---|
| Revenue | $1.360 billion | $1.413–$1.490 billion | $1.452 billion | +6.7% |
| Bookings | $1.922 billion | $1.576–$1.653 billion | $1.615 billion | -16.0% |
| Adjusted EBITDA | $46 million | $0–$41 million | $20.5 million | -55.4% |
| Free cash flow | $443 million | -$60 million–$5 million | -$27.5 million | Shifts to negative |
Midpoints and percent change figures are calculated estimates reflecting company guidance.
The midpoint for bookings is 8.8% under the $1.77 billion consensus forecast. Guidance for capital expenditures and intangible purchases is set at $170 million, compared with $24 million in Q2. This results in a sequential swing in derived free-cash-flow of $321.5 million.
Analysts acted quickly. Mike Hickey at Benchmark and Clark Lampen at BTIG lowered their ratings on Roblox to Sell. Hickey set a price target of $33, while Lampen’s was $30.
The balance sheet provides some backing. Cash and investments reached $6.1 billion at the end of the quarter. Roblox bought back $380 million in shares from a $3 billion buyback program.
On Monday morning, Roblox’s investor page showed the July 30 call as its most recent event. The initial market test is Friday’s low at $33.88. Changes to estimates and share repurchases could influence the coming week.
Risks: Retention may recover more quickly than anticipated. Increases in adult user growth or more aggressive share buybacks could drive shares higher. Ongoing challenges in monetizing younger users, higher safety-related expenses, or weaker demand for games would increase pressure to the downside.
Related articles: NYSE:RBLX