Close
$216.62
−10.28% · ≈$22B erased
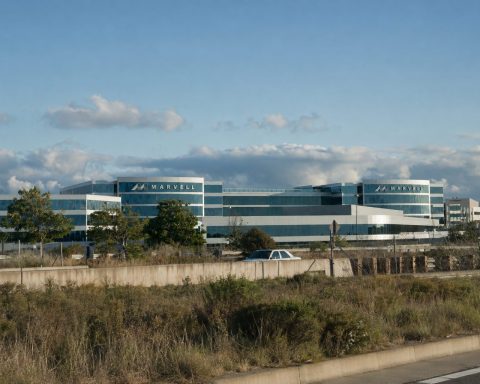
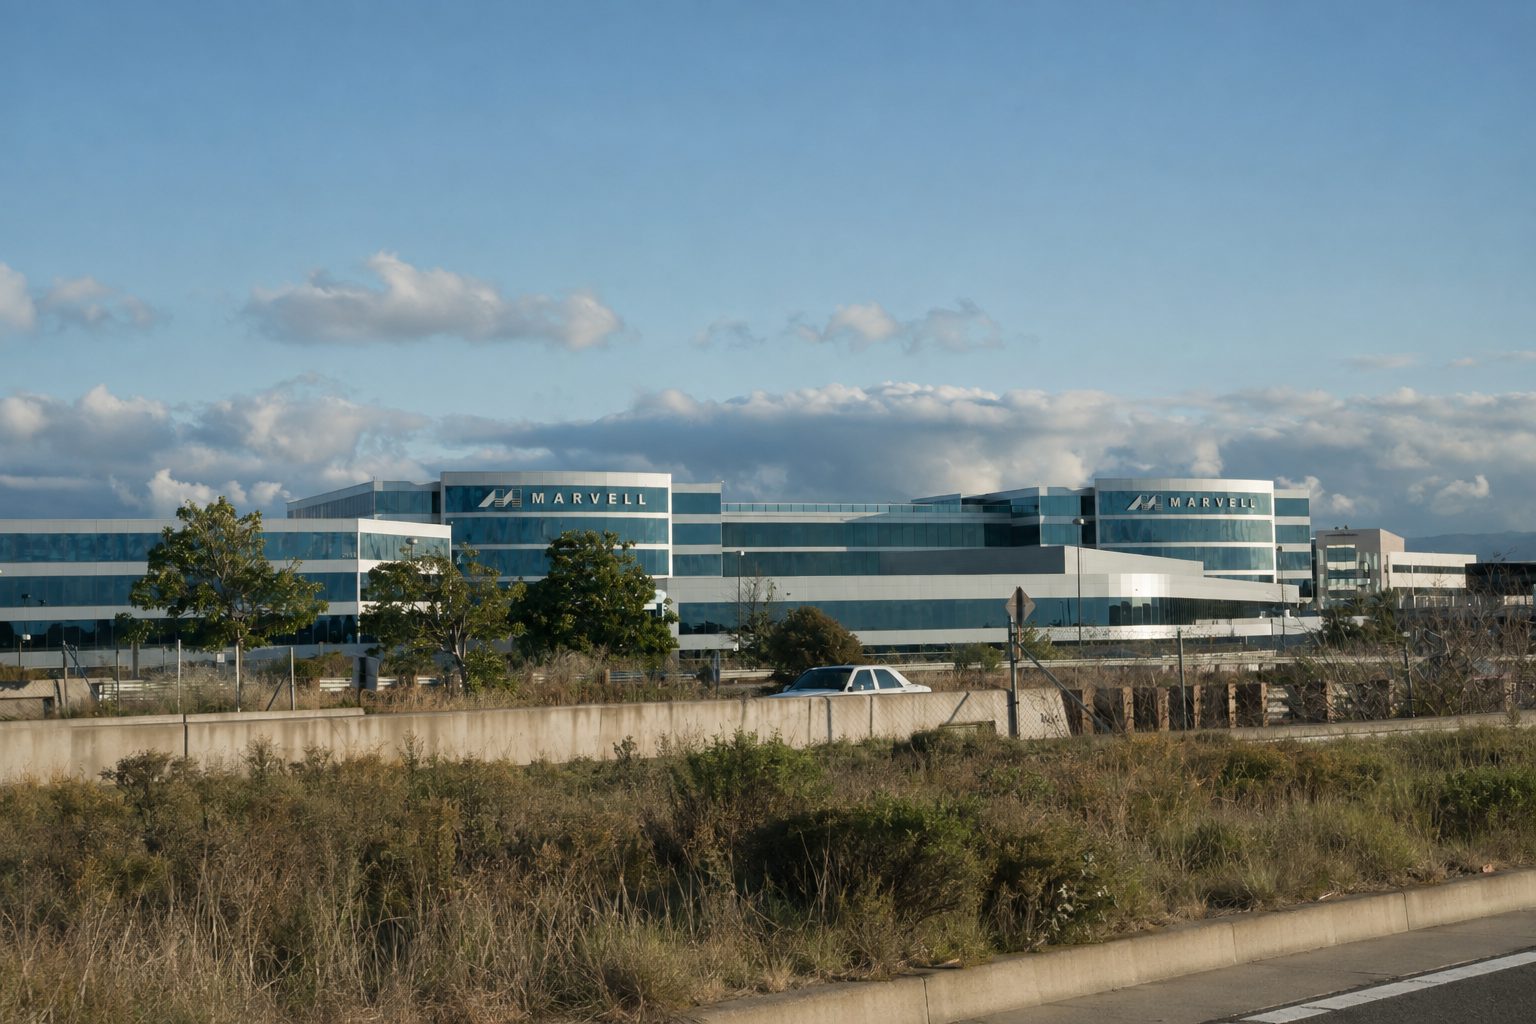
Marvell Technology fell 10.3% on Friday, wiping out approximately $22 billion in market value, after reporting its highest ever quarterly revenue.
| Measure | Q2 | Q3 guide |
|---|---|---|
| Revenue | $2.739B | $3.150B ±5% |
| Non-GAAP GM | 58.9% | 58.0% midpoint |
| Non-GAAP EPS | $0.94 | $1.10 ±$0.05 |
The growth guide is strong. The 90-basis-point gross-margin step-down and Google revenue timing pushed attention toward execution.
| Metric | MRVL | Reference |
|---|---|---|
| Forward P/E | 58.4× | Broadcom 32.2× |
| Median target | $295 | +36.2% vs close |
| Ratings | 37 Buy/OW | 6 Hold · 0 Sell |
| FY28 revenue target | $18B | 6.6× Q2 run-rate quarter |
| Cash | $3.933B |
| Quarterly operating cash flow | $605.5M |
| Stock-based compensation | $326.2M |
| Q2 GAAP net income | $308.0M |
Google-linked revenue becomes more meaningful in fiscal 2029. Investor Day: Oct. 6, 2026.
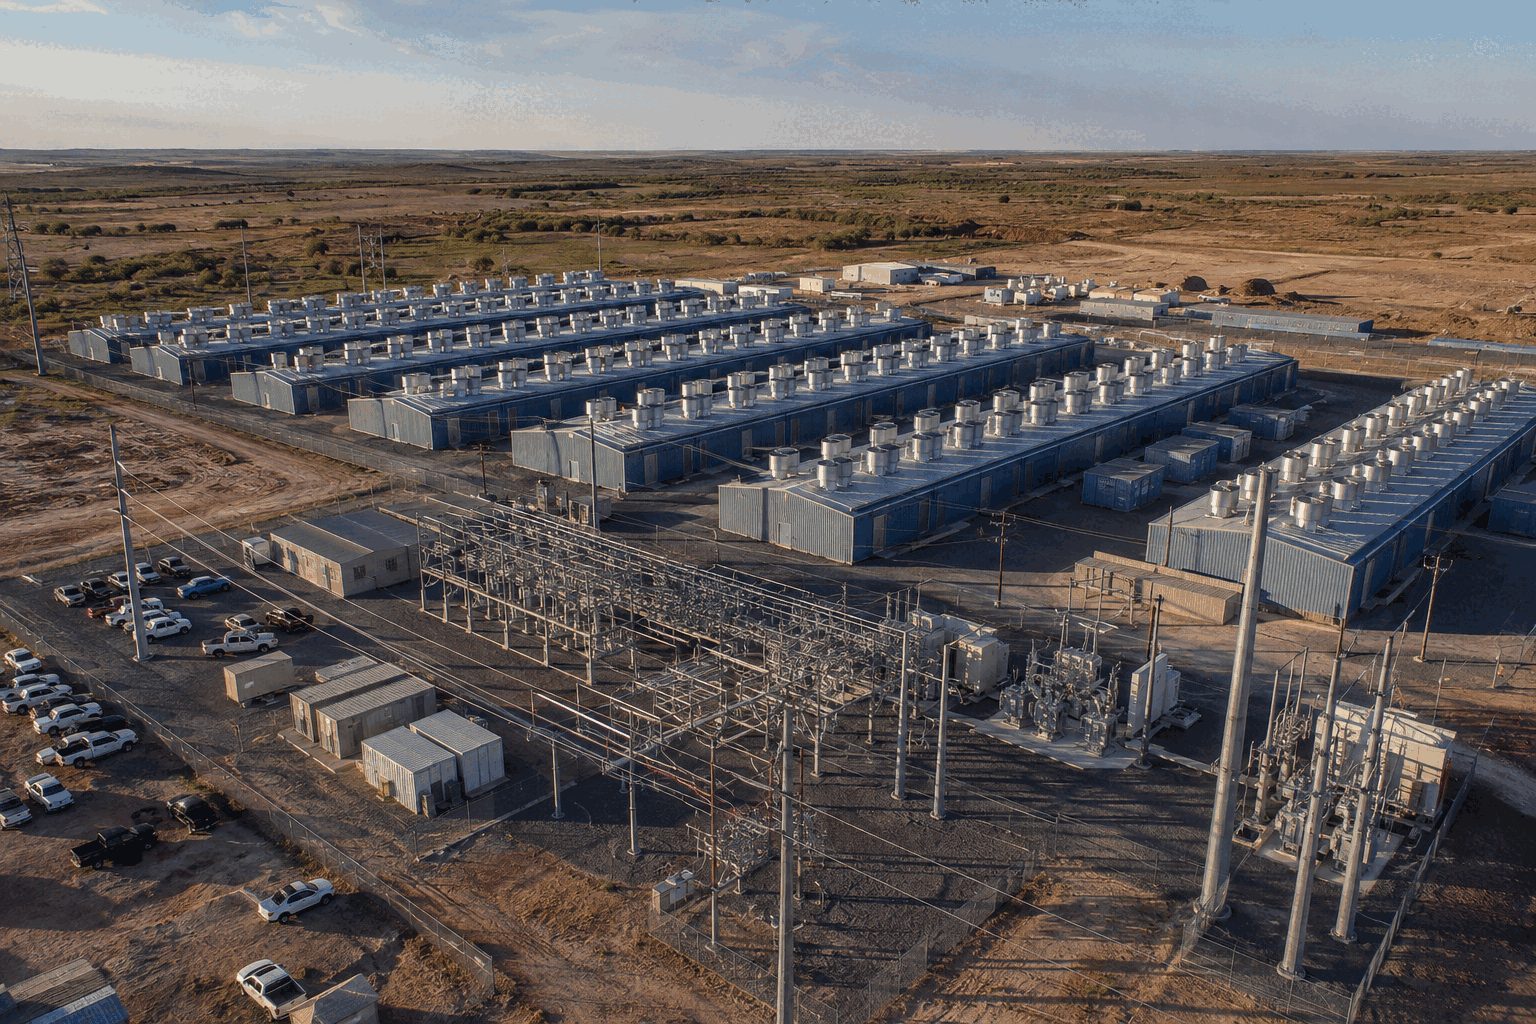
AI Cloud became 51.4% of quarterly revenue. Source: IREN FY26 results, Aug. 27.
Adjusted EBITDA fell 68%; margin contracted to 14.0% from 41.1%.
| Metric | Value | Multiple |
|---|---|---|
| Closing market value | $12.67B | — |
| FY26 GAAP revenue | $707M | 17.9× |
| Operating ARR, Aug. 26 | $1.0B | 12.7× |
| Contracted 2026 ARR | $4.0B | 3.2× |
ARR is non-GAAP and assumes contracted GPUs operate 8,760 hours; recognized revenue may be lower.
| Company | Price | Day |
|---|---|---|
| IREN | $35.45 | −12.6% |
| CoreWeave | $84.23 | −2.9% |
| Nebius | $209.18 | −4.3% |
IREN underperformed both neocloud peers by more than eight percentage points.
| FY26 | Value | YoY |
|---|---|---|
| Total revenue | $707.0M | +41% |
| AI Cloud revenue | $128.8M | +685% |
| Adjusted EBITDA | $245.7M | −9% |
| Net result | −$702.6M | vs +$86.9M |
Net loss included $638.8M of non-cash impairments.
H.C. Wainwright: Buy, $90 target, reiterated Aug. 28.
B. Riley: commercial and financing path validated; execution now moves to commissioning.
Visible Alpha quarterly adjusted-EBITDA consensus was $57.1M versus $19.2M reported.
Horizon 2 commissioning; Horizon 3–4 target Q4 2026.
$1B operating ARR must approach $4B contracted ARR.
$14B of cash, committed financing and prepayments supports rollout.
Delays, customer concentration, GPU pricing, debt and obsolescence.
BMNR selloff versus marked Ethereum assets
ETH marked at $2,438; other assets use August 23 company disclosures. Market cap uses 603.23M shares and Friday's close.
| ETH held | 5.848M |
| ETH staked | 5.067M |
| Share staked | 86.7% |
| 7-day yield | 2.67% |
| Annualized revenue | $330M |
| Measure | Current | Change / sensitivity |
|---|---|---|
| BMNR | $23.80 | −7.14% |
| Ether | ≈$2,438 | ≈−3.0% / 24h |
| Value impact of 1% ETH move | — | ≈$143M |
| Quarterly common-holder loss | May 2026 | −$83.6M |
| Stockholders' equity | May 2026 | $11.60B |
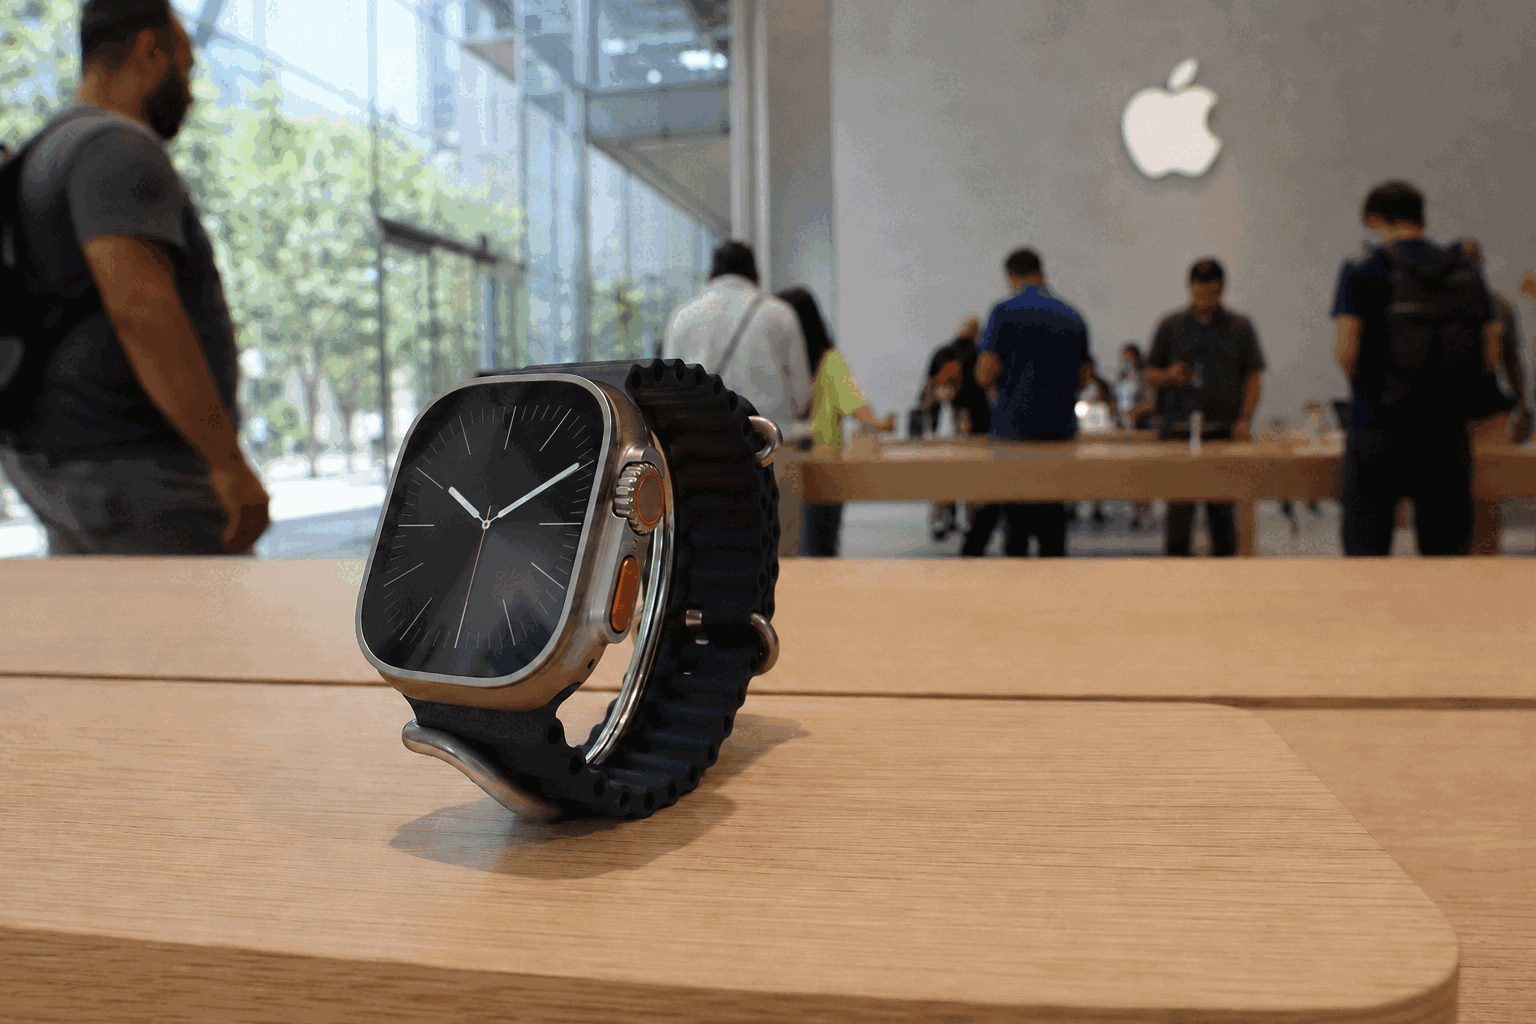
| Item | Status | Investor use |
|---|---|---|
| Apple event | Confirmed | Launch catalyst |
| “Apple Watch Ultra 4” | Not announced | Search term only |
| Current Ultra 3 | $799; 42 hours | Price and battery benchmark |
| Ultra revenue | Not disclosed | Tracked inside $7.88B category |
| Upside | Premium price holds and new health or connectivity features widen upgrade demand. |
| Middle | Incremental update sustains category growth near the latest 6.5% rate. |
| Downside | Limited differentiation shifts buyers to cheaper Watch models or delays upgrades. |
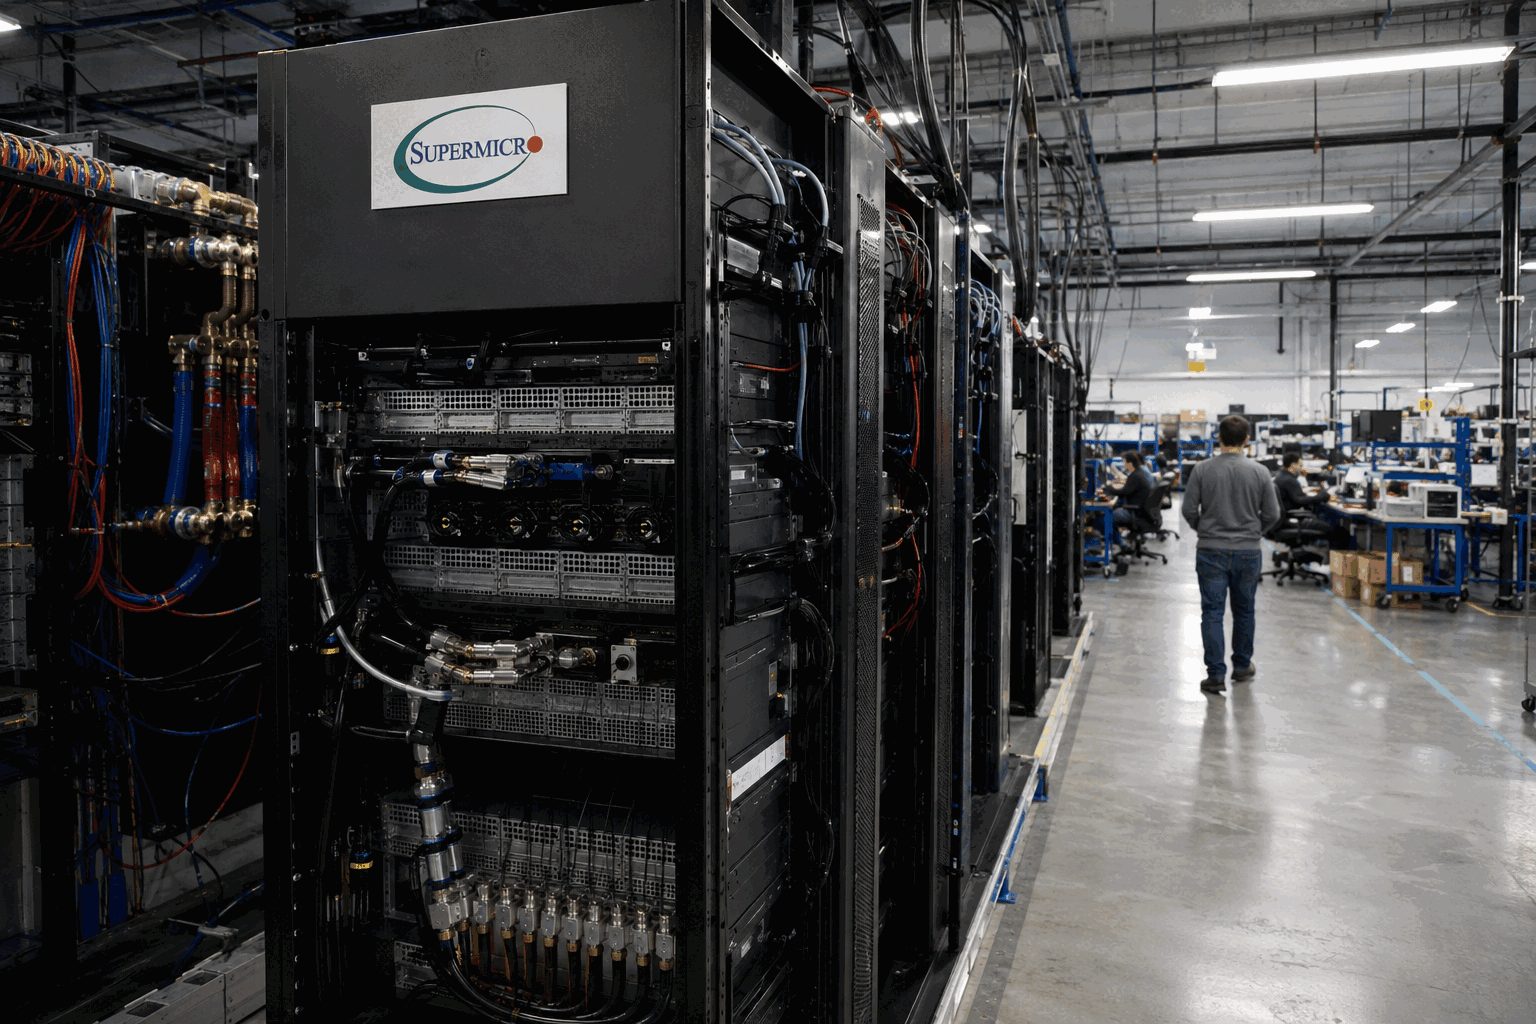
| Metric | FY2026 | Reference |
|---|---|---|
| Revenue | $39.1B | +78% YoY |
| Gross margin | 10.8% | 11.1% prior year |
| Net income | $2.2B | $1.0B prior year |
| Diluted EPS | $3.26 | $1.68 prior year |
| Positive | Quarterly revenue approaches $15B while gross margin holds above the 10.8% full-year level. |
| Neutral | Revenue scales, but mix pulls margin back toward the fiscal-year average. |
| Negative | Customer timing or power and cooling constraints delay rack acceptance. |
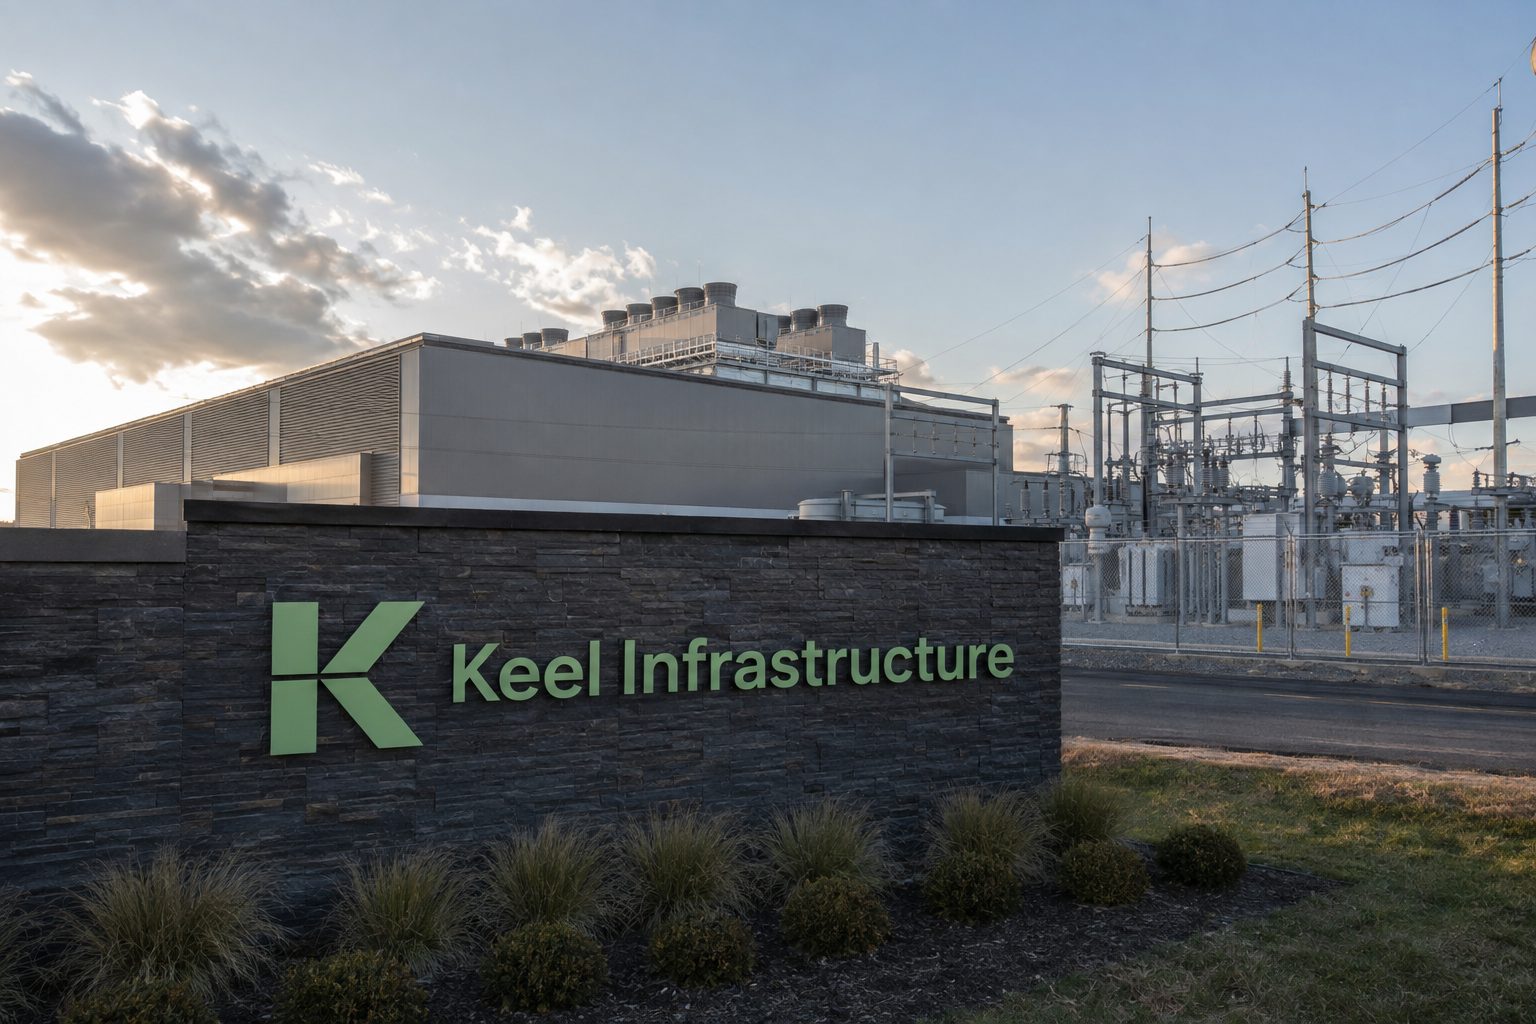
| Metric | Q2 2026 | Change |
|---|---|---|
| Revenue | $30.4M | -50% |
| Operating result | -$141M | From +$11M |
| Adjusted EBITDA | -$23.7M | From +$6.6M |
| Continuing loss | -$64M | -$0.11/share |
| Milestone | Current state | Signal |
|---|---|---|
| Commercial demand | Negotiations at three sites | Signed lease needed |
| Washington HPC | 18 MW conversion | No HPC revenue yet |
| Funding | $458M convertibles | 1.25%, due 2032 |
| Legacy exit | Mining decommissioned at key sites | Near-term revenue gap |
The valuation case depends on converting powered land into long-duration AI leases before liquidity is consumed. Each 100 MW of signed capacity would materially improve visibility, but economics remain undisclosed.

41 fewer problems per 100 vehicles year over year.
~300 veteran engineers added to weekly design reviews.
AI inspection supports plant-floor anomaly detection.
| Business | Q2 2026 EBIT | Investor read |
|---|---|---|
| Ford Pro | +$1.7B | Commercial profit anchor |
| Ford Blue | +$1.1B | Primary warranty leverage |
| Model e | −$919M | Still absorbs core savings |
| Total adjusted | +$2.5B | Up 17% year over year |
| Ford | −0.54% |
| GM | +0.09% |
| Stellantis | +2.56% |
The market did not award Ford a quality premium Friday.

Sep. 15, 2025
Trump files $15B defamation action.
Sep. 19, 2025
Judge strikes 85-page complaint under Rule 8.
July 27, 2026
Dismissal motion deferred; revision allowed.
Aug. 27, 2026
Court-set amendment deadline.
| Metric | Value | YoY |
|---|---|---|
| Revenue | $762.5M | +11.2% |
| Operating profit | $118.0M | +10.8% |
| Digital subscription revenue | $407.9M | +16.4% |
| Digital ad revenue | $114.0M | +20.7% |
| Signal | Market response | Reading |
|---|---|---|
| Q2 subscriber miss · Aug. 5 | Stock −13% | Growth expectations materially repriced |
| Lawsuit trend · Aug. 28 | Stock +0.10% | No visible litigation repricing |
| Friday volume | 995,063 shares | Ordinary trading, not a stress signal |
The $15 billion figure is a plaintiff’s demand. Court rulings, amended pleadings, dismissal arguments, discovery costs and settlement decisions can change exposure. Search interest alone does not establish a new liability.
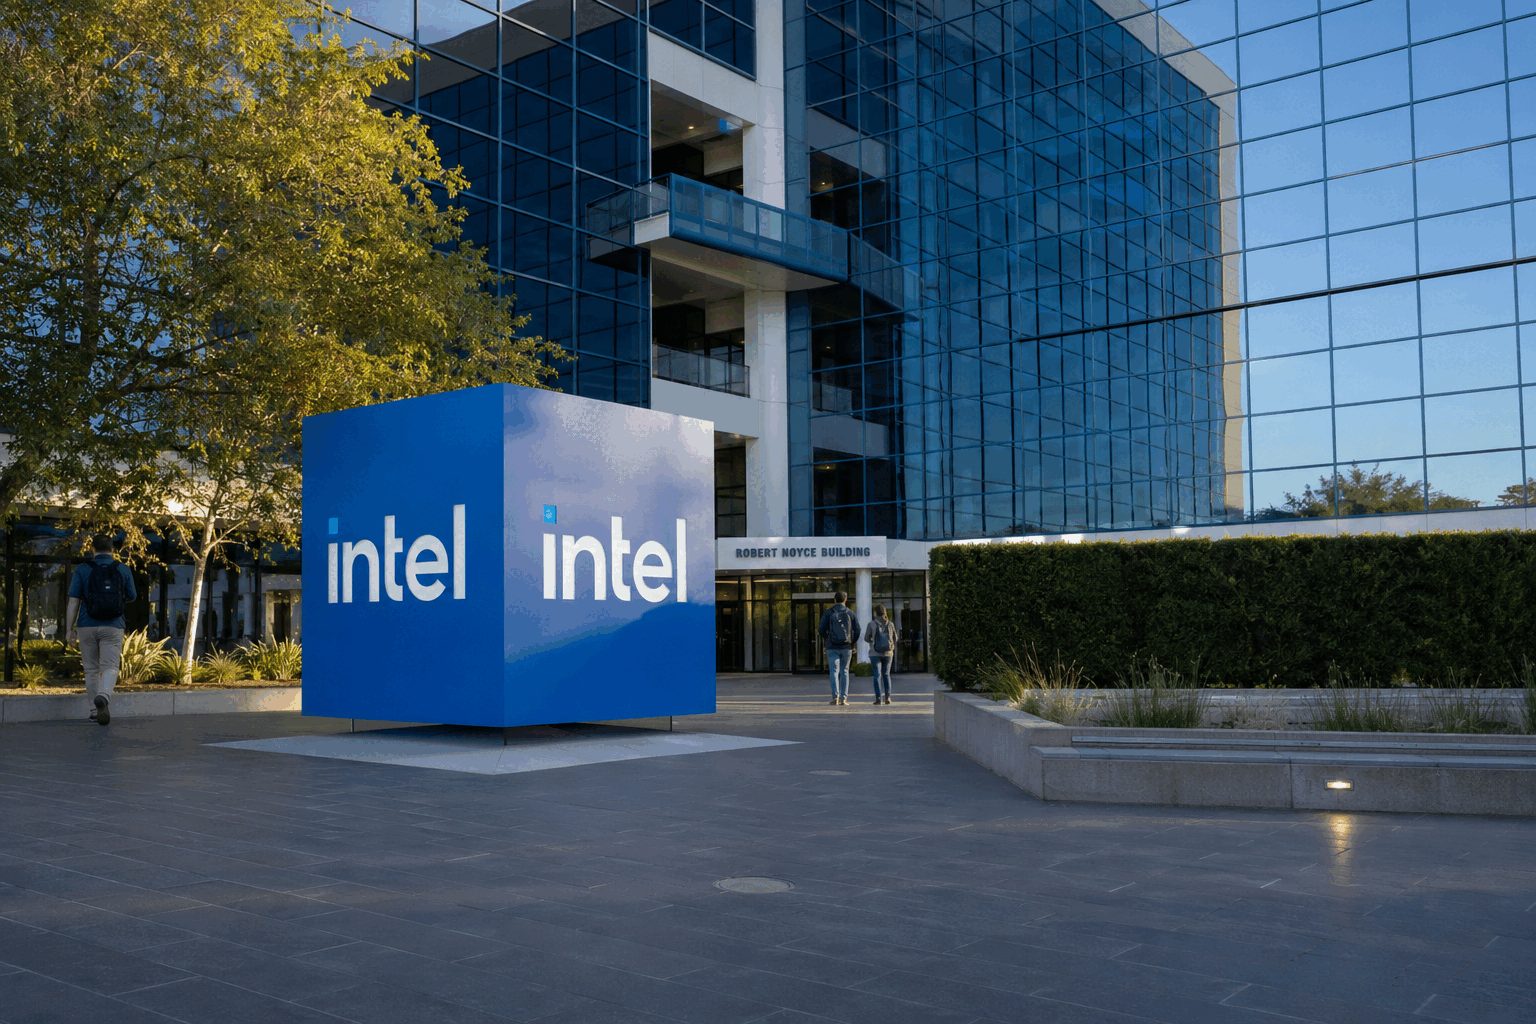
| Company | Close move | Market signal |
|---|---|---|
| Marvell | −10.39% | Google-deal economics |
| Nvidia | −4.59% | Margin reset |
| Intel | −2.83% | Funding/foundry test |
| AMD | −2.34% | Sector repricing |
| Consensus | Hold |
| Ratings | 5 Buy · 24 Hold · 2 Sell |
| Average target | $116.84 |
| Implied upside | +30.6% |
| Target range | $80–$200 |
Sources: market data at Aug. 28 close; Intel Newsroom; Reuters; analyst consensus updated Aug. 28, 2026.
| Metric | Q1 FY27 | Q2 FY27 | Q3 guide |
|---|---|---|---|
| Revenue | $81.6B | $96.2B | $108.0B ±2% |
| Seq. growth | 20.0% | 17.9% | 12.2% |
| Gross margin | 74.9% | 75.0% | 74.0% ±0.5 pt |
| Data center | $75.2B | $89.0B | Not guided |
| Consensus | Buy |
| Ratings mix | 57 Buy · 7 Overweight · 2 Hold · 1 Sell |
| Median target | $316.60 · 45.5% above close |
| Q2 capital returned | $26.0B |
| Remaining repurchase authority | $99.0B |
Sources: NVIDIA Q2 FY2027 release; Reuters, Aug. 27–28, 2026; FactSet via WSJ/MarketWatch. Market figures are time-sensitive and stated as of the timestamps above.

PagerDuty's rally reflects confidence in cost discipline. The next test is whether a leaner organization can lift retention without weakening product delivery.
| Current headcount reduction | ≈15% |
| Estimated charges | $5.5m–$7.5m |
| Most charges expected | Q3 FY27 |
| Substantially complete | By Q4 FY27 end |
| Cash and investments | $470.0m |
At the midpoint, restructuring charges equal about 20% of quarterly free cash flow.
| Metric | Latest |
|---|---|
| GAAP operating income | $10.2m |
| Non-GAAP operating income | $29.5m |
| GAAP net income | $4.7m |
| Paid customers | 15,506 |
| Customers above $100k ARR | 884 |
| Q3 revenue midpoint | $124.0m |
Sources: PagerDuty Q2 FY2027 results; Form 8-K; Canaccord action; market figures timestamped above.
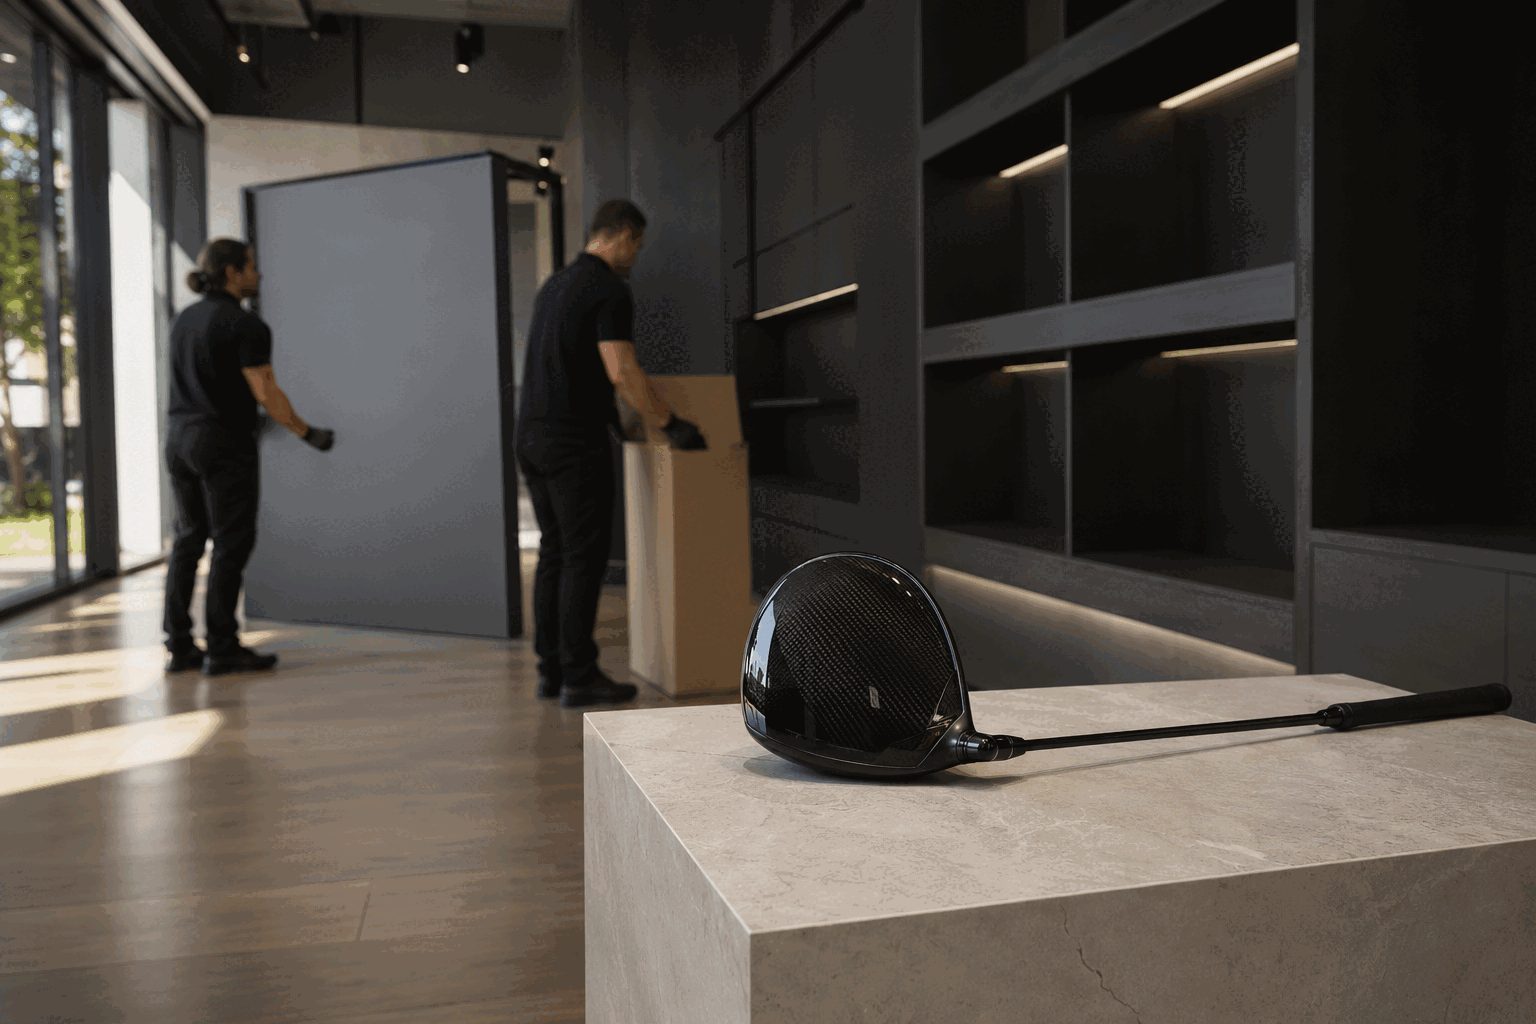
Callaway cut the co-brand relationship as its equipment franchise expands.
| Category | Sales | Growth | Share of Q2 sales |
|---|---|---|---|
| Golf clubs | $316.5M | +1.2% | 51.7% |
| Golf balls | $113.8M | +14.8% | 18.6% |
| Apparel | $105.2M | +0.9% | 17.2% |
| Gear and other | $76.7M | −9.0% | 12.5% |
Raised after Q2
| Q2 2026 | Value | Year-over-year |
|---|---|---|
| Total revenue | $612.2M | +2.0% |
| Golf Equipment revenue | $430.3M | +4.5% |
| Golf Equipment operating income | $100.3M | +31.6% |
| Adjusted EBITDA | $124.9M | +35.8% |
| U.S. revenue | $414.7M | +3.4% |
+28.7% from $15.83
| High | $23.00 |
| Low | $19.00 |
| Ratings | 4 Buy · 5 Hold · 0 Sell |
The event is measurable but not yet material to guidance. Callaway disclosed no lost sales or termination cost beyond the donation. Brand protection can preserve long-term demand, while litigation, additional retailer action or weaker access to younger golfers could offset that benefit.
Sources: Callaway Aug. 4 financial results; Reuters and AP Aug. 27–28 reports; Google Finance. Price and market value are U.S. quotes at 12:05 EDT on Aug. 28, 2026.
A $3.1B pullback leaves most of the earnings rerating intact.
Friday retraced about 29% of Thursday’s estimated $10.6B market-value gain.
| Measure | Latest | Signal |
|---|---|---|
| Q3 revenue | $2.477B | +42% YoY |
| GAAP net income | $545.8M | +125% YoY |
| Non-GAAP EPS | $3.91 | Above guide |
| FY revenue midpoint | $9.715B | Raised |
| Operating cash-flow target | ≈$2.8B |
| Free cash-flow target | ≈$2.6B |
| FCF / revenue midpoint | 26.8% |
| Average analyst target | $544.97 |
| Target upside | ≈21% |
Ansys integration costs, slower EDA demand and weaker cash conversion could compress the earnings multiple. The gap between 41.5% non-GAAP and 10.4% GAAP operating-margin guidance remains large.
Q4: $2.530B–$2.580B revenue and $4.10–$4.16 non-GAAP EPS. Full year: $15.04–$15.10 non-GAAP EPS and approximately $2.6B free cash flow.
Sources: Synopsys fiscal Q3 release and financial supplement; market data at 11:33:12 EDT; analyst consensus accessed Aug. 28. Market-value changes are estimates derived from reported price moves and current capitalization. Not investment advice.
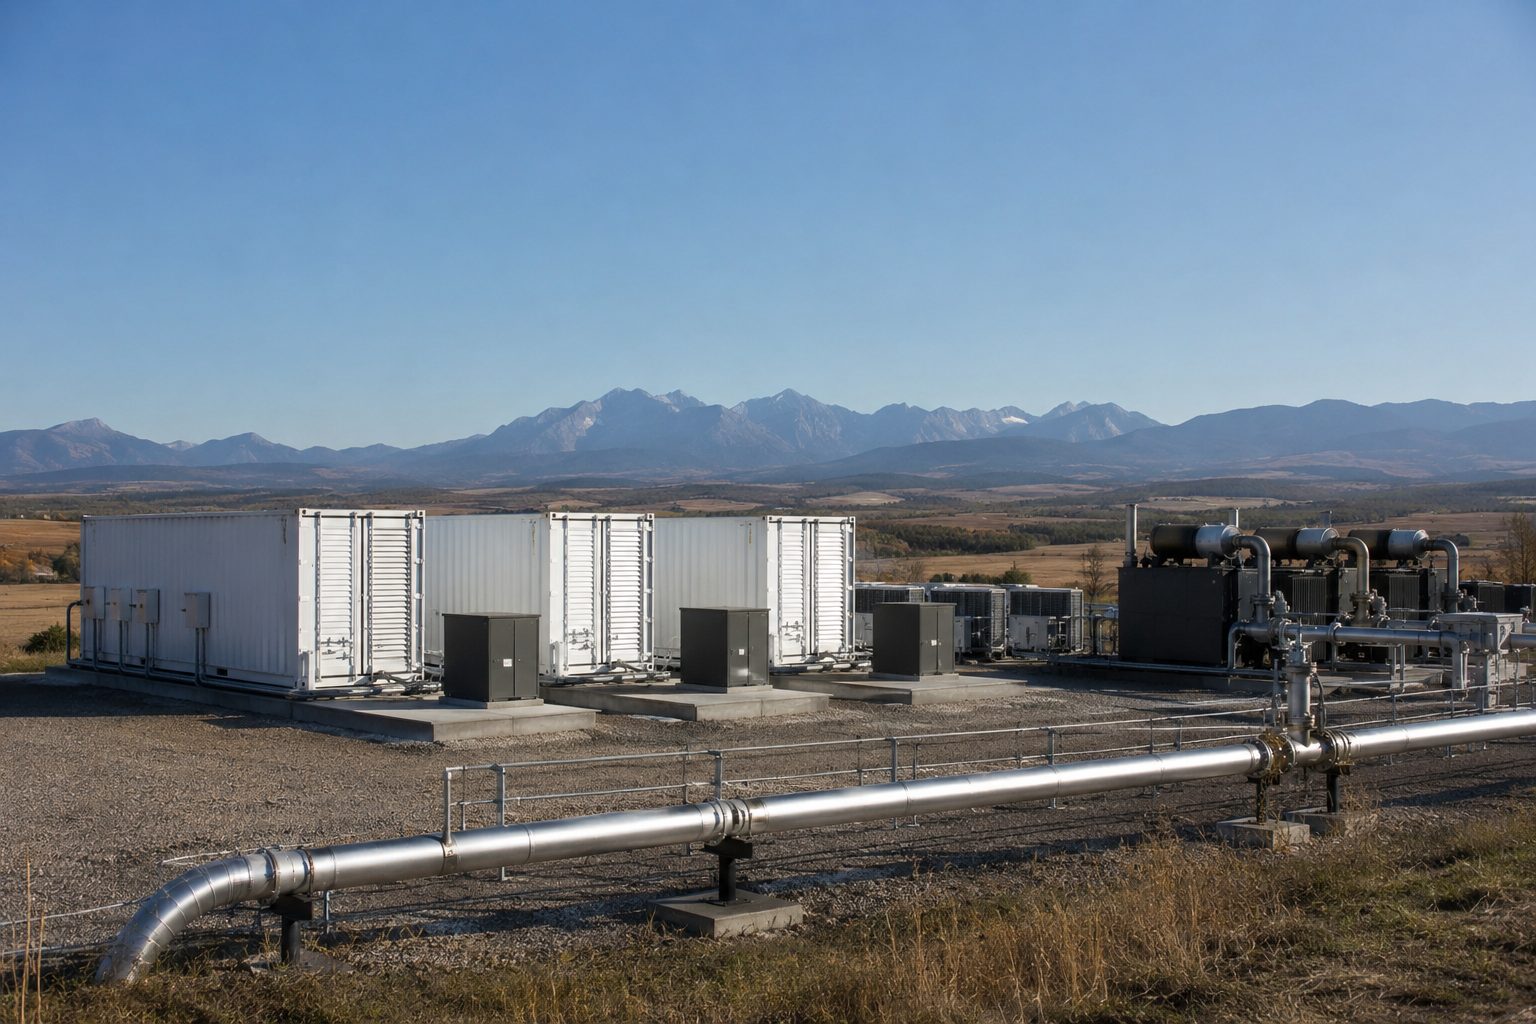
The market priced an AI-infrastructure plan before contracts.
| Measure | Figure | Status |
|---|---|---|
| Lyken.AI ownership | 9.9% | Acquired |
| FNGR shares issued | 1,674,480 | Restricted |
| Cash paid | $0 | Equity-funded |
| B300 nodes | 128 | Nonbinding MOU |
The rally values execution that has not occurred. No site, power, customer or project-financing agreement is definitive. The Lyken customer memorandum is nonbinding. Equity consideration dilutes holders, while micro-cap liquidity can reverse quickly.
Illustrative milestone completion: strategy disclosed; four core contractual steps remain.
Sources: FingerMotion announcement and June 8-K; Aug. 28 filing summary; market data at 11:26:07 EDT. Implied prior market cap and value added are calculations from current market cap and the 261.7% price move. Not investment advice.

Reuters reported Nvidia paused some credit-support deals that exchanged financing help for cloud-revenue participation.
Nvidia said the broader compute-access model remains in place and continues to evolve.
| Metric | Value | Signal |
|---|---|---|
| Revenue | $1.93M | +412% YoY |
| Adjusted EBITDA | $0.59M | Positive |
| Net loss | −$430.4M | Mostly non-cash |
| Cash | $1.861B | Build-out buffer |
| Current note liabilities | $1.007B | Financing weight |
| Checkpoint | Why it matters |
|---|---|
| Financing terms | Determines deployment cost and equity dilution |
| GPU acceptance | Triggers capacity availability and revenue |
| Customer utilization | Turns reserved capacity into billed sales |
| Contract amendments | Tests whether Nvidia's pause reaches SharonAI |
| Cash burn | Measures runway during infrastructure ramp |
The stock move values implementation risk, not simply demand. SharonAI's SEC filing already says deployments need additional debt or equity financing and face phased acceptance tests.
Key question: can $8.8 billion of contracted value convert into revenue without costly new capital?

Eli Lilly · NYSE: LLY · Market data at August 28, 2026, 09:44:26 EDT
| New indication | CV risk reduction in high-risk adults with type 2 diabetes |
| Comparator | Trulicity |
| MACE-3 hazard ratio | 0.92 (95.3% CI: 0.83–1.01) |
| Relative event rate | 8% lower |
| All-cause mortality | 16% lower |
| Statistical result | Noninferior; not superior |
| Product | Q2 2026 sales | Growth |
|---|---|---|
| Mounjaro worldwide | $9.9B | +91% |
| Mounjaro U.S. | $4.8B | +45% |
| Mounjaro ex-U.S. | $5.2B | +172% |
| Zepbound U.S. | $4.9B | +44% |
| Lilly total | $22.97B | Quarter ended June |
Mounjaro as a share of Lilly revenue
43.3%
Mounjaro plus Zepbound as a share of Lilly revenue
64.4%
The label expansion is material because tirzepatide already supplies nearly two-thirds of quarterly revenue.
| Friday open | $1,172.66 |
| Early range | $1,164.32–$1,174.00 |
| 52-week range | $712.05–$1,292.65 |
| P/E ratio | 39.22× |
| Average volume | 2.65M shares |
| Analyst ratings | 18 Buy · 2 Hold · 0 Sell |
Lower realized prices already offset part of U.S. volume growth. Rebate pressure, supply tightness and Novo Nordisk competition can limit incremental revenue. The medicine carries warnings including thyroid C-cell tumors and pancreatitis.
Sources: Lilly, Reuters, PubMed, Lilly Pricing Information and Google Finance. Market data are timestamped above.

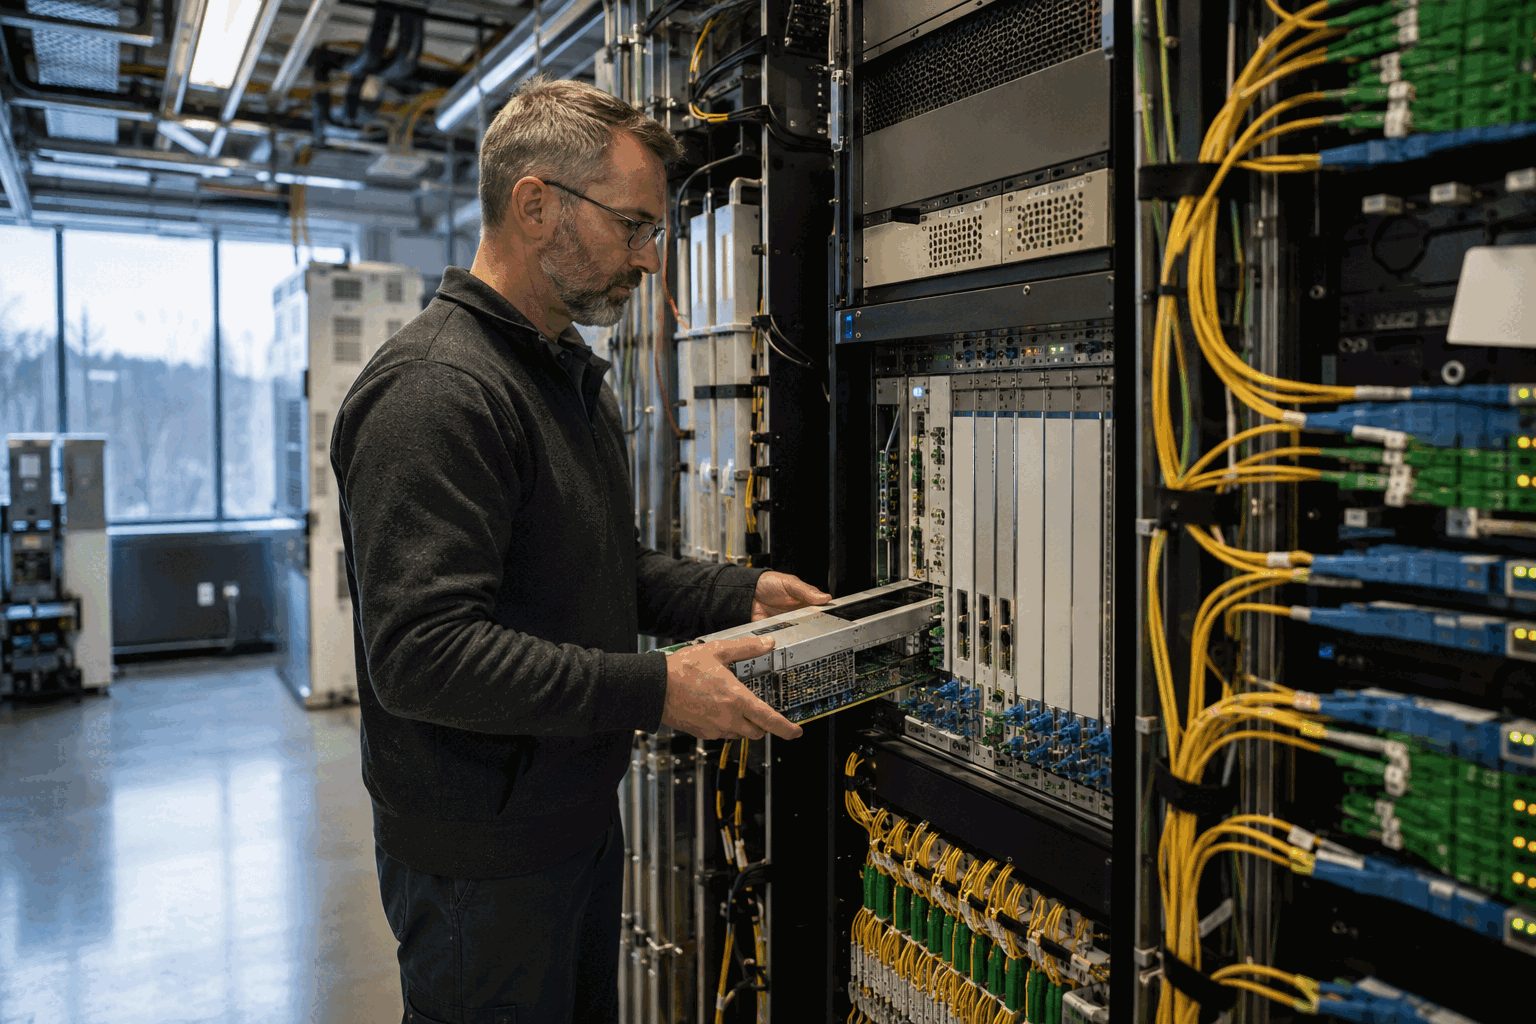
$150 million divided by $6.67. This is a scenario, not a forecast; the program does not require purchases.
| Metric | Reading | Change / signal |
|---|---|---|
| Net sales | $319.6M | −1.4% YoY |
| Adjusted EBITDA | $35.8M | −32.1% YoY |
| Core Aurora margin | 14.2% | 24.7% prior year |
| Free cash flow | −$74.7M | Cash use |
| FY EBITDA guidepost | $200M–$225M | Cut by $25M |
| Signal | Reading | Investor test |
|---|---|---|
| Expected year-end cash | $700M–$750M | No outstanding debt expected |
| Expected 2027 tax refund | $160M | Additional optionality |
| Analyst consensus | Hold · 4 ratings | Targets may need adjustment |
| Average target | $14.67 | Verify post-distribution basis |
| Premarket volume | 7,420 | Thin price discovery |
1 Regular-session liquidity should reveal the cleaner post-payment valuation.
2 Repurchase disclosures will show whether authorization becomes actual demand.
3 Aurora’s 14.2% core margin must stabilize against memory costs and stranded expenses.
4 Cash deployment must balance buybacks, organic investment and acquisitions.
$5 special distribution · $150 million buyback increase · Q2 2026 results · OCC contract adjustment
Do not read the raw −42.65% as like-for-like.
The buyback is discretionary. Aurora still faces margin pressure, negative recent free cash flow and post-divestiture execution risk.
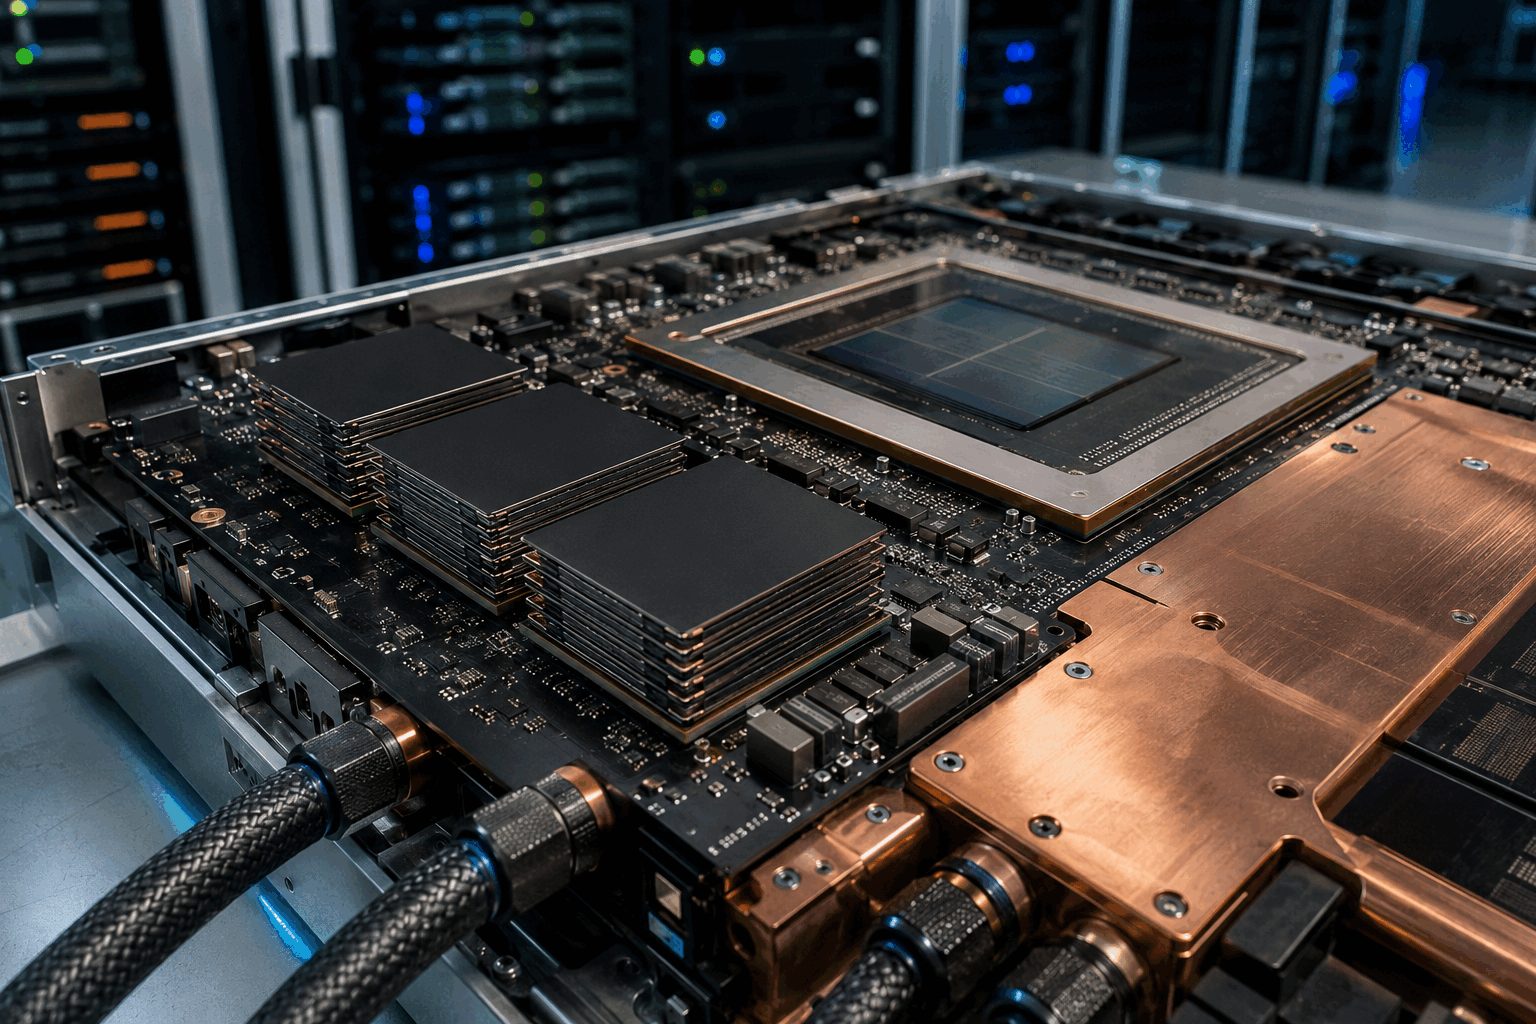
The AI-memory read-through remains strong. Price action says investors still want Micron-specific proof on HBM volume, pricing and margins.
August 27 value is intraday at 09:39 EDT; earlier values are official closes. The stock opened at $967.01 before fading.
| Metric | Current / latest | Comparison | Investor reading |
|---|---|---|---|
| Fiscal Q3 revenue | $41.46B | $23.86B prior quarter | +73.8% sequential |
| Operating cash flow | $25.39B | $11.90B prior quarter | Cash conversion strengthened |
| Adjusted free cash flow | $18.3B | $7.1B capex | Funds expansion internally |
| Adjusted gross margin | 84.9% | 74.9% prior quarter | Exceptional, hard to sustain |
| Forward P/E | 6.5× | 21.2× trailing | Large earnings-cycle assumption |
| Net cash | $23.75B | $21.03 per share | Balance-sheet cushion |
HBM is stacked memory placed beside AI accelerators. Higher accelerator shipments increase the addressable memory content, but Micron’s realized revenue still depends on qualification, allocation, pricing and yield.
| Reference | Target / value | Upside from $943.46 | Implied FY2027 P/E |
|---|---|---|---|
| Current price | $943.46 | — | 6.1× |
| BMO / Mizuho | $1,300 | 37.8% | 8.4× |
| Analyst average | $1,515 | 60.6% | 9.8× |
| Analyst low | $361 | −61.7% | 2.3× |
| Analyst high | $2,200 | +133.2% | 14.2× |