Space Exploration Technologies Corp. closed the week close to its June issue price as 319 million shares became available following a lockup expiration. The newly tradable shares represented 2.68 times Thursday's trading volume. For investors, this put market depth at the forefront as a test, rather than private-company liquidity. SpaceX began public trading on June 12.
| Eligible shares | 319.0M |
| Aug. 20 volume | 119.0M |
| Aug. 21 volume | 78.1M |
| Two-day move | -1.92% |
| Segment | Revenue | YoY | Share |
|---|---|---|---|
| Connectivity | $4.29B | +66% | 54.9% |
| AI | $2.56B | +247% | 32.8% |
| Space | $0.96B | +29% | 12.3% |
| Segment | Operating result | Capex |
|---|---|---|
| Connectivity | +$1.66B | $1.37B |
| Space | -$0.54B | $1.17B |
| AI | -$1.26B | $15.83B |
| Group | -$0.14B | $18.37B |
| Morgan Stanley / Buy | $300 |
| Clear Street / Buy | $217 |
| DZ Bank / Sell | n/a |
Sources: SpaceX SEC Form 10-Q and Q2 earnings release; SEC IPO filing; MarketWatch; S&P Global Market Intelligence and TipRanks via StockAnalysis. Calculations are preliminary and may differ due to rounding.
| Metric | Q3 FY26 | YoY |
|---|---|---|
| Revenue | $109.4B | +16.4% |
| Services | $30.739B | +12.1% |
| Net income | $29.789B | +27.1% |
| Diluted EPS | $2.02 | +28.7% |
| Company | Forward P/E | 52-week move | Read-through |
|---|---|---|---|
| Apple | 33.78× | +36.87% | Highest multiple in group |
| Amazon | 27.91× | +15.56% | Commerce + cloud |
| Alphabet | 25.87× | +73.00% | Ad and AI scale |
| Microsoft | 24.49× | −4.45% | Enterprise AI |
| Meta | 17.17× | −26.46% | Lowest multiple |
| Delivery window | Contract | Expected |
|---|---|---|
| H2 2026 | 3 | 0 |
| 2027 | 44 | 20 |
| After 2027 | 120 | 147 |
The deal may improve manufacturing. The stock still needs rapid order conversion, fewer losses and disciplined integration to defend its premium.
Nine analysts: seven Strong Buy, two Buy.
High short interest can amplify rallies and declines.
Sources: Ondas Q2 2026 and Aran Defense releases; StockAnalysis price history, statistics and analyst forecasts. Company guidance and targets are forecasts, not guarantees.
Consensus: Strong Buy. Twenty-seven of 28 recommendations are Buy or Strong Buy.
The market punished loss of marketing control, then bought the schedule. Thursday's August 27 extended preview is the next measurable checkpoint. Engagement and a firm November 19 release date matter more than the leaked clips themselves.
| Metric | Q2 FY26 | Q2 FY27 est. | Growth |
|---|---|---|---|
| Revenue | $46.7B | $92.16B | +97% |
| Adjusted EPS | $1.05 | $2.09 | +99% |
| Data Center | $41.1B | $85.67B | +108% |
| Data Center mix | 88% | 93% | +5 pts |
| Firm | View | Target | Upside |
|---|---|---|---|
| BMO | Outperform | $340 | 58% |
| RBC | Outperform | $300 | 40% |
| Morgan Stanley | Overweight | $288 | 34% |
| Oppenheimer | Outperform | $265 | 23% |
| Stifel | Buy | $282 | 31% |
Rates rose as expectations stayed high.
The semiconductor index lost about 5% last week. Nvidia fell every session as long-bond yields climbed. Friday’s reported server-price increase now adds an input-cost question before earnings.
The stock recovered faster than analysts raised targets. Consensus now implies only 3.92% upside, while the $174–$350 range signals deep disagreement.
Forecasts from 25 analysts. The spread is $176.
Consensus label: Buy. The mix is less bullish than the headline suggests.
Sources: IBM Q2 2026 results and August 19 quantum update; StockAnalysis price history and analyst forecasts; MarketWatch peer comparison. Forecasts are not guarantees.
| Stock | Market cap | TTM sales | P/S |
|---|---|---|---|
| QUBT | $2.02B | $9.82M | 206× |
| IONQ | $17.89B | $246.47M | 73× |
| RGTI | $5.98B | $13.35M | 448× |
| QBTS | $7.49B | $12.43M | 603× |
Sector rotation, not fresh company news.
QUBT rallied with IONQ, RGTI and QBTS after three declining sessions. The volume jump supports a risk-on move. The latest company earnings release remains the Aug. 10 Q2 report.
A close above $9.18 would strengthen the rebound. A break below $8.14 would return focus to execution, spending and order conversion.
| Reference | Level | Gap |
|---|---|---|
| 50-day average | $74.52 | +6.8% |
| 200-day average | $88.42 | −10.0% |
| 52-week high | $126.71 | −37.2% |
| 52-week low | $65.08 | +22.3% |
| Metric | Reading |
|---|---|
| Trailing P/E | 25.1× |
| Forward P/E | 23.0× |
| Trailing FCF | $11.15B |
| FCF margin | 23.1% |
| 2026 revenue guide | $51.0B–$51.4B |
| Blood Sacrifice | 5 episodes |
| Global launch | Aug. 20 |
| H1 Netflix viewing | >97B hours |
| Next checkpoint | Weekly Top 10 rank and staying power |
A country-level or global Top 10 debut would confirm discovery. Persistence would matter more. A short-lived UK ranking would not justify a revenue revision on its own.
| Target | Value | Vs. $344.82 |
|---|---|---|
| Consensus average | $428.04 | +24.13% |
| Low | $340 | −1.40% |
| High | $515 | +49.35% |
| Revenue test | Value |
|---|---|
| Q1 FY27 actual | $81.62B |
| Q2 guide midpoint | $91.00B |
| Q2 consensus | $92.16B |
| Street premium to guide | +1.27% |
| Expected adjusted EPS | $2.09 |
| Firm | Rating | Target | Upside |
|---|---|---|---|
| BMO Capital | Outperform | $340 | 58% |
| Benchmark | Buy | $335 | 56% |
| Oppenheimer | Buy | $265 | 23% |
| Consensus | Strong Buy | $304.73 | 42% |
| Metric | 2026 | Comparison |
|---|---|---|
| Cash & securities | $237.9m | −$80.2m in H1 |
| Q2 operating expense | $42.9m | +55.0% YoY |
| Q2 net loss | $40.7m | +57.2% YoY |
| Runway at H1 loss pace | ~19 months | Preliminary |
| Firm | Action | Rating | Target | Versus $6.29 |
|---|---|---|---|---|
| Cantor Fitzgerald | Upgrade | Buy | $28 | +345% |
| Piper Sandler | Maintain | Hold | $2 | −68% |
| B. Riley | Maintain | Hold | $5 | −21% |
| Consensus | — | Hold | $10.50 avg. | +67% |
| Median | — | — | $6 | −5% |
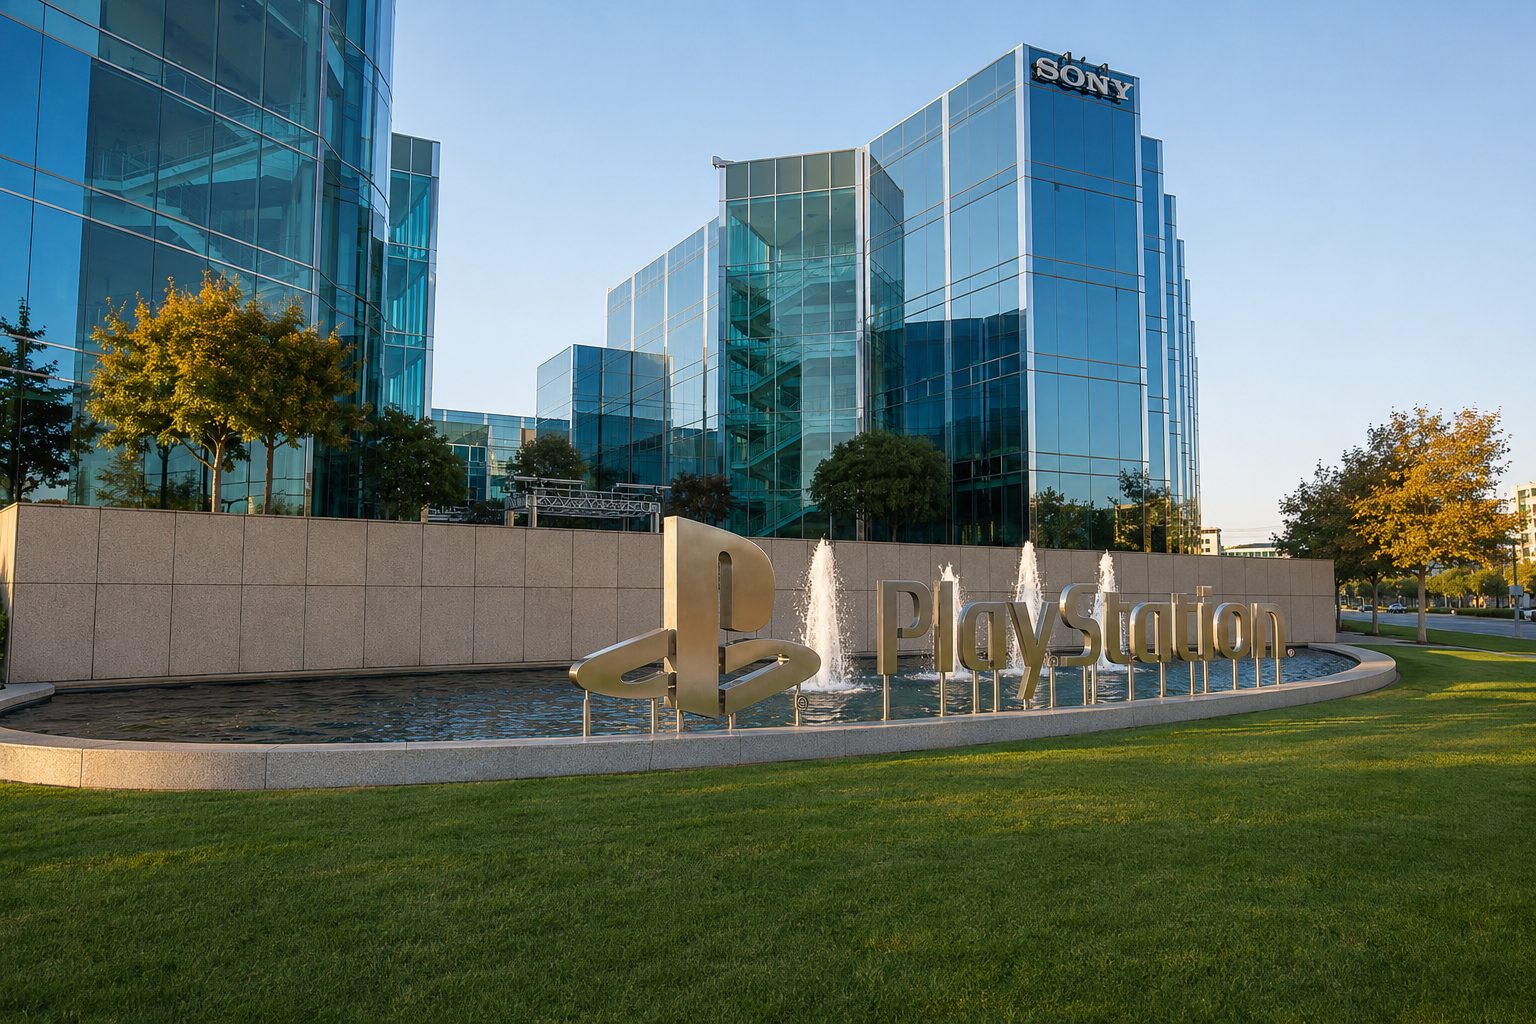
Digital software, add-ons and network services: ¥693.8bn, or 74.0% of Q1 gaming sales.
| Measure | Q1 FY25 | Q1 FY26 | Change |
|---|---|---|---|
| Gaming sales | ¥936.5bn | ¥937.1bn | +0.1% |
| Operating income | ¥148.0bn | ¥202.0bn | +36.5% |
| Operating margin | 15.8% | 21.6% | +5.8 pts |
| Monthly active users | 123m | 125m | +1.6% |
| PS5 units | 2.5m | 1.6m | −36.0% |
| Firm | Call | Target | Upside |
|---|---|---|---|
| JPMorgan | Buy | ¥5,800 | +53.2% |
| Nomura | Buy | ¥4,900 | +29.5% |
| Benchmark | Buy | ¥4,200 | +11.0% |
| Bernstein | Hold | ¥3,800 | +0.4% |
| Citi | Hold | ¥3,500 | −7.5% |
Tokyo close: ¥3,785 on Aug. 21, 2026.
Sources: Sony Group Q1 FY2026 presentation and supplemental information; PlayStation Blog; campaign organizers; MarketWatch; AP; Yahoo Japan; Investing.com. The boycott sensitivity discussed in the accompanying article is illustrative, not a forecast. Price data are time-stamped above.
Down 3% year on year. Recurrent consumer spending was 84% of bookings. GAAP revenue rose 2% to $1.53bn.
The company also guides to GAAP revenue of $7.9bn–$8.1bn and capital spending near $290m.
Further leaks, a weak reveal, cancellations, launch slippage or soft mobile bookings could challenge the bullish target range.
| Target | Price | Move from close |
|---|---|---|
| Low | $215 | -30.5% |
| Average | $326.34 | +5.5% |
| Median | $335 | +8.3% |
| High | $400 | +29.3% |
| What to watch | Verified baseline | Bull case | Risk |
|---|---|---|---|
| September product event | First-half September timing is reported, not official | Pro-first mix lifts average price | Delay or weaker premium demand |
| iPhone momentum | Q3 revenue +21.7% year over year | Upgrade cycle extends | Lower-priced models arrive later |
| Gross margin | 50.1%; about 2 points from tariff refunds | Mix offsets component costs | Underlying margin nearer 48.1% by simple subtraction |
| Street valuation | $326.34 average target | High target reaches $400 | Low target is $215 |
Market data: August 21, 2026, 4:00 p.m. EDT · U.S. market closed
Preliminary calculation from the August 18 high, August 20 low and Friday close. Price movement has multiple causes.
| Event | Date |
|---|---|
| Reported subpoenas filed | Aug. 20 |
| Official GTA VI extended look | Aug. 27 |
| Requested subpoena response | Sept. 4 |
| GTA VI launch | Nov. 19 |
The August 27 stream starts at 3 p.m. EDT on Netflix and 9 p.m. EDT on Rockstar channels.
| Measure | Value | Gap |
|---|---|---|
| Company low | $8.0bn | −9.7% |
| Company midpoint | $8.1bn | −8.6% |
| Company high | $8.2bn | −7.4% |
| Street estimate cited by Reuters | $8.86bn | Reference |
Guidance is unchanged despite unusually strong preorder demand.
| Firm | View | Target | Upside |
|---|---|---|---|
| BTIG | Buy | $313 | 30.6% |
| J.P. Morgan | Buy | $310 | 29.4% |
| Roth Capital | Buy | $300 | 25.2% |
| Wolfe Research | Buy | $289 | 20.6% |
| 28-analyst average | Strong Buy | $286.89 | 19.7% |
Risks: Rockstar has not fully authenticated the leaked material. Legal outcomes remain uncertain. GTA VI could face delays, weak preorder conversion, higher launch costs or softer engagement. Market-value estimates use an implied share count.
Friday's rally followed the second box. Three consequential stages still remain.
SELLAS' rally now rests on an event-driven Phase 3 survival readout. Cash is meaningful, but it explains only 4.4% of market value.
SLS gained 54.4% across three consecutive winning weeks.
What Friday's equity value represents
No product revenue was reported for the first half of 2026.
REGAL is event-driven; the date cannot be fixed.
Statistically significant, clinically meaningful survival could support a potential BLA filing.
A missed survival endpoint would remove the main late-stage pillar beneath valuation.
Six months ended June 30, 2026
Weekly stock moves use August 14–21 closes. Targets are current S&P Global consensus data.
| Company | Weekly move | Consensus | Analysts | Average target | Implied return |
|---|---|---|---|---|---|
| Moderna · NASDAQ:MRNA | +129.2% | Hold | 23 | $91.39 | -37.0% |
| SELLAS · NASDAQ:SLS | +21.0% | Buy | 2 | $32.50 | +110.2% |
| Merck · NYSE:MRK | +12.3% | Buy | 28 | $147.77 | -3.1% |
| ImmunityBio · NASDAQ:IBRX | +2.9% | Strong Buy | 4 | $12.75 | +63.7% |
REGAL could miss its survival endpoint or face regulatory demands for more evidence. SLS009 remains early. Warrant exercises and future equity sales can dilute holders. A reversal in cancer-vaccine sentiment could erase gains before company-specific data arrive.
Stock data: August 21, 2026, 4:00 p.m. EDT. Dashboard status: August 22, 2026, 6:24 a.m. EDT. Sources: SELLAS SEC filings; ClinicalTrials.gov; Yahoo Finance; StockAnalysis. Peer programs differ in platform, indication and stage.
Today’s highest-ranked model selections.
The catalysts most likely to move markets.
This is the clearest scheduled U.S.-market price-discovery point today and can transmit weekend news into equity-index futures before Monday's cash session.
The Q2 retail package can move NZD and regional risk sentiment. Spillover to U.S. assets is usually secondary unless the result is unusually large.
The absence of U.S. releases, earnings, IPO pricings and split events leaves fewer scheduled catalysts, increasing the relative importance of weekend headlines and positioning at the futures reopen.