NASDAQ:SPCXSpace
SpaceX Shares Advance 0.5% as $18.4 Billion Capital Spending Outpaces Revenue
Space Exploration Technologies Corp. rose 0.45% on Friday, ending the session at $141.50. Trading volume reached 55.1 million shares.
Market intelligence
Fast, evidence-led coverage of the companies and events moving global markets.
All coverage
Space Exploration Technologies Corp. rose 0.45% on Friday, ending the session at $141.50. Trading volume reached 55.1 million shares.
| Segment | Revenue | Operating income | Capex |
|---|---|---|---|
| Space | $0.96B | −$0.54B | $1.17B |
| Connectivity | $4.29B | $1.66B | $1.37B |
| AI | $2.56B | −$1.26B | $15.83B |
| Total | $7.81B | −$0.14B | $18.37B |
Connectivity generated the operating profit. AI consumed 86% of quarterly capital spending.
Cash of $93.52B covers roughly 5.1 quarters at the Q2 capex pace.
Mean analyst target: $219.22 from 35 analysts, or 54.9% above Friday's close. The target range is unusually wide at $117–$450.
Main risks: AI monetization, Starship execution, regulatory approvals, debt costs and post-IPO share supply.
American Airlines Group Inc. ended Friday down 0.58%, with trading volumes substantially above average. The stock finished the session at $13.64 on 63.4 million…
NASDAQ: AAL
Investor dashboard
Updated Aug. 29, 2026, 14:21 ET
Friday close
$13.64
−0.58%
Volume
63.4M
Near 64.4M daily average
Market value
≈$9.0B
At Friday close
Analyst target
$18.50
+35.6% implied
Record sales, narrow profit
$16.7B revenue
Revenue +16.3% year over year; GAAP net income only $71M.
Fuel versus pricing
+$2.2B fuel expense
Fuel cost rose 83%. Higher fares offset nearly half the headwind.
Approximate share of fuel increase offset through fares, company disclosure.
Operating and outlook snapshot
| Measure | Current / latest | Signal |
|---|---|---|
| Premium passenger unit revenue | +13.4% YoY | Demand strength |
| Managed corporate revenue | +26% YoY | Business travel |
| Q3 revenue guide | +16% to +19% | Momentum |
| Q3 adjusted EPS guide | ($0.70) to ($0.10) | Loss expected |
| Q3 fuel assumption | ≈$3.75/gal | Margin pressure |
| Available liquidity | $11.3B | Buffer |
Analyst spread
$10–$25
12 Buy · 11 Hold · 2 Sell
$13.64 lies 56.7% through the published target range.
What changes the thesis
Upside: realized fuel below $3.75, sustained premium demand, and improved non-fuel unit costs.
Risks: fuel volatility, weaker travel demand, labor disruption and high debt.
Price and volume: Aug. 28, 2026 close, Reuters/Yahoo-derived market data. Fundamentals and guidance: American Airlines Q2 2026 release dated July 23. Analyst consensus observed Aug. 29, 2026. Figures may be rounded.
SYDNEY, August 29, 2026, 14:00. IREN shares dropped 12.5% after the company’s $30 billion capital expenditure raised concerns in light of its $4 billion…
| Metric | Q4 FY26 |
|---|---|
| AI cloud revenue | $70.5M · +110% QoQ |
| Bitcoin mining revenue | $66.7M |
| Total revenue | $137.2M · −5% QoQ |
| Adjusted EBITDA | $19.2M · −68% QoQ |
| Net loss | −$684.0M |
| Metric | FY26 |
|---|---|
| AI cloud revenue | $128.8M vs $16.4M |
| Bitcoin mining revenue | $578.2M |
| Total revenue | $707.0M |
| Adjusted EBITDA margin | 35% vs 54% |
| Non-cash impairments | $638.8M |
| Watch item | Investor signal |
|---|---|
| GPU deployment | Revenue conversion |
| Power and construction | Schedule risk |
| Customer concentration | Credit exposure |
| Debt and equity issuance | Dilution / refinancing |
| Adjusted EBITDA margin | Return on buildout |
Walt Disney shares gained 1.20% after Disney+ announced a global Pokémon distribution agreement. The rise added roughly $2.2 billion in market value.
| Asset | Status |
|---|---|
| Pokémon the Series: The Beginning | Streaming now in selected markets |
| Sirfetch'd & Pichu | Exclusive Disney+ stream in 2027 |
| Production studio | Aardman |
| Geography | Global distribution |
| Financial terms | Not disclosed |
| Metric | Q3 FY26 |
|---|---|
| Subscription revenue | $4.7B · +15% |
| Advertising growth | +3% |
| Primary investor test | Lower churn |
| Secondary test | International engagement |
| Launch timing | 2027, exact date pending |
| Signal | Investor read |
|---|---|
| Catalog title viewing | Near-term engagement |
| 2027 launch | Acquisition and retention test |
| International monetization | Management priority |
| Undisclosed license cost | Return cannot be calculated |
CME Group Inc. stock climbed 1.73% on Friday, as investors focused again on the exchange operator’s record trading volumes. The company’s market value increased…
| Measure | Reading |
|---|---|
| July average daily volume | 27.0M · +23% YoY |
| International July volume | 8.8M · +32% YoY |
| Q2 revenue | $1.7B |
| Q2 adjusted operating margin | 69.5% |
| Q2 adjusted EPS | $2.99 |
| Q2 market-data revenue | $238M · +20% |
| Ratings mix | Count |
|---|---|
| Buy | 9 |
| Hold | 15 |
| Sell | 6 |
| Distance from 52-week high | −13.2% |
| Driver | Investor read-through |
|---|---|
| Rate and equity volatility | More hedging can lift contract volume |
| Sept. 15–16 FOMC meeting | Policy repricing may boost rate activity |
| International growth | 8.8M July ADV diversifies demand |
| Low-volatility reversal | Main near-term volume risk |
| Competition and regulation | Pressure on pricing or share |
Lululemon Athletica Inc. rose 5.05% on Friday, closing at $120.81. The increase lifted its market capitalization by about $660 million, according to Yahoo Finance’s…
Market data: August 28, 2026 · 16:00 EDT | Checked: August 29, 2026 · 13:18 EDT
| Measure | Current view | Investor read |
|---|---|---|
| Q2 revenue guide | $2.450B-$2.475B | −3% to −2% |
| Q2 EPS guide | $1.76-$1.81 | Midpoint $1.785 |
| Q2 consensus EPS | $1.79 | At guide midpoint |
| FY2026 EPS guide | $10.95-$11.15 | 10.9× midpoint P/E |
| Next catalyst | September 3 | After U.S. close |
Q1 2025 versus Q1 2026. Gross margin fell 410 bps; operating margin fell 730 bps.
The stock's $120.81 close nearly matches FactSet's $121.10 average target. The median target is $120. The rebound therefore prices a cleaner quarter, not broad analyst conviction.
3 Buy1 Overweight27 Hold4 Sell| Cash | $1.5B |
| Revolver capacity | $593.6M |
| Q1 repurchases | $358.3M |
| Inventory | $1.7B, +2% |
Downside: markdowns, weak U.S. traffic, tariffs and another guidance cut.
Upside: better full-price sales, narrowing margin pressure and a credible September leadership reset.
Sources: lululemon Q1 fiscal 2026 release and Q2 call notice; Yahoo Finance; FactSet via WSJ. Figures may be delayed. Not investment advice.
Chevron Corporation rose 1.05% on Friday, as investors considered the prospect of Venezuelan growth. The increase boosted its equity value by about $4.1 billion.
Chevron is nearing a Venezuela venture migration.
Reuters reported greater operating control at Petropiar, expansion into Ayacucho 8 and a second possible Orinoco project. Chevron declined comment.
Next checkpoint: reported signing expected Wednesday, Sept. 2.
| Instrument | Close | Day | Read-through |
|---|---|---|---|
| Chevron | $201.86 | +1.05% | Venezuela optionality |
| Exxon Mobil | $156.71 | +0.17% | Lagged Chevron |
| ConocoPhillips | $130.35 | +0.64% | Positive energy tape |
| S&P 500 | 7,711.76 | −0.25% | Chevron outperformed |
SoFi Technologies Inc. dropped 5.8% on Friday, as investors reconsidered the digital lender's elevated valuation following a record-setting second quarter.
| Measure | Q2 2026 | Change |
|---|---|---|
| GAAP revenue | $1.219B | +43% y/y |
| Adjusted EBITDA | $357.8M | +44% y/y |
| Net income | $156.6M | +61% y/y |
| Members | 15.8M | +35% y/y |
| Segment | Revenue | Change |
|---|---|---|
| Lending, adjusted | $711.7M | +59% |
| Financial Services | $466.3M | +29% |
| Technology Platform | $84.5M | −23% |
Galileo's account base fell to 134.8 million after a major client exited. Sequential platform revenue still rose 13%.
| Signal | Reading | Investor meaning |
|---|---|---|
| 2026 revenue guidance | $4.75B–$4.85B | Raised after Q2; midpoint implies 4.9× market-cap-to-sales. |
| Tangible book value | $7.34/share | Friday close equals roughly 2.5× tangible book. |
| Analyst consensus | Hold; $20.02 target | Average upside is 10.9% from Friday's close. |
| Next confirmed event | Sept. 8, 10:50 PDT | CFO fireside chat at Goldman Sachs Communacopia. |
Sources: SoFi Q2 2026 SEC-filed release; StockAnalysis market data and consensus; SoFi investor-relations event notice. Multiples are calculations from disclosed values. Market data timestamp: Aug. 28, 2026, 16:00 EDT.
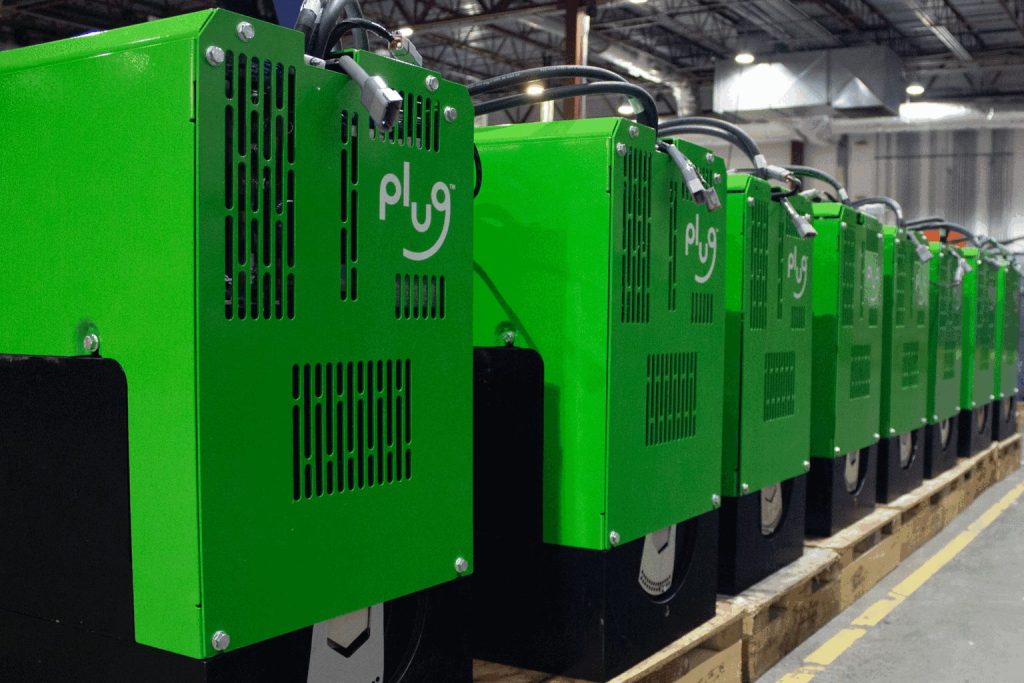
Plug Power Inc. stock slipped 3.5% on Friday, even after the hydrogen provider posted its first approximately break-even quarterly gross margin in four years.
| Measure | Q2 2026 | Change |
|---|---|---|
| Revenue | ~$178M | +9% q/q |
| Operating expenses | ~$62M | −50% y/y |
| Net cash usage | ~$61M | −58% q/q |
| Unrestricted cash | ~$162M | quarter end |
| Business | Revenue | Gross margin |
|---|---|---|
| Service | ~$30M | +27% |
| Fuel | ~$39M | −48% |
Service economics turned positive. Fuel losses remain the largest visible drag.
1,666 GenDrive units were deployed, up 125% year over year. Two major customers plan more than 20,000 refreshes over three years.
| Indicator | Current reading | Investor interpretation |
|---|---|---|
| 2026 revenue-growth guide | 15%–16% | Growth accelerated enough for management to raise guidance. |
| Q4 target | Positive EBITDAS | Execution must improve before liquidity tightens. |
| Analyst consensus | Hold; $3.55 average | Targets span $0.75–$7.00, showing unusually wide outcome risk. |
| 52-week range | $1.41–$4.58 | Friday's close sits 52% below the high and 55% above the low. |
Sources: Plug Power Q2 2026 release; StockAnalysis market data; MarketScreener analyst consensus. Multiples and cash coverage are calculations from disclosed figures. Market data timestamp: Aug. 28, 2026, 16:00 EDT. Financial data reported Aug. 10, 2026.
Amazon shares jumped 3.97% on Friday, adding roughly $110 billion of market value. Investors rewarded its AI exposure even as that buildout consumed more…
After-hours: $266.15
$10.17 × 10.79B shares
Day range: $257.78–$267.56
Market cap: $2.87T
Amazon outperformed the Nasdaq Composite by 4.49 percentage points.
Fed Chair Kevin Warsh said AI growth had exceeded even proponents’ expectations. Amazon led the Magnificent Seven after the remarks.
The move also followed fresh bullish analyst commentary and renewed attention to AWS infrastructure demand.
There was no new Amazon earnings release Friday.
| Measure | Q2 2026 |
|---|---|
| Total sales | $200.6B · +20% |
| Operating income | $27.5B · +43% |
| AWS sales | $42.2B · +37% |
| AWS operating income | $16.6B |
| AWS operating margin | 39.3% |
| AWS share of operating profit | 60.4% |
$161.4B · up 33%
−$7.6B · versus +$18.2B one year earlier
Property and equipment purchases increased by $66.1B, primarily for AI.
| Reported net income | $62.6B |
| Non-operating other income | $53.4B |
| Main driver | Anthropic investment |
| Q3 operating-income guide | $22.5B–$26.5B |
The guide midpoint is about 11% below Q2 operating income. Reported EPS should not be read as recurring operating profit.
Consensus: Strong Buy · 60 analysts · $230 low · $405 high.
Targets were checked Aug. 29, 2026. They can lag capex revisions and market-rate changes.
| Signal | Constructive | Warning |
|---|---|---|
| AWS growth | Stays near 37% | Capacity arrives before demand |
| Free cash flow | Returns positive | Outflow deepens beyond −$7.6B |
| AWS margin | Holds near 39% | Power and depreciation compress it |
| Q3 operating income | Above $26.5B | Below $22.5B |
Amazon’s AI businesses are scaling fast enough to command a premium. The stock’s next leg depends on converting infrastructure spending back into free cash flow.
Risks: slower AI utilization, higher rates, energy constraints, depreciation and retail-cost inflation. Faster Trainium adoption or stronger AWS margins would improve the upside case.
Sources: Amazon Q2 results · MarketWatch quote · analyst consensus.
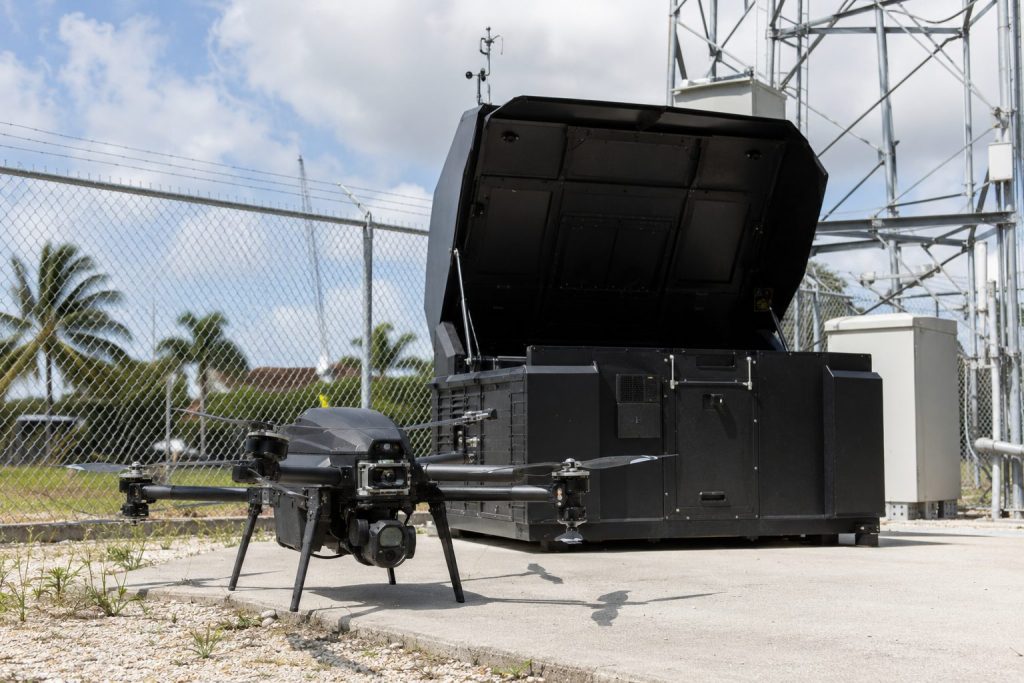
WEST PALM BEACH, Florida, August 29, 2026, 11:43. Ondas shares fell 9.7% after the company disclosed revenue surged thirteen times, but posted an EBITDA…
Range: $7.87–$8.71
Approx. $549M turnover
2026 revenue-guide midpoint
Cash, restricted cash and investments
No fresh company release accompanied Friday’s decline. Heavy turnover points to valuation and position resetting after a rapid growth-and-acquisition cycle.
The stock traded 48.3% below its 52-week high of $15.28.
Q2 results beat the revenue estimate cited by Barron’s, but the adjusted EBITDA loss exceeded expectations.
| Measure | Current figure |
|---|---|
| Q3 revenue guide | $140M–$155M |
| 2026 revenue target | $525M–$550M |
| Reported backlog, June 30 | $613M |
| Pro forma backlog | $757M |
| Q2 + early-Q3 orders | $280M |
| Post-quarter acquisition uses | ~$325M |
43.1% Q2 2026 · 49.2% Q1 2026 · 53.1% Q2 2025
$93.3M in Q2; reported operating expense was $199.1M, including $105.8M of non-cash charges.
The core test is whether revenue approaches guidance while cash operating expense grows more slowly.
| Market capitalization | ~$4.5B |
| 2026 guide midpoint | $537.5M |
| Market cap / guided revenue | ~8.4× |
| Q2 cash pool | $1.4B |
The cash figure predates roughly $325 million of announced Q3 acquisition spending. It should not be treated as current net cash.
Range: $13–$25. Consensus: Strong Buy, according to Investing.com on Aug. 29, 2026.
Targets can lag acquisition costs, dilution and rapid changes in the share count.
| Milestone | What would help | What would hurt |
|---|---|---|
| Q3 revenue | At or above $147.5M midpoint | Backlog converts more slowly |
| Platform profitability | Adjusted EBITDA breakeven by Q4 2026 | Integration costs extend losses |
| Company-wide profitability | Target holds for Q4 2027 | More equity-funded acquisitions |
| Gross margin | Rebounds toward 50% | Mix remains near 43% |
The order book can support another sharp revenue step-up. Friday’s 9.7% decline says the market now wants proof that each new dollar of sales brings Ondas closer to profitability.
Main risks: backlog timing, acquisition integration, margin dilution and further share issuance. Faster defense procurement or a quicker margin recovery would improve the upside case.
Sources: Ondas Q2 results · Yahoo Finance · Investing.com consensus · Ondas IR. Figures are company-reported unless noted.
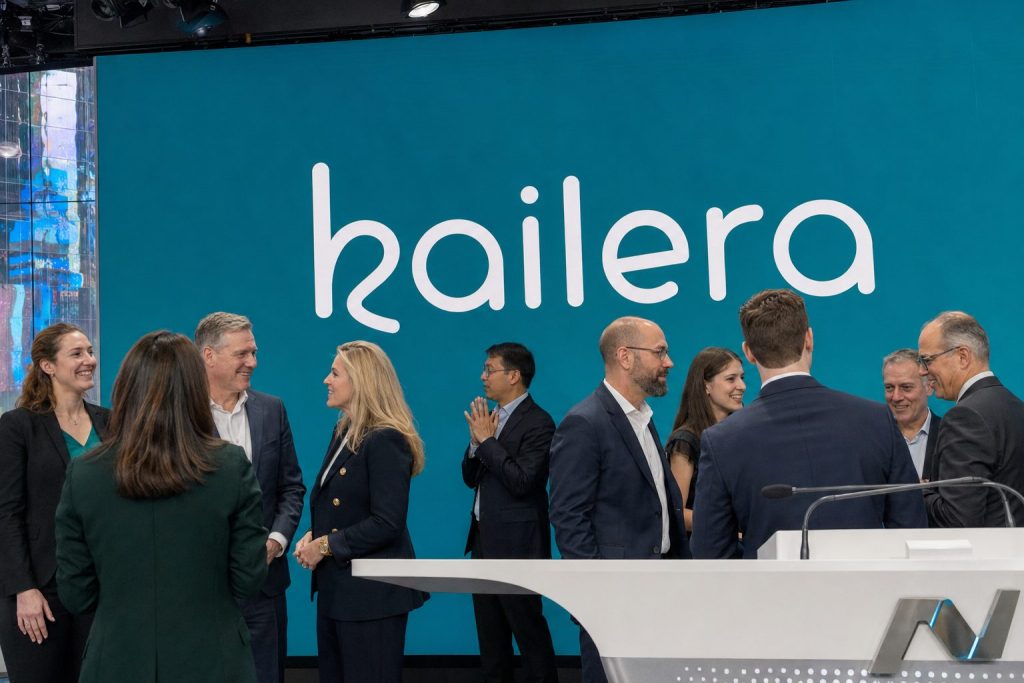
Kailera Therapeutics Inc. fell 12.52% on Friday to $16.21. The stock finished at its session low after opening at $18.26. Volume reached 532,030 shares.
No fresh Kailera filing or press release accompanied Friday's decline. The move exceeded a weak biotech tape.
| Asset | Aug. 28 |
|---|---|
| KLRA | −12.52% |
| XBI biotech ETF | −3.46% |
| Eli Lilly | −0.18% |
| Novo Nordisk ADR | −1.42% |
| Program | Stage / scale | Next milestone | Investor issue |
|---|---|---|---|
| Ribupatide injection GLP-1/GIP dual | Three global Phase 3 trials; >4,700 participants | Global data in 2028 | Largest valuation event; runway reaches stated timing |
| High-dose ribupatide | Phase 2b; 264 U.S. participants; fully enrolled | Mid-2027 data | Earlier efficacy and dose signal |
| Oral ribupatide | FDA IND active | Phase 3 starts in H1 2027 | Oral convenience plus tolerability |
| KAI-7535 | Global Phase 2; ~320 planned | 2027 data | Lower start and slower titration test GI profile |
| KAI-4729 | Planned Phase 1 tri-agonist | Start by end-2026; data 2027 | Earlier-stage option value |
| Equity value at $16.21 | ~$2.10B |
| Less cash and marketable securities | −$1.172B |
| Market value above cash | ~$0.93B |
| Price / cash per share | 1.79× |
Targets are forecasts, not cash flows. Their range depends on clinical success and timing.
| Date | Event | What changes |
|---|---|---|
| Sep. 23–24, 2026 | Bernstein Healthcare Forum | Possible trial-enrollment and capital-allocation detail |
| Sep. 28–Oct. 2, 2026 | EASD meeting | Ribupatide injection-site and Hengrui metabolic data |
| 2027 | Three pipeline readouts / starts | First major tests of efficacy, tolerability and execution |
| 2028 | Global KaiNETIC Phase 3 data | Lead-program valuation event |
Sources: Kailera Q2 update, Yahoo Finance, MarketWatch analyst estimates. Market data as of August 28, 2026 close unless noted.
NORWALK, Connecticut, August 29, 2026, 10:50. BitMine's stock slid 7.1%, as the company's market value stood at $14.4 billion while its cryptocurrency assets grew…
The shares now trade near the company’s reported gross asset figure, but gross holdings are not NAV. Private stakes, taxes, liabilities, custody costs and staked-asset liquidity can widen the gap. Thin analyst coverage—only two listed ratings—also limits the usefulness of consensus targets.
MarketWatch quote · BitMine Aug. 24 release · SEC Form 10-Q · AP market close
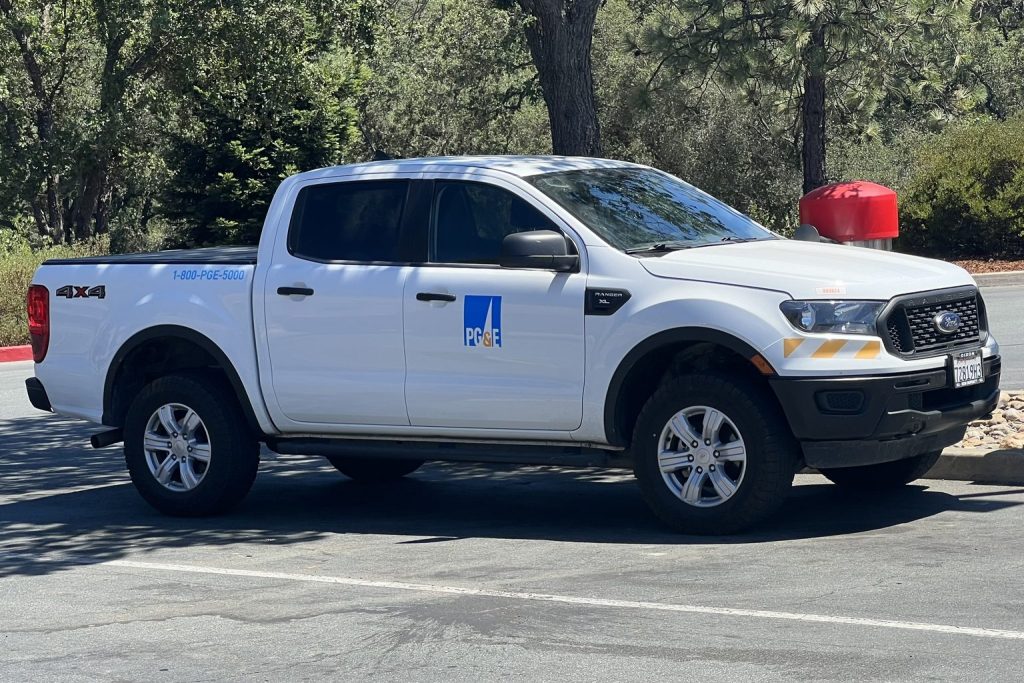
OAKLAND, California, August 29, 2026, 10:29. PG&E stock slumped by 7.5%, erasing $3 billion from its market value, after California's plan to address wildfire…
NYSE: PCG · Market close August 28, 2026, 16:00 EDT · Checked August 29, 2026, 10:29 EDT
Previous close: $17.95. Intraday loss from the high: 9.5%.
| Asset | Friday | Read-through |
|---|---|---|
| PG&E | -7.52% | Direct wildfire-liability exposure |
| Edison International | -4.76% | California peer repricing |
| S&P 500 | -0.25% | Modest broad-market decline |
| Metric | Q2 2025 | Q2 2026 | Change |
|---|---|---|---|
| GAAP EPS | $0.24 | $0.33 | +37.5% |
| Core EPS | $0.31 | $0.40 | +29.0% |
| Core FY guide | $1.48–$1.52 | $1.64–$1.66 | ≈10% midpoint growth |
| Market capitalization | $36.6B |
| Estimated shares | 2.20B |
| Friday turnover | ≈$1.9B |
| Wildfire backstop | ≈$39B |
Valuation uses Friday's close and the midpoint of reaffirmed 2026 core EPS guidance.
| Stage | Status | Investor consequence |
|---|---|---|
| Newsom proposal | Would restrict insurer subrogation against utilities | Potentially reduced future liability |
| Late-August talks | Lawmakers blocked the proposal | Existing liability framework remains |
| Next watch | Session-end compromise or revived negotiations | Binary policy catalyst for PCG and EIX |
| Downside risk | New fire, adverse judgment or higher financing costs | More claims and pressure on customer capital spending |
PG&E's earnings improved, but Friday's $3.0 billion loss shows legal protection can matter more than one quarter's EPS. At about 10.1 times guided earnings, the stock now carries a larger discount for wildfire liability and regulatory uncertainty.
Sources: PG&E, KCRA, CalMatters, Yahoo Finance and Wikimedia Commons. Calculations are estimates based on reported figures.
SANTA CLARA, California, August 29, 2026, 10:01. Nvidia stock declined 4.6%, cutting $251 billion from its market capitalization as a revised margin forecast reined…
Market data: August 28, 2026, 16:00 EDT · Updated August 29, 2026, 10:01 EDT
Two-session return: +3.76%, equal to roughly $190B of net market-value gain.
| Metric | Q2 FY26 | Q2 FY27 | Q3 FY27 guide |
|---|---|---|---|
| Revenue | $46.74B | $96.22B | $108B ±2% |
| GAAP gross margin | 72.4% | 75.0% | 74.0% ±0.5pt |
| GAAP opex | $5.43B | $8.41B | $9.2B |
Revenue doubled year over year, while the guided margin midpoint falls 100 basis points sequentially.
| Market capitalization | $5.24T |
| Trailing P/E | 27.5× |
| Annualized Q2 sales multiple | 13.6× |
| 52-week range | $164.07–$236.54 |
Friday's close sat 74% through the 52-week range.
Consensus from 36 analysts: 56% Strong Buy, 42% Buy and 3% Hold.
Major technology companies are expected to spend more than $730B on AI infrastructure this year, versus $400B last year.
| Signal | Current reading | Investor sensitivity |
|---|---|---|
| China data-center compute | No Q3 revenue assumed | Policy relief could add upside; restrictions remain a risk |
| Gross margin | 74% Q3 midpoint | Another decline would challenge premium expectations |
| Operating expense | $9.2B guide | Growth must keep outrunning cost expansion |
| Guarantee exposure | $3.5B maximum | Land, power and shell commitments raise execution exposure |
Nvidia lost about $251B on Friday and surrendered roughly half of Thursday's earnings rally. The business still offers 106% revenue growth, but a 74% margin guide and a 13.6× annualized sales run-rate leave little room for ordinary execution.
Sources: Nvidia, Reuters, WSJ market data and Public analyst survey. Calculations use reported figures and may differ from vendor forward estimates.
Boeing’s 777-9 is nearing another crucial phase in certification. Over 620 777X orders are pending as the company aims for a first delivery in…
Certification progress versus margin, cash and labor risk
Market data: Aug. 28, 2026, 16:00 EDT
Program data through Aug. 29, 2026, 09:48 EDT
Group revenue grew 8%. Commercial losses narrowed, but the division still lost $322 million.
| Measure | Latest |
|---|---|
| Market value | $165.84B |
| 52-week range | $176.77–$254.35 |
| Range position | 42.6% |
| Q2 free cash flow | $631M |
| Q2 2025 free cash flow | -$200M |
| Debt, June 30 | $45.9B |
| Debt, March 31 | $47.2B |
| Analyst coverage | 32 ratings* |
*Accessible source gave the count, not a reliable recommendation split; no consensus is inferred.
The 777X represents about one in ten commercial backlog units. A clean certification finish can improve delivery mix and cash conversion. Another delay would keep inventory and customer-compensation risk elevated.
FAA findings, flight-test rework, supplier constraints and a labor stoppage could shift delivery timing. Program-level profitability is not disclosed, so backlog volume cannot be translated directly into earnings.
Sources: Boeing Q2 results · Boeing 777-9 update · Reuters labor report · MarketWatch close