Elastic Holds 21% Surge as Workday Gives Back Rebound08/27/2026 · 23:06 EDT OVERNIGHT U.S. EQUITIES · ACTIVE Elastic holds near 21% as Workday round-trips…
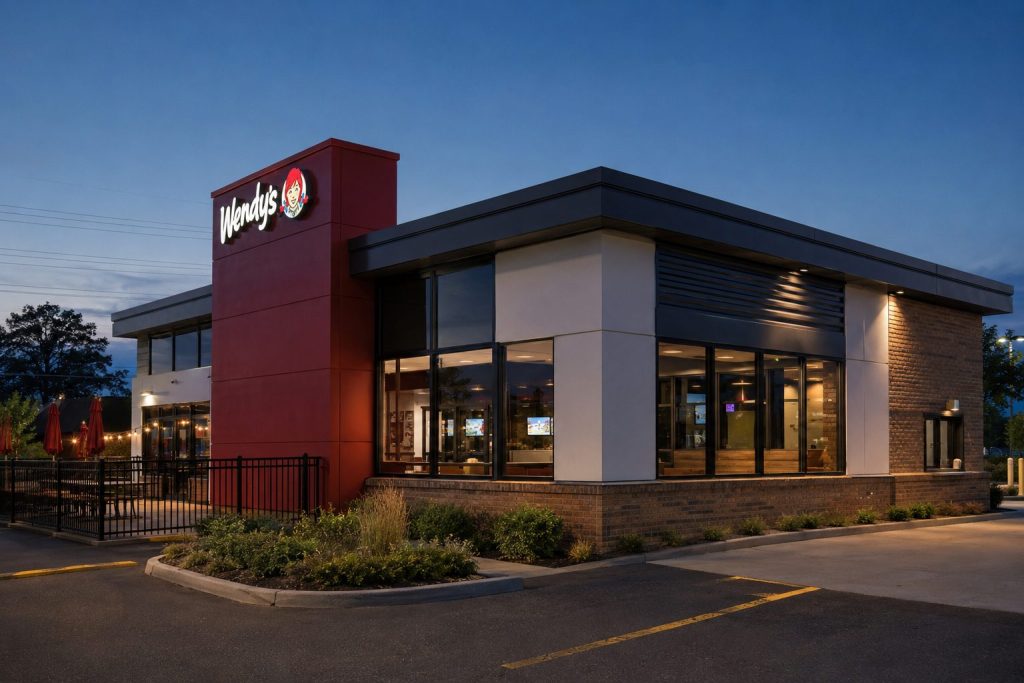
Shares in The Wendy’s Company dropped after Reuters disclosed that Trian Fund Management, led by Nelson Peltz, does not presently intend to make an…
·3 min read
NASDAQ: WEN · takeover premium reset
Wendy’s investor dashboard
Market data: Aug. 26, 2026, 19:59 EDT Dashboard prepared: Aug. 27, 2026, 05:08 CEST
After-hours price
$7.84
−13.27% · −$1.20
Quoted value erased
≈$229M
$1.20 × 190.67M shares
Analyst target gap
+$0.05
0.6% above $7.79 average
After-hours volume
2.52M
31.6% of regular-session volume
Bid-premium path
Regular closesAfter-hours repricing
Market-value bridge
Aug. 11 close$7.55≈$1.44B
Aug. 26 close$9.04≈$1.72B
Aug. 26 AH$7.84≈$1.49B
The late drop exceeded the roughly $212M added on Aug. 12.
Only about $55M of price uplift remained versus Aug. 11.
Trian owns about 16%; no formal bid price exists.
Operating dashboard · Q2 2026
Metric
Result
Year over year
Revenue
$570.6M
+1.7%
U.S. same-restaurant sales
—
−7.0%
U.S. systemwide sales
$2.88B
−8.2%
U.S. restaurant margin
13.8%
−240 bps
Operating profit
$79.3M
−24.0%
Net income
$32.6M
−40.8%
H1 free cash flow
$120.3M
+9.9%
Estimate pressure
Q3 2026 EPS
$0.10
FY 2026 EPS
$0.51
FY 2027 EPS
$0.54
FactSet current estimates on Aug. 26. One month earlier: $0.14, $0.57 and $0.64, respectively.
Peer valuation
Company
P/E
Consensus
Wendy’s
13.7x
Hold
Restaurant Brands
21.4x
Buy
Yum! Brands
19.5x
Buy
What moves the stock next
Deal path
A changed Trian stance, another bidder or a formal filing would rebuild optionality.
Traffic
U.S. same-store sales must improve from the Q2 decline.
Margins
Commodity and wage inflation are pressuring restaurant economics.
Next report
Q3 earnings are expected Nov. 11, 2026.
Sources: Reuters, The Wendy’s Company Q2 2026 release, FactSet via The Wall Street Journal, StockAnalysis and Investing.com. Market-value calculations use 190.67 million shares outstanding. After-hours prices can reflect limited liquidity and may not predict the next regular-session open.
Shares of NuScale Power Corporation dropped 5.50% on Wednesday. The decline pulled back nearly all of the previous session’s AI-driven increase. The move also…
·3 min read
NuScale Power Corporation · NYSE:SMR
Nuclear AI meets the commercialization gap
Market data: August 26, 2026, 16:00 EDT After hours: 19:59 EDT
Regular close
$9.27
−5.50% · range $9.06–$10.26
After hours
$9.36
+1.02% at 19:59 EDT
Trading activity
51.88M
1.35× recent average volume
Quoted value
$3.98B
429.72M shares outstanding
Two-session market-value bridge
Calculation: daily price change × 429.72 million shares. Tuesday added $0.76 per share; Wednesday removed $0.54.
AI claim versus reported economics
Technical retrieval timeUp to −80%
Quantified cost savingsNot disclosed
Q2 revenue$75K
Q2 R&D expense$18.43M
Q2 operating loss$64.00M
Financial signals
Revenue, year over year−99.1%
R&D, year over year+56.2%
Operating loss, year over year+48.6%
June liquidity$1.9B
First-half operating cash use$372.9M
First-half stock issuance$984.5M
Advanced-nuclear tape
Company
Close
Aug. 26
Revenue signal
Risk profile
NuScale Power
$9.27
−5.50%
$75K Q2
Pre-commercial
Oklo
$41.60
−6.03%
$1.21M TTM
Early revenue
NANO Nuclear
$18.50
−3.85%
$214K TTM
Development
BWX Technologies
$153.16
+2.29%
$3.51B TTM
Profitable supplier
Prices as of 16:00 EDT. BWXT rose after a fresh U.S. Army reactor selection; the early-stage developers fell.
Wall Street and valuation
Hold
6 Buy · 9 Hold · 2 Sell
$12.59
Average target · +35.8% vs close
$6–$20
Low-to-high target range
FactSet consensus as displayed August 26, 2026. Targets are estimates, not guarantees.
Catalyst timeline
Aug. 25Nuclear-specific AI deployment announced; proof of concept reports up to 80% faster retrieval.
Aug. 26SMR closes down 5.50% on 51.88 million shares.
Commercial gateBinding TVA power-purchase agreement remains under discussion with ENTRA1.
Next estimateThird-quarter results expected around Nov. 5; company has not confirmed the date.
Investor read-through
The 80% retrieval-time claim targets engineering productivity and schedule risk. It does not yet quantify lower R&D spending, faster licensing or contract revenue. The balance sheet extends the runway, but binding customer commitments remain the decisive valuation bridge.
Risks: Proof-of-concept results may not scale. Nuclear licensing, customer financing, manufacturing capacity, partner execution and dilution can overwhelm workflow savings.
Netflix announced on Wednesday that Emily in Paris Season 6 will debut on December 24. The concluding season continues a franchise that secured 30…
·3 min read
NASDAQ: NFLX · product/commercial catalyst
A 30M-view franchise gets its final date
Emily in Paris Season 6 lands December 24. The investor test is whether the finale sustains engagement while Netflix expands advertising and absorbs faster content amortization.
Regular close: Aug. 26, 2026, 16:00 EDT After-hours quote: Aug. 26, 19:24 EDT Dashboard: Aug. 26, 20:59 EDT
Regular close · Aug. 26
$81.46
−$0.77 · −0.94%
After hours · 19:24 EDT
$80.90
−0.69% from close
Regular volume
22.85M
54% of 65-day average
Market value · close
$342.4B
Day loss ≈$3.2B
Season 6 release file
PremiereDec. 24, 2026
StatusFinal season
Confirmed settingsParis, Greece, Monaco
Episode release patternNot disclosed
Title-level budgetNot disclosed
H2 2025 title engagement · Netflix-defined views
Emily in Paris Season 5 launched December 18, leaving 14 calendar days in the reporting half. Views equal hours watched divided by runtime.
Q2 2026 financial base
Revenue$12.6B
Revenue growth+13%
Operating income$4.2B
Operating margin33.4%
Margin change−70 bps YoY
2026 company outlook
Revenue$51.0B–$51.4B
Revenue growth13%–14%
Operating margin31.5%
Ads revenue≈$3.0B
Content amortization≈+10%
Stock and valuation
52-week range$65.08–$126.71
Below 52-week high−35.7%
P/E ratio25.7×
Shares outstanding4.16B
Short float · Aug. 142.19%
Analyst map · Aug. 26 close
ConsensusModerate Buy
Ratings55
Buy / Hold / Sell37 / 17 / 1
Average target$103.19
The close is 78.9% of the average target; implied upside is 26.7%.
Target range$70–$151.40
Investor bridge
Season 5 produced 30 million views in 14 calendar days. Season 6 can support membership retention and ad inventory, but Netflix reports neither title revenue nor cost. The company-level financial test is 13%–14% revenue growth with a 31.5% margin.
engagementretentionad inventorycontent cost
What can break the thesis
Views are not incremental subscriptions. Existing members may watch without changing churn, pricing power or ad demand. A weak finale could shorten engagement while roughly 10% content-amortization growth weighs on margin.
Dated checkpoints
Checkpoint
Date
Season 6 premiere
Dec. 24, 2026
First-week Top 10 data
After launch
Q4 revenue and margin
Next results cycle
2026 ads revenue outcome
Year-end
Sources: Netflix’s Aug. 26 Season 6 announcement; Netflix H2 2025 Engagement Report; Netflix Q2 2026 shareholder letter filed with the SEC; MarketWatch delayed quote; MarketBeat analyst record. Calculations use the Aug. 26 regular close.
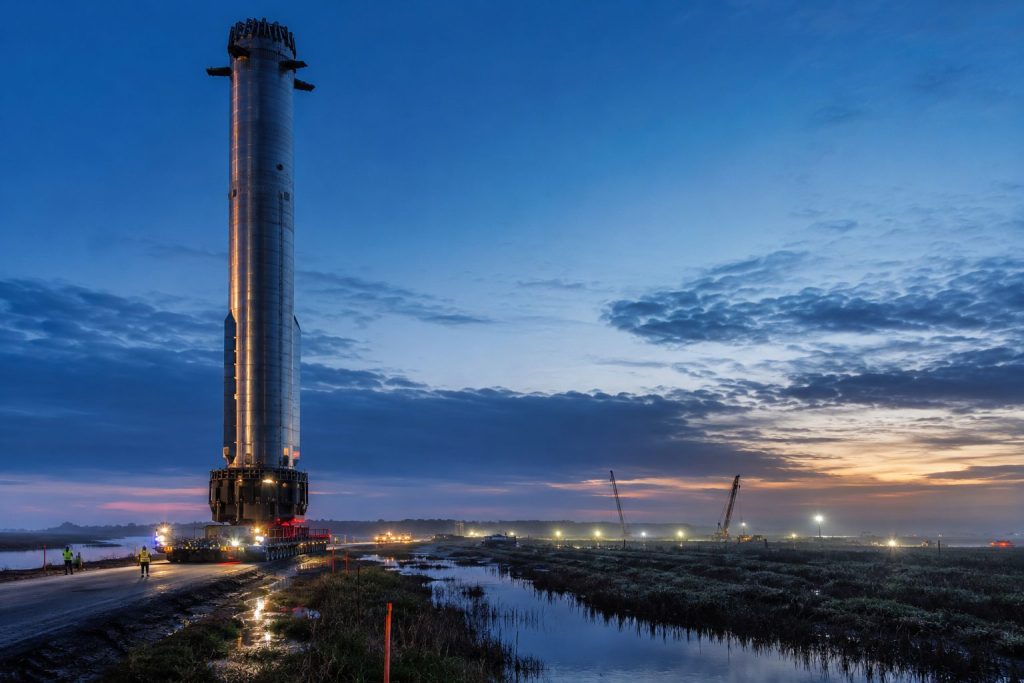
Shares in SpaceX advanced on Wednesday following the announcement of a $100 billion Louisiana spaceport. Space Exploration Technologies Corp. finished the session at $139.63,…
·3 min read
NASDAQ: SPCX · product/commercial catalyst
$100B Starbase meets a $100B cash pool
The Louisiana plan can expand Starship capacity across launch, Starlink and orbital AI. The valuation question is how SpaceX phases a project equal to all second-quarter liquidity.
Regular close: Aug. 26, 2026, 16:00 EDT After-hours quote: Aug. 26, 16:36 EDT Dashboard: Aug. 26, 19:58 EDT
Regular close · Aug. 26
$139.63
+$1.68 · +1.22%
After hours · 16:36 EDT
$139.05
−0.42% from close
Regular volume · Aug. 26
56.1M
Yahoo Most Active
Closing market value
≈$1.84T
Project equals 5.4%
Capital scale
Project spending is a total plan, not a disclosed one-year budget. Liquidity and backlog are as of June 30, 2026.
Louisiana buildout
Investment$100B
Site125,000 acres
Launch complexes5
Planned pads10
Construction target2027
First-launch target2029
Q2 2026 financial base
Total revenue$7.81B
Year-over-year growth+92%
Adjusted EBITDA$3.54B
Net result−$541M
Total capex$18.37B
Cash + securities$100B
Space segment
Q2 revenue$962M
Revenue growth+29%
Operating result−$542M
Adjusted EBITDA−$205M
Q2 capex$1.17B
H1 launches78
Commercial channels
Connectivity revenue$4.29B
Starlink subscribers12.0M
AI revenue$2.56B
Government awards>$6B
Total backlog$47.5B
Next resultsNov. 5, 2026
Analyst expectations · Aug. 26 close
ConsensusModerate Buy
Tracked ratings41
Buy / Hold / Sell27 / 8 / 6
Average target$220.20
Close is 63.4% of the average target; implied upside is 57.7%.
Target range$75–$800
Stock map · Aug. 26 close
Reference
Price
Distance
52-week high · June 16
$225.64
−38.1%
Average analyst target
$220.20
+57.7%
Aug. 26 close
$139.63
Base
IPO price · June
$135.00
+3.4%
52-week low · Aug. 3
$104.83
+33.2%
Investor bridge
Louisiana expands Starship launch capacity for three revenue engines: external launch services, Starlink deployment and orbital AI infrastructure. The $100 billion headline equals all June liquidity and 3.5 times first-half capex.
Starship cadenceStarlink capacityAI satellites
Execution risks
No annual spending schedule, financing plan or return target was disclosed. Starship reusability, permits, wetland mitigation and launch demand must advance before the campus can earn a return.
engineeringregulationcash burnenvironment
Project checkpoints
Checkpoint
Timing
What investors need
Phased budget
Not disclosed
Annual cash use, debt and partner funding
Permits and wetlands plan
Pre-construction
Schedule certainty and mitigation cost
Construction start
Expected 2027
Evidence the plan is funded and active
Starship scale-up
Ongoing
Reliability, reusability and lower launch cost
First Louisiana launch
Targeted 2029
Capacity begins supporting revenue channels
Sources: Louisiana Economic Development’s Aug. 25 announcement; SpaceX Q2 2026 results; Reuters; WSJ delayed quote; Yahoo Finance Most Active; MarketBeat analyst record. Calculations use the Aug. 26 regular close and approximately $1.84 trillion quoted market value.
New York, August 26, 2026, 19:49 – Oracle shares climbed 2.8%, increasing the company’s market capitalisation by $12 billion after Citi pointed to catalysts…
Forced selling may be fading.Credit spreads need to stabilize.At-the-market issuance remains a dilution test.Cloud delivery must turn backlog into billed revenue.
Fiscal 2026 growth engine
Metric
Value
Growth
Total revenue
$67.4bn
+17%
Total cloud
$34.0bn
+39%
Cloud infrastructure
$18.1bn
+77%
Cloud applications
$15.9bn
+11%
RPO
$638bn
+363%
RPO equals about 9.5 times annual revenue, but converts over several years.
Cash-flow bridge
Operating cash flow
$32.0bn
Capital expenditure
−$55.7bn
Free cash flow
−$23.7bn
FY26 debt raised
$43bn
FY26 equity raised
$5bn
Planned FY27 financing
≈$40bn
Planned FY27 financing includes a previously announced $20bn at-the-market equity program.
Large-cap software and cloud tape
Company
Close
Daily move
Market value
P/E
Oracle
$148.87
+2.84%
$433.5bn
26.7×
Microsoft
$496.37
+0.91%
$3.70tn
29.5×
Alphabet
$342.00
−1.40%
$4.18tn
17.2×
SAP ADR
$211.68
−2.45%
$247.1bn
—
August 26 U.S. close; latest trade timestamps ranged from 19:15 to 19:38 EDT.
Analyst range
$263.97
Average target across 39 analysts tracked by MarketBeat.
Low
$145
Average
$263.97
High
$400
Average implied upside
77.3%
What moved attention
August 26
Citi opened a positive 90-day catalyst watch. Oracle also held a financial analyst meeting at 10:45 CT.
Next 90 days
Investors will test cloud-capacity delivery, financing costs and signs that the historic selloff is losing force.
Investor scorecard
Backlog conversion: growth in cloud revenue versus the $638bn RPO balance.Capacity: new data-center and GPU deployment milestones.Cash: capital spending against operating cash generation.Funding: debt spreads, equity issuance and credit-rating pressure.
Risk register
Risk
Investor transmission
Watch point
Build delays
Defers contracted revenue
Capacity delivery
Negative cash flow
Raises external-funding needs
Capex and OCF
Equity issuance
Dilutes existing holders
$20bn ATM program
Credit pressure
Increases financing costs
Spreads and ratings
Customer concentration
Raises contract and renewal sensitivity
RPO mix
Sources: Oracle investor relations, Citi commentary reported August 26, Yahoo Finance, MarketBeat and consolidated U.S. market data. Market-value changes and peak-value gaps are estimates using the current implied share count; rounding may create small differences.
IREN Limited shares regained half of their decline from the regular session in after-hours trading on Wednesday. The stock climbed 3.21% to $40.85 at…
·3 min read
IREN: the earnings-day setup
Market snapshot: August 26, 2026, 19:34 EDT (August 27, 01:34 CEST). Prices after the U.S. regular close.
Regular close
$39.58
−6.23%
4:00:01 p.m. EDT
After hours
$40.85
+3.21%
7:34:29 p.m. EDT
Implied late value
$14.60bn
About 357.4m implied shares
Volume
37.45m
82.2% of 45.55m three-month average
One session, three valuation points
The regular decline erased an estimated $940m. Late trading recovered about $454m, leaving roughly $486m below Tuesday's value.
What the late valuation assumes
<3.7×
Implied after-hours market value divided by management's above-$4bn year-end AI Cloud ARR target.
Contract coverage
About 85% of the target ARR is under contract. Weighted average term: roughly four years.
GPU-capex prepayments
Customer prepayments cover about 45% of associated GPU capital spending.
Thursday's estimate range
Provider
Revenue
EPS
MarketBeat
$132.00m
−$0.55
Zacks preview
$138.89m
−$0.80
These are separate provider forecasts, not a blended consensus. Results: August 27. Call: 5:00 p.m. EDT.
Last reported quarter
Metric
Q3 FY26
Q2 FY26
Seq.
Revenue
$144.8m
$184.7m
−21.6%
Adjusted EBITDA
$59.5m
$75.3m
−21.0%
Net income/(loss)
−$247.8m
−$155.4m
Wider loss
Quarter ended March 31, 2026. Lower Bitcoin prices and mining-hardware retirements weighed on results.
AI Cloud execution map
New contracts
$2.8bn
Multiyear AI Cloud agreements disclosed July 20
2026 delivery
480 MW
Up from roughly 3 MW
2027 target
1.2 GW
Planned energized capacity
June cash
$7.6bn
Includes $1.7bn restricted cash
U.S.-listed AI infrastructure peers
Company
Close
Move
Value
Volume
IREN
$39.58
−6.23%
$14.15bn
37.45m
CoreWeave
$88.01
−0.03%
$48.54bn
12.13m
Nebius
$213.93
−3.62%
$58.16bn
9.17m
August 26 U.S. regular close. Source: Yahoo Finance.
Analyst expectations
$83
Average target across 21 analysts tracked by MarketBeat.
Low
$46
Average
$83
High
$105
Pre-results snapshot. Targets can change rapidly after earnings.
The four numbers that matter next
AI Cloud billed revenue: evidence that contracted ARR is converting on schedule.Deployment milestones: progress toward 480 MW during 2026.Funding bridge: remaining GPU capex after customer prepayments and restricted cash.Mining drag: the effect of Bitcoin prices and hardware retirements on cash generation.
Risk register
Risk
Transmission to investors
Watch point
Delivery delay
Pushes contracted ARR recognition outward
Energization and GPU-install dates
Capital intensity
Raises financing or dilution risk
Capex, prepayments and unrestricted cash
Customer concentration
Increases renewal and counterparty sensitivity
New contract mix
Mining volatility
Obscures the AI Cloud transition
Bitcoin economics and retired capacity
Sources: IREN filings and releases, Yahoo Finance, MarketBeat and Zacks. Market-value changes are estimates derived from Yahoo's August 26 closing price and market capitalization. Figures may differ because of rounding and after-hours liquidity.
Cre8 Enterprise Limited shares nearly tripled on Wednesday after the financial printer reported record customer activity. Nasdaq-listed Cre8 Enterprise Limited closed at $6.81, up…
·3 min read
NASDAQ: CRE · investor dashboard
A 165% move meets a backlog test
Cre8 Enterprise’s customer and IPO-filing update drove extreme turnover. The missing number is the backlog’s revenue and margin value.
Market data: Aug. 26, 2026 After-hours quote: 19:01 EDT Dashboard: Aug. 27, 2026, 07:01 HKT
Regular close · Aug. 26
$6.81
+$4.24 · +164.98%
After hours · 19:01 EDT
$6.26
−8.08% from close
Regular volume · Aug. 26
65.15M
75.5× 65-day average
Closing market value
≈$13.7M
0.81× FY2025 revenue
Six-session price path
Regular closes. The prior five sessions stayed between $2.48 and $2.60.
Catalyst scorecard
Customers at June 30550
Year-over-year growth+34.8%
Growth since Dec. 31+17.8%
HKEX IPO submissions64
IPO-submission growth+482%
Backlog value disclosedNo
FY2025 operating base
Revenue$16.82M
IPO-services revenue$8.11M
IPO services: 48.2% of revenue
Gross margin41.9%
Operating margin4.5%
Net income$678K
Cash and valuation
Cash at Dec. 31, 2025$7.03M
Operating cash flow$1.48M
Quoted-value gain≈$8.5M
Gain / FY2025 sales≈50.7%
Close / FY2025 sales0.81×
After-hours volume · 19:011.26M
Activity and coverage
Public float≈1.10M
Volume / float≈59×
Day range · Aug. 26$5.67–$8.60
52-week range$1.68–$14.64
Ratings on record1 Sell
Consensus targetNone
What the market priced
The update supplied demand indicators: more customers, more IPO submissions and a record backlog. Wednesday’s gain priced a conversion path worth about half one year’s sales.
550 customers64 IPO submissionsrecord backlog
What remains unproved
Cre8 did not give backlog dollars, delivery timing, new revenue guidance or margin guidance. Thin float, founder voting control and Hong Kong IPO cyclicality can magnify both gains and reversals.
small floatno target pricecontrolled company
Investor checklist
Next evidence
Why it matters
Current status
Backlog conversion
Turns workload into revenue
No value or schedule disclosed
Gross-to-operating margin
Tests capacity and labor leverage
41.9% gross; 4.5% operating in FY2025
Cash collections
Confirms revenue quality
$1.48M FY2025 operating cash flow
Trading normalization
Separates price discovery from float pressure
75.5× average volume on Aug. 26
Next results date
First hard conversion checkpoint
Not announced as of Aug. 26
Sources: Cre8 Enterprise Aug. 26 operating update; Cre8 FY2025 Form 20-F; MarketWatch delayed quote and volume; Finviz float data; MarketBeat rating record. Calculations use approximately 2.01 million shares outstanding. Market figures are timestamped above and may change.
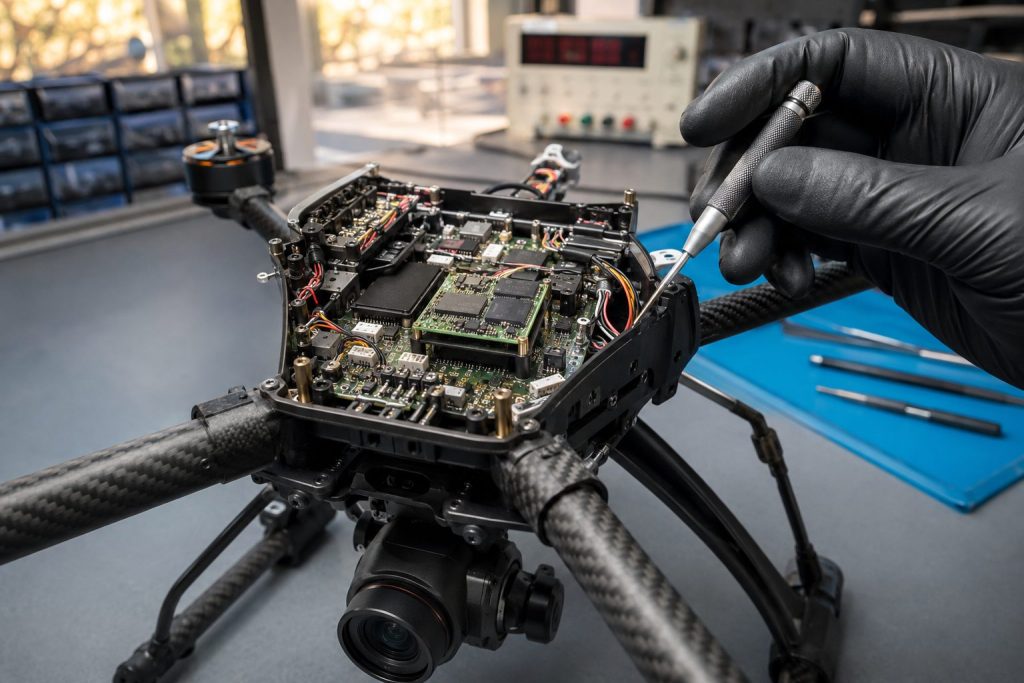
IRVINE, August 26, 2026, 18:49 – Lantronix shares climbed 12.5% in after-hours trade as the company reported its unmanned systems segment is on track…
·3 min read
NASDAQ: LTRX · Post-earnings monitor
Lantronix investor dashboard
Market data: August 26, 2026, 18:49 EDT (00:49 CEST). Financials: quarter and year ended June 30, 2026.
After-hours price
$6.37
+$0.71 · +12.5% from close
Net daily move
+8.7%
Versus August 25 close of $5.86
Value added
≈$23.8M
$0.51 × 46.59M shares
Regular volume
2.14M
August 26 regular session
What changed after the close
The 12.5% after-hours jump more than offset the regular-session decline. The combined gain was $0.51, or 8.7%, from Tuesday's close.
Quarter and near-term guide
Q4 revenue$31.2M · +8% YoY
Q4 adjusted gross margin44.1% · +350 bps
Q4 GAAP / adjusted EPS−$0.01 / $0.04
Q1 FY27 revenue guide$31M–$33M
Q1 FY27 adjusted EPS$0.04–$0.06
Fiscal 2026 revenue mix
IoT Systems
$58.3M
Embedded IoT
$53.6M
Software & Services
$9.0M
+15.6%Embedded YoY
−15.2%Systems YoY
+15.6%Software YoY
Unmanned systems: the rerating case
Signal
FY26 actual
FY27 target / context
Revenue
$12.6M
15%–20% of total revenue
Share of company sales
10.4%
+4.6 to +9.6 points
Active engagements
>30
About 10 at FY26 start
Equity value added
≈$23.8M
1.9× FY26 unmanned revenue
The valuation calculation uses the $0.51 gain from the August 25 close and 46.59 million year-end shares.
Balance sheet and dilution
Metric
June 2026
June 2025
Change
Cash
$60.5M
$20.1M
+$40.4M
Debt
$0
$11.8M
Eliminated
Shares outstanding
46.59M
39.10M
+19.2%
GAAP net loss
$4.2M
$11.4M
63.2% narrower
Acquisition signal
Vecima Industrial IoT / Nero
Expected annual revenue$5.3M
Expected recurring revenue$4.5M
Managed tracking tags≈125,000
Pro forma software mix>10%
Analyst expectations
ConsensusModerate Buy
Analysts7
Average target$10.40
Range$8–$12
Upside from $6.3763.3%
Published consensus before post-results revisions; checked August 26, 2026.
What investors should test next
Growth proofQ1 revenue at or above $32M midpoint
Mix proofUnmanned systems approaching 15%–20%
Quality proofGross margin holds near recent gains
Legacy dragIoT Systems decline stabilizes
Risk monitor
Long drone qualification cycles can delay revenue, while project timing makes quarterly orders uneven. Rising memory costs could compress margins. Acquisition integration and further share issuance would weaken per-share gains. The central invalidation signal is failure to convert more than 30 engagements into volume shipments while legacy systems revenue continues to fall.
Sources: Lantronix fiscal Q4/FY2026 release and earnings call; Yahoo Finance market data; MarketBeat analyst consensus. Non-GAAP measures exclude items defined by Lantronix and are not substitutes for GAAP results.
SANTA CLARA, California, August 26, 2026, 18:04 – Marvell Technology stock gained 3.6% in after-hours trading, with options traders positioning for an anticipated $22…
·3 min read
NASDAQ:MRVL · Company · Stock move
Marvell: a $22 billion earnings hinge
Market snapshot: August 26, 2026, 18:03:50 EDT
After hours +3.62%
After-hours price
$253.97
+$8.86 from the close
Value added after close
≈$8.0B
Implied market cap ≈$228.2B
Options move
±10%
≈$22.0B from closing value
Q2 revenue consensus
$2.71B
About +35% year over year
Price path
Regular close: August 26 at 16:00:01 EDT. After-hours quote: 18:03:50 EDT. Total gain from the prior close: 5.65%.
What options are pricing
From the after-hours price, the options upper bound offered 6.2% upside. The lower bound represented 13.1% downside. The skew shows how Wednesday’s late rally consumed much of the bullish move.
Recent options signal published August 24, 2026; range recalculated from the August 26 closing price.
Fiscal Q2 setup
Metric
Expectation / guide
Change
Revenue consensus
$2.71B
≈+35% YoY
Adjusted EPS consensus
$0.93
+38.8% YoY
Company revenue guide
$2.70B ±5%
+11.7% QoQ midpoint
Adjusted EPS guide
$0.93 ±$0.05
$0.88–$0.98
Non-GAAP gross margin
58.25%–59.25%
58.9% in Q1
Diluted share count
915M expected
Company guide
Prior-quarter base
Q1 revenue growth
+28%
Q2 expected growth
+35%
Q1 non-GAAP GM
58.9%
Fiscal Q1 revenue was a record $2.418 billion. Non-GAAP net income reached $718 million, while operating cash flow hit a record $638.8 million.
The key test is conversion: exceptional AI bookings must become revenue without pushing gross margin below the guided range.
Valuation and analyst bar
Measure
Value
Read-through
Trailing P/E
84.2×
Premium leaves little room for a weak guide
Closing market cap / Q2 revenue
81.3×
One quarter, not an annual multiple
Annualized Q2 price/sales
≈20.3×
Assumes the quarter repeats
Yahoo one-year target
$266.36
+4.9% from after-hours price
Susquehanna target
$265
Positive; +4.3% from after hours
Rosenblatt target
$300
Buy; +18.1% from after hours
Price, P/E and consensus-target snapshot: August 26, 2026, 18:03:50 EDT. Fresh brokerage targets were reported August 25.
Google agreement: revenue versus dilution
Potential sales
Up to $120B
Warrant shares
58.97M
Q2 share dilution
6.4%
Google can buy the warrant shares at $206.58. Most vest only when product-purchase thresholds are met through fiscal 2033. Dilution is therefore tied to sales conversion.
Peer valuation at the August 26 close
Company
Session move
Trailing P/E
Marvell
+1.97%
84.2×
Nvidia
−1.52%
31.9×
Broadcom
−0.33%
97.6×
AMD
+0.36%
123.6×
Marvell sits between Nvidia and higher-multiple custom-compute peers. Its earnings must validate optical-networking growth and the custom-silicon pipeline.
Peer close data retrieved August 26, 2026, 17:52 EDT.
Thursday checklist
Fiscal-year revenue guidance and any raise.
Optical-interconnect sequential growth.
Custom XPU and Google-linked revenue timing.
Gross margin versus the 58.25%–59.25% range.
Operating cash conversion after the Q1 record.
Celestial AI and XConn acquisition contribution.
Risk map
Expectations: An in-line quarter may not support the multiple.
Margin: Memory and optical-component costs can compress profitability.
Execution: Custom silicon ramps require long design and qualification cycles.
Dilution: Google warrants equal 6.4% of guided diluted shares.
Tape: Regular volume was only 39% of the three-month average.
Next confirmed catalyst
Fiscal Q2 2027 results and conference call — August 27, 2026, 16:45 EDT. The market will compare any guidance raise with a $228 billion implied after-hours valuation and the 10% options move.
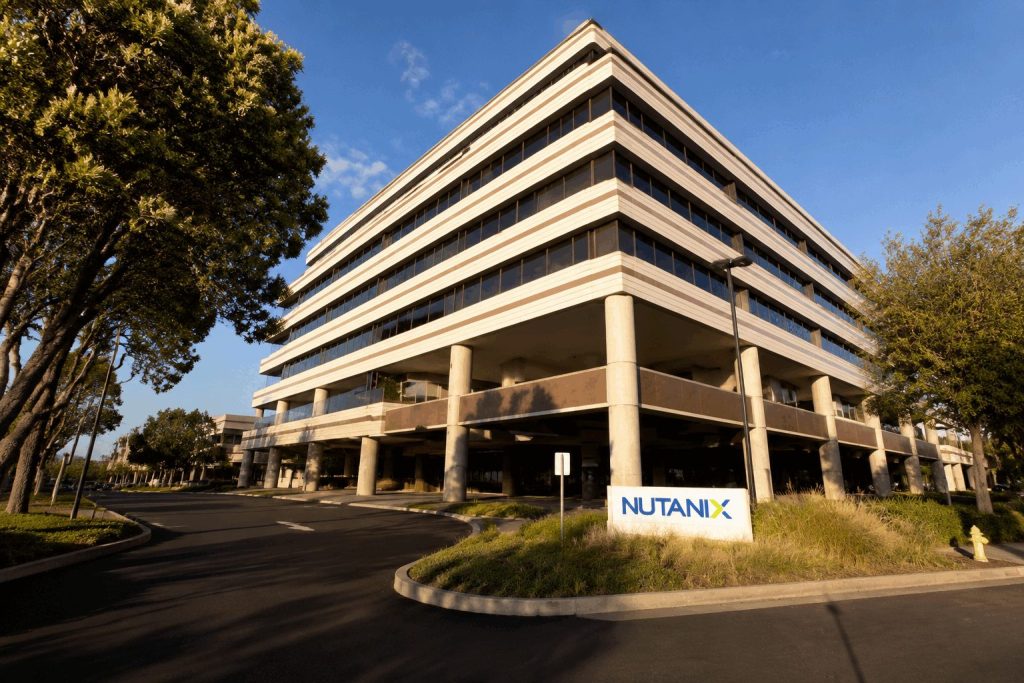
Nutanix Inc. shares rose 7.2% in after-hours trading on Wednesday. The hybrid-cloud firm surpassed analyst forecasts for both revenue and profit in the quarter.
·2 min read
NASDAQ: NTNX · Earnings reaction
Nutanix investor dashboard
Market data: Aug. 26, 2026, 17:22 EDT Financials: quarter ended July 31, 2026
After-hours price
$70.10
+$4.71 · +7.20%
Equity value added
$1.27B
Estimated from 270.32M shares
Trading activity
4.66M
1.88× 2.48M average volume
52-week position
74%
$34.01 low · $82.42 high
Quarterly surprise
Metric
Actual
Consensus
Beat
Revenue
$757.1M
$738.3M
+$18.8M
Adjusted EPS
$0.60
$0.49
+$0.11
Growth and margin
Q4 FY2025Q4 FY2026
Operating scoreboard
Metric
Q4 FY26
Q4 FY25
Change
Revenue
$757.1M
$653.3M
+16%
ARR
$2.55B
$2.20B
+16%
Adj. gross margin
87.7%
88.3%
−60 bps
Adj. operating margin
26.2%
18.3%
+790 bps
Free cash flow
$277.6M
$207.8M
+34%
Fiscal 2027 guide
Revenue$3.18B–$3.23B
Midpoint growth12.5%
Adj. operating margin24%–25%
Free cash flow$850M–$950M
Q1 revenue$755M–$765M
Q1 adj. operating margin26%–28%
Implied market cap
$18.95B
At $70.10 after hours
FY27 sales multiple
5.9×
Using $3.205B midpoint
FY27 FCF multiple
21.1×
Using $900M midpoint
Analyst setup
Moderate Buy
18 ratings · $64.21 mean target before results
What moved the stock
Revenue exceeded consensus by 2.5%. Adjusted operating margin expanded 790 basis points. ARR kept pace with quarterly revenue at 16% growth. Fiscal-2027 guidance preserved double-digit sales growth while keeping adjusted operating margin near one quarter of revenue.
Risk monitor
Adjusted gross margin fell 60 basis points. Server supply constraints can delay deployments and cash collection. The after-hours price already exceeds the pre-report average analyst target. Extended-hours liquidity can exaggerate moves.
Sources: Nutanix fiscal Q4/FY2026 release; MarketBeat earnings estimates and analyst consensus; StockAnalysis after-hours quote and share data. Valuation figures are calculated estimates. Prices and volume are time-sensitive.
PLEASANTON, California, August 26, 2026, 17:41 EDT — Veeva Systems advanced 8.2%, adding $3.3 billion in market capitalization, after the company raised its sales…
SUNNYVALE, California, August 26, 2026, 17:27 — Synopsys slipped 2.8%, losing $2.2 billion in market value, after the company raised its forecast bolstered by…
·3 min read
NASDAQ: SNPS · Company · Stock move · Earnings
Synopsys: a beat, a raise, and a $2.2B valuation warning
AI demand strengthened the numbers. The after-hours tape said the size of the raise still mattered.
August 26, 2026 17:31 EDT · After hours
After-hours price
$398.65
−2.77% · −$11.35
Regular close: $410.00
Equity value erased
$2.17B
After-hours
191.48M shares × $11.35
Q3 revenue
$2.477B
+42.4% YoY
1.6% above consensus
Adjusted EPS
$3.91
+6.5% vs estimate
$3.67 consensus · $3.39 YoY
The market's message
The quarter beat. The forecast raise was modest.The annual revenue midpoint increased by roughly $45M, or 0.47%. At about 95× trailing earnings, a small upgrade left little room for upside surprise.
Regular closePost-earnings move
Trading snapshot
Regular range$403.54–$419.60
Volume2.51M
Average volume1.81M
Volume vs average+38.7%
Market cap at close$78.51B
Trailing P/E95.0×
Where growth came from
Design Automation revenue$2.003B · +52.7%
80.9% of Q3 revenue · includes Ansys
Design IP revenue$473.8M · +10.8%
19.1% of Q3 revenue · returned to YoY growth
Margin signal
Non-GAAP operating margin41.6%
Design Automation margin45.2% · +70 bp
Design IP margin26.5% · +640 bp
GAAP operating margin14.4%
Large acquired-intangible amortization keeps the GAAP and adjusted views far apart.
Pre-earnings snapshot. New notes can change the distribution.
Peer valuation
Synopsys P/E95.0×
Cadence P/E66.6×
SNPS premium42.7%
SNPS AH move−2.77%
CDNS AH move+0.55%
What investors should watch next
1 · Design IP
Sequential growth in Q4
Confirms that the recovery extends beyond one quarter.
2 · Ansys integration
$2.98B expected FY revenue
Synergies must offset amortization, restructuring and leverage.
3 · Multiple support
95× trailing earnings
High expectations make the stock sensitive to modest raises.
Sources: Synopsys fiscal Q3 2026 results; Reuters; Google Finance. Market figures timestamped August 26, 2026, 17:31 EDT. Price data may be delayed. Calculations use disclosed figures and may differ slightly because of rounding.
PALO ALTO, California, August 26, 2026, 17:03 — HP Inc's stock dropped 9.0%, erasing $2.5 billion in market value, after the company reported a…
·3 min read
HP Inc. · NYSE:HPQ
Price/mix beat, unit-demand warning
Market snapshot: August 26, 2026, 17:02 EDT
After hours · −9.03%
After-hours price
$27.77
−$2.75 from the $30.52 close
Value erased
≈$2.5B
Implied from the closing market cap
Revenue surprise
+8.6%
$15.68B vs $14.44B consensus
Adjusted EPS surprise
+25.8%
$0.83 vs $0.66 consensus
Why the stock reversed
PC units
−16%
PC revenue
+18%
Print revenue
−2%
The divergence matters. A simple revenue-to-units calculation implies roughly 40% higher Personal Systems revenue per unit. Pricing and premium mix did the heavy lifting while underlying unit demand contracted.
Printing’s 2% decline is important because the segment has carried far higher margins. In fiscal Q2, Personal Systems margin was 5.2%; Printing margin was 18.3%.
Tariff refunds added $0.11 to Q3 EPS and are expected to add $0.19 for the year. The annual benefit equals 5.9% of the new guidance midpoint.
Valuation and peer context
Company
Aug. 26 close
Session move
Market cap
P/E
HP (HPQ)
$30.52
+3.39%
$28.23B
11.3×
Dell (DELL)
$463.82
+2.77%
$304.27B
37.0×
Apple (AAPL)
$313.45
+1.16%
$4.61T
36.0×
Logitech (LOGI)
$100.19
+1.56%
$14.53B
18.4×
HP’s lower multiple prices in a structurally weaker mix and limited unit growth. At the $27.77 after-hours price, the $23.41 one-year analyst target implied 15.7% downside. The $3.1 billion free-cash-flow midpoint equaled roughly 12% of implied after-hours equity value.
Peer prices and valuation snapshot: August 26, 2026, approximately 16:45–16:50 EDT. HP after-hours valuation is an estimate using the closing share count.
Signals to watch
PC unit guidance and price elasticity after the 16% shipment decline.
Memory-cost timing versus price increases.
Premium and AI-PC mix after the revenue-per-unit jump.
Printing revenue and supplies trajectory.
Cash conversion behind the $3.0–$3.2 billion FCF guide.
Risk map
Demand: Higher prices may suppress replacement units.
Margins: Memory inflation may arrive before pricing catches up.
Mix: PC growth has lower margins than Printing.
Quality: Tariff refunds are nonrecurring.
Sentiment: The analyst target remains below the traded price.
Immediate catalyst
HP fiscal Q3 earnings call — August 26, 2026, 17:30 EDT. The market needs a bridge from strong revenue to sustainable unit growth and margins. Guidance on memory supply, pricing, Printing and refund-adjusted earnings will set the next move.


![US Stock Market Today 08/27/2026 [UPDATE: 23:06 EDT] [Elastic Holds 21% Surge as Workday Gives Back Rebound]](https://ts2.tech/wp-content/uploads/2026/08/US-market-dashboard-2026-08-27-2302-1024x683.jpg "US Stock Market Today 08/27/2026 [UPDATE: 23:06 EDT] [Elastic Holds 21% Surge as Workday Gives Back Rebound]")
![Australia Stock Market Today 27/08/2026 [UPDATE: 15:41 AEST] [MinRes Reversal Deepens ASX Selloff as Ramsay Defies Rout]](https://ts2.tech/wp-content/uploads/2026/08/AU-market-dashboard-2026-08-27-1540-1024x683.jpg "Australia Stock Market Today 27/08/2026 [UPDATE: 15:41 AEST] [MinRes Reversal Deepens ASX Selloff as Ramsay Defies Rout]")